ABSTRACT
LOU, XUEMEI. Methods Evaluation and Application in Complex Human Genetic Diseases. (Under the direction of Dr. Zhao-Bang Zeng and Dr. Elizabeth R. Hauser.)
One of the most important tasks in human genetics is to search for disease susceptibility genes. Linkage and association analyses are two major approaches for disease-gene mapping. Chapter 1 reviewed the development of disease-gene mapping methods in the past decades. Gene mapping of complex human diseases often results in the identification of multiple potential risk variants within a gene and/or in the identification of multiple genes within a linkage peak. Thus a question of interest is to test whether the linkage result can be
explained in part or in full by the candidate SNP if it shows evidence of association, and then provide some guidance for the next time-consuming step of positional cloning of
susceptibility genes. Two methods, GIST and LAMP, which access whether the SNP can partially or fully account for the linkage signal in the region identified by a linkage scan, are evaluated on Genetic Analysis Workshop 15 (GAW15) simulated rheumatoid arthritis (RA) data and discussed in Chapter 2. The simulation results showed that GIST is simple and works slightly better than the LAMP-LE test when there is little linkage evidence. The LAMP linkage test has limited power when there is not much linkage evidence, and the LAMP association test is the best not only when the linkage evidence is extremely high, but also when there is some LD between the candidate SNP and the trait locus. The fact that complex traits are often determined by multiple genetic and environmental factors with small-to-moderate effects makes it important to investigate the behavior of current
association tests is closely correlated with the amount of LD between marker and disease loci, and these tests maintain good power to detect multiple risk variants in a small region with a moderate degree of LD for fully genotyped families. Global tests, such as FBAT-LC are sensitive to the presence of at least one susceptibility variant, but are not helpful for selecting the most promising SNPs for further study. We reported that if multiple haplotypes are associated with different disease loci, the haplotype tests results can be misleading while the APL-OSA conditional test has the greatest power to properly dissect the clustered associated markers for all cases with an acceptable type I error rate ranging from 0.033 to 0.056. We applied APL-OSA conditional test on GENECARD samples, and got reasonable results. One linkage region of particular interest on chromosome 3 was identified by two independent genome linkage scan with Coronary Artery Disease (CAD). Multiple disease susceptibility genes have been reported from this region, and there are also linkage evidence that this region may harbors a gene or genes determining HDL-C levels. Within this region, a search for HDL-C QTL and analyses of the relationship between genetic variants, HDL-C level to CAD risk are discussed in Chapter 4. We performed CAD association and HDL-C QTL analysis on two independent datasets. We identified SNP rs2979307 in the OSBPL11 gene which survives a Bonferroni correction. We observed different HDL-C trends with HDL-C associated SNPs. Even with the evident heterogeneity presented in our CAD
Methods Evaluation and Application in Complex Human Genetic Diseases
by Xuemei Lou
A dissertation submitted to the Graduate Faculty of North Carolina State University
In partial fulfillment of the Requirements for the degree of
Doctor of Philosophy
Bioinformatics
Raleigh, North Carolina 2008
APPROVED BY:
__________________________ __________________________
Elizabeth R. Hauser Greg Gibson
__________________________ ___________________________
Eric Stone Zhao-Bang Zeng
ii
DEDICATION
To my dearest husband and son
iii BIOGRAPHY
iv
ACKNOWLEDGEMENTS
I am very grateful for the advice of my advisor, Dr. Elizabeth R. Hauser, throughout my doctoral studies. She is always patient and nice with me, and provides very helpful suggestions for the problems I encounter during my research. I am proud of working with her. I also would like to thank Dr Zhao-Bang Zeng, Dr. Greg Gibson and Dr. Eric Stone for their comments and advice on my research during our committee meetings. I would like to thank Dr. Bruce S. Weir for his encouragement and kind help during the first two years of my doctoral work, especially for his advice on my course selection.
I would like to thank the staff at the Bioinformatics Research Center, especially Juliebeth Briseno, who answered so many questions I had about graduate school regulations. I also thank Dr. Silke Schmidt at Center for Human Genetics (CHG) at Duke University for her advice and comments on my research. I would like to thank Ren-Hua Chung and Xuejun Qin for all discussions I have had with them in the past years. I also appreciate the support from members in AGENDA group at CHG for answers and suggestions for all kinds of technical problems I have met.
v
TABLE OF CONTENTS
List of Tables ... viii
List of Figures ... ix
1 Introduction ... 1
1.1 Introduction to disease-gene mapping ... 2
1.2 Linkage analysis ... 4
1.3 Association analysis ... 5
1.3.1 Population-based association analysis ... 6
1.3.2 Family-based association analysis ... 7
1.3.3 Association in the Presence of Linkage method ... 10
1.3.4 Multiple markers association methods ... 11
1.4 Associated variants accounting for linkage methods ... 13
1.5 The scope of this dissertation ... 15
2 Comparison of GIST and LAMP on the GAW15 simulated data ... 16
2.1 Background ... 17
2.2 Methods... 18
2.2.1 GIST ... 18
2.2.2 LAMP ... 19
2.2.3 Dataset and Analysis ... 19
vi
2.3 Results ... 21
2.3.1 Characteristics of trait Loci and surrounding region ... 21
2.3.2 Power comparison between GIST and LAMP tests ... 22
2.3.3 Comparison of MERLIN and LAMP Linkage test, PDT and LAMP-LE test ... 24
2.4 Discussion ... 24
2.5 Conclusions ... 25
2.6 Acknowledgements ... 25
2.7 Tables ... 26
3 Genetic association tests under models including multiple susceptibility
variants ... 29
3.1 Introduction ... 30
3.1.1 Single-marker single genetic risk variant association methods ... 31
3.1.2 Multiple Markers and Single Genetic Risk Variant ... 31
3.1.3 Multiple Markers and Multiple Genetic Risk Variants ... 32
3.2 Methods... 33
3.3 Results ... 38
3.3.1 Single-marker methods comparison ... 38
3.3.2 Multiple-markers methods comparison ... 39
3.3.3 Application to the GENECARD data ... 42
3.4 Discussion ... 44
vii
3.6 Figures... 52
4 Modeling joint contributions of genes and HDL-C level to CAD risk ... 53
4.1 Introduction ... 54
4.2 Materials and Methods ... 58
4.2.1 Early-onset CAD family-based sample (GENECARD). ... 58
4.2.2 Case-control sample (CATHGEN). ... 59
4.2.3 Measurement of lipids ... 61
4.2.4 SNP Selection and Genotyping ... 61
4.2.5 Statistical Analysis ... 63
4.3 Results ... 67
4.3.1 Clinical Characteristics of Study Subjects ... 67
4.3.2 Evaluation of HDL-C Association with single markers ... 67
4.3.3 Evaluation of multiple markers and HDL-C Association ... 71
4.4 Discussion ... 72
4.5 Tables ... 76
4.6 Figures... 85
5 Conclusion ... 90
5.1 Summary ... 91
5.2 Future direction ... 94
viii
LIST OF TABLES
Table 2.1 Characteristics of trait Loci and surrounding region ...26
Table 2.2 Power comparison of GIST and LAMP at the SNP closest to trait locus ...27
Table 2.3 Power comparison of GIST and LAMP within ±5 cM of trait locus ...28
Table 3.1 Outline of simulated data sets with varying LD ...48
Table 3.2 Comparison of APL, LAMP and FBAT single marker tests in Cases 1, 2, 3, with 2 disease susceptibility alleles each with relative risk of 3.0. (1000 replicates) ...49
Table 3.3 Comparison of APL-OSA conditional test, APL-Haplotype and FBAT-LC in Case 1, 3, 4 and 5, RR (D1, D2) = 3.0, 1000 replicates ...50
Table 3.4 Allele frequency of D1 and D2 in family subset identified by APL-OSA in one replicate of Model L-L-H ...51
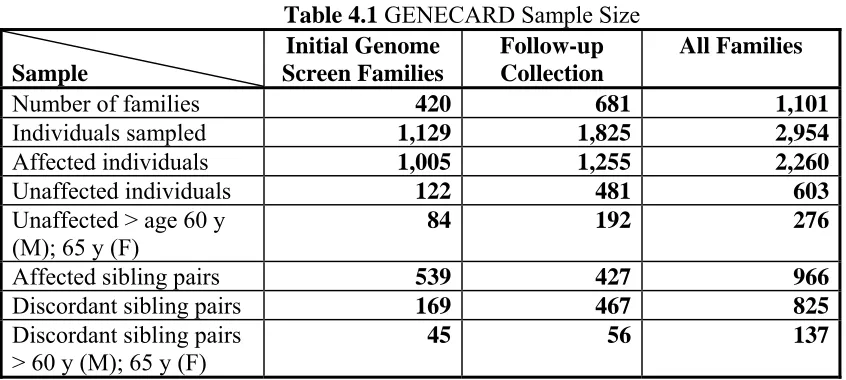
Table 4.1 GENECARD Sample Size ...76
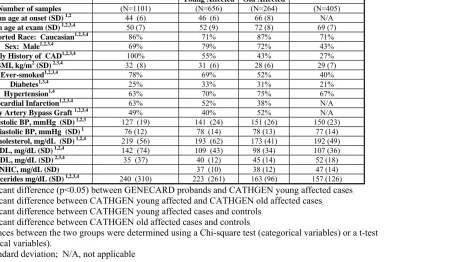
Table 4.2 Clinical Characteristics of GENECARD and CATHGEN subjects ...77
Table 4.3 Top 20 SNPs for Mean of HDL-C by Genotypes in the CATHGEN ALL group ..78
Table 4.4 Top 20 SNPs for Mean of HDL-C by Genotypes in the CATHGEN YA group ....79
Table 4.5 Top 20 SNPs for Mean of HDL-C by Genotypes in the CATHGEN OA group ....80
Table 4.6 Top 20 SNPs for Mean of HDL-C by Genotypes in the CATHGEN ON group ....81
Table 4.7 Top 6 SNPs with HDL-C association of the QTDT test in GENECARD data ...82
Table 4.8 Model assignment of Markers in CATHGEN/GENECARD dataset ...83
ix
LIST OF FIGURES
1
Chapter 1
2 1.1 Introduction to disease-gene mapping
Gregor Mendel was an Augustinian priest and scientist, and is often called the father of
genetics. He published his paper “Experiments of Plant Hybridization” in 1865, which
later became Mendel’s law of inheritance. Mendel’s work prompted the foundation of the
discipline of modern genetics. Mendelian disorders refer to diseases for which alternative
genotypes fall into distinct, discrete phenotypic classes, following Mendel's laws of
inheritance. One of the major tasks in human genetics studies is to search for disease
susceptibility genes. Positional cloning is a method of gene identification. This method
identifies and maps genes solely based on a specific phenotype, and no biological
knowledge regarding the phenotype is required (Botstein & Risch 2003). Largely by the
process of positional cloning, disease-gene mapping has been fairly successful for
Mendelian disorders (Risch 2000). Over a thousand monogenic Mendelian diseases genes
have been reported in “the online version of Mendelian Inheritance in Man” database
(OMIM) (Antonarakis & McKusick 2000).
The formation of complex diseases involves the interaction among multiple genes and
multiple environmental risk factors. Alzheimer’s disease, type-2 diabetes and cancer and
Coronary Artery Disease (CAD) are some examples of complex diseases. Consequently,
disease-gene mapping for complex diseases is much more challenging than mapping
genes for Mendelian disorders. The challenges include genetic heterogeneity in which
mutations in different genes can cause the same disease phenotype (Lander & Schork
1994; Risch 2000), and incomplete penetrance, phenocopies, and late age of onset also
3
Despite these hindering factors, disease-gene mapping for complex diseases have
obtained substantial achievements. For example, Y402H,a commonvariant in the
complement factor H gene (CFH) is strongly associatedwith Age-related macular degeneration (AMD), reported by two totally independent research groups (Haines et al. 2005; Klein et al. 2005).
Across the human genome, about 99.9% of the genome is identical between people, but
there are still millions of differences among the 3.2 billion base pairs (Kruglyak &
Nickerson 2001). These genetic variations can cause phenotypic variation among people
and are potentially associated with traits or diseases. Genetic markers, which are
nucleotide variants with known positions, are often used for human disease analyses.
There exist several types of genetic markers, for example, Restriction Fragment Length
Polymorphisms (RFLP’s), microsatellites, and single nucleotide polymorphisms (SNPs).
Markers can be used to construct a genetic map, which can be used as a reference for
disease-gene mapping (Dib et al. 1996). Botstein et al. (Botstein et al. 1980) proposed the concept using RFLP’s as the markers to construct a genetic map. Later, denser
microsatellites were used to construct genetic maps (Murray et al. 1994; Dib et al. 1996). SNPs, which usually contain two alleles, have become the standard polymorphisms
nowadays for higher resolution genetic disease-mapping due to their abundance
throughout the human genome (Kruglyak 1997; Sachidanandam et al. 2001). It was estimated that there are around 7.1 million SNPs with a minimal allele frequency of at
least 0.05 in the human population (Kruglyak & Nickerson 2001). In the current build 129
of dbSNP, the number of SNPs in this public database is around 18 million including 6.6
4
completion of the International HapMap Project have made genome-wide association
(GWA) analyses of hundreds of thousands of single nucleotide polymorphism (SNP)
markers possible.
Specific statistical methods for disease-gene mapping with numerous markers are
required. There are two types of commonly used statistical methods, linkage and
association (linkage disequilibrium) analyses (Lander & Schork 1994) and they will be
introduced in the following sections.
1.2 Linkage analysis
Theoretical methods for linkage tests were proposed around 1930 (Penrose 1935; Fisher
1935a; Fisher 1935b). Linkage analyses are used to find chromosome regions that
potential harbors a proposed disease susceptibility gene or gene(s). Linkage evidence is
often measured by the logarithm (base 10) of the odds (LOD) score (Morton 1955), which
is the logarithm of a likelihood ratio with the recombination rate θestimated from the
observed data with respect to random recombination (θ = 0.5) in the model. A traditional
LOD score posits that a single locus contributes to the disease with a specific model of
inheritance (e.g., dominant or recessive). Hence, this type of method is called parametric
as it requires a genetic model assumption. Parametric linkage analyses may not very
powerful for complex diseases, since an obvious genetic segregation of markers cannot be
observed in the polygenic disorders (Weeks & Lathrop 1995).
5
Kong & Cox 1997; Whittemore & Tu 1998). These methods evaluated genetic markers in
pairs of affected relatives in a pedigree to see how often a particular copy of a
chromosome region is shared by identical-by-descent (IBD), that is, is inherited from a
common ancestor (Lander & Schork 1994). A significant departure of the observed
frequency of IBD sharing at a locus from the expected IBD sharing by chance implies the
presence of linkage. A major advantage of the allele-sharing method is that it assumes no
model for the inheritance of a trait. Therefore, it is referred as a non-parametric model.
Allele sharing methods tend to be more robust than parametric linkage analysis even in
the presence of incomplete penetrance, phenocopy, genetic heterogeneity, and high
frequency disease alleles, but are often less powerful than a correctly specified parametric
linkage analysis (Lander & Schork 1994).
Linkage analysis can also be classified as two-point or multipoint analyses (Kruglyak et al. 1996). For two-point linkage analysis, only one marker and the disease locus are considered when calculating the statistic. For multipoint linkage analysis, several markers
are considered simultaneously with the disease locus. Thus, we can define the most likely
position of the disease locus on the marker map.
1.3 Association analysis
Linkage analysis may lack power for common diseases caused by multiple genes and
environmental factors (Cardon & Bell 2001). Since the linkage test uses LOD scores
instead of a statistical significance test to measure the degree of linkage evidence in data,
6
claim a significant finding (Lander & Kruglyak 1995; Risch & Botstein 1996; Curtis
1996; Morton 1998). The identified linkage regions are also often broad up to 40
megabases (Cardon & Bell 2001). Association analysis can be used as a complementary
method to linkage analysis. The association test can be more powerful than the linkage
test, and it requires fewer samples than linkage analysis to achieve the same power for
common complex diseases (Risch & Merikangas 1996).
Association analysis tests whether the disease and marker alleles are in linkage
disequilibrium (LD). Disease phenotypes are used for association analyses instead of
disease loci since, in general, the disease loci are unknown (Weiss & Terwilliger 2000).
LD generally spans only small distances, and the markers used for association analysis
are often very tightly spaced. Therefore, association analysis provides a higher resolution
for locating disease genes than linkage analysis. A very common strategy in the past for
identifying complex disease genes is to conduct linkage analyses first and then follow
significant results with tests for association at a denser panel of markers in an attempt to
further localize the disease gene (Cardon & Bell 2001).
In the terms of samples, there are two types of statistical methods for association analysis,
population-based (case-control and case-cohort studies) and family-based studies (Laird
& Lange 2006).
1.3.1 Population-based association analysis
Population-based analysis requires samples to be independently collected. It compares the
7
and unaffected individuals (controls) (Risch 2000). A contingency table can be created
and the Pearson chi-squared statistic or Fisher’s exact test can be used to test for
association. Regression-based analyses such as logistic regression can also be used in the
case-control test (Agresti 2002). The major concern of the case-control analysis is that the
presence of confounding effects in the samples could give rise to a high false positive rate
in the analysis (Risch 2000; Devlin et al. 2001). For example, population admixture and population substructure can produce association between unlinked loci (Ewens &
Spielman 1995). Two major types of approaches were proposed to solve this problem:
genomic control (GC) (Devlin & Roeder 1999; Devlin et al. 2001) and structured analysis (SA) (Pritchard et al. 2000).
1.3.2 Family-based association analysis
A widely used family-based method, the TDT (Spielman et al. 1993), compares the differences of alleles transmitted and untransmitted from parents to affected siblings in
triad families (one affected offspring and both parents). A McNemar’s chi-squared test is
used for the paired transmitted and untransmitted statistics. The TDT was originally
proposed to test for linkage in the presence of association, but it is also a valid test for
association in the presence of linkage (Ewens & Spielman 2005). In terms of statistical
power, the TDT has similar power compared with case-control studies for association
tests when the number of triad families is equal to the number of cases and the number of
cases is equal to the number of controls for case-control studies (McGinnis et al. 2002). Hence, it costs less to perform case-control studies for association, since collection of
family samples generally requires more time and money (Laird & Lange 2006). However,
8
present in the data (Ewens & Spielman 1995), because the test is conditional on parental
data.
In the TDT, each pair of transmitted/untransmitted alleles from a parent to an affected
sibling is treated as independent to construct the McNemar’s test. However, as a test for
association in a linkage region, this assumption does not hold for transmissions between
affected siblings. Hence, the TDT is not a valid test for association when more than one
affected sibling is used and there is linkage between marker and disease loci (Martin et al. 1997). One solution is to randomly select one affected sibling from each family and
perform the TDT (Wang et al. 1996). However, affected sibling pairs can significantly increase the power and efficiency of the family-based association test (Risch 2000). Thus,
it is not an optimal solution for the TDT to use only one affected sibling in the family
when there are other affected siblings. Numerous extensions and generalizations of the
TDT have been proposed in the literature.
Martin et al. (Martin et al. 1997) proposed the Pedigree Disequilibrium Test (PDT) to account for linkage in families with multiple affected siblings. PDT treats the
transmissions from a parent to the affected sib pair as a unit, and the unit can be shown to
be independent between parents. The PDT statistic and its variance were constructed
based on the unit of transmissions and avoids the independence assumption between
affected siblings used in TDT. The TDT was also generalized to extended pedigrees. In
Martin et al. (Martin et al. 2000), the extended pedigrees are partitioned into several related nuclear families, and the transmissions in each related nuclear family sums to a
9
between each extended pedigree. Abecasis et al. (Abecasis et al. 2000b) also used a similar strategy as Martin et al. (Martin et al. 2000) that generalized the TDT to extended pedigrees.
When parental genotypes for the affected siblings are missing, Spielman et al. (Spielman
& Ewens 1998) proposed the S-TDT test to compare the difference of allele frequencies
between affected and unaffected siblings without using parental data. However, S-TDT
still has the requirement that only one affected sibling with one unaffected sibling should
be used in each family for a valid test for association in the presence of linkage. S-TDT
was generalized to multiple affected sibs in Horvath and Laird (Horvath & Laird 1998) as
the SDT test.
Another approach to deal with missing parental genotypes is to infer the missing parental
genotypes from siblings’ genotypes and then compares the number of alleles transmitted
and untransmitted from parents to affected siblings (Weinberg 1999). Knapp (Knapp
1999) proposed “reconstruction combined TDT” (RC-TDT), which reconstructs missing
parental genotypes based on siblings’ genotypes first and then performs the combined
TDT and TDT test. However, because of the same property inherited from TDT and
S-TDT, RC-TDT is not a valid test for association in the presence of linkage when multiple
affected siblings are used in the data.
Clayton (Clayton 1999) proposed a score test derived from the likelihood of parental
genotypes and offspring genotypes conditional on disease in the offspring. The score test
10
TRANSMIT. The inference of missing parental genotype in TRANSMIT is based on
Mendelian probabilities for the siblings, which assumes the transmissions to the affected
sibs are independent. The inference is appropriate when there is no linkage between
disease and marker loci, but it can inflate the type I error rate in a linkage region by
ignoring linkage when inferring the missing parental genotypes with multiple affected
sibs in the data in TRANSMIT (Martin et al. 2003).
1.3.3 Association in the Presence of Linkage method
Linkage between disease and marker loci should be considered when inferring the
missing parental genotypes based on siblings’ genotypes with multiple affected sibs
present in the data (Martin et al. 2003). Martin et al. (Martin et al. 2003) proposed The Association in the Presence of Linkage (APL) method, which uses nuclear families with
at least one affected offspring. The APL compares the difference between the number of
copies of a specific allele in affected offspring and the expected number under the null
hypothesis of no association conditional on parental genotypes. The APL can infer
missing parental genotypes properly in the linkage region by taking the IBD parameters
for affected siblings into consideration. Hence, APL does not have the problem of
possible inflation of the type I error rate, as in TRANSMIT, if linkage is present and
multiple affected siblings’ data are used (Martin et al. 2003). Martin et al. (Martin et al. 2003) demonstrated that APL can have more power than PDT and FBAT (Rabinowitz &
Laird 2000) for nuclear family data with missing parents. Hence, APL provides a useful
family-based association tool for late-onset diseases in which parental data are usually not
11
Chung et al. (Chung et al. 2006) extended the original APL proposed in Martin et al. (Martin et al. 2003) to be flexible for mixed nuclear family structures (including the mixture of singleton and multiplex families with an arbitrary number of unaffected sibs)
using a variance estimator based on the bootstrap approach (Efron & Tibshirani 1993)
and a strategy of inference for missing parental genotypes based on IBD status between
multiple affected siblings.
Rabinowitz and Laird (Rabinowitz & Laird 2000) proposed an unified approach to
family-based association tests (FBAT), which compared the difference between the
transmissions from parents to the affected siblings and the expected value conditional on
the minimum sufficient statistics for the null distribution. This approach is robust to
population stratification, and it is applicable to arbitrary pedigree structure and arbitrary
missing allele information. FBAT implements a broad class of Family Based Association
Tests, and is another powerful family based association method.
1.3.4 Multiple markers association methods
Gene mapping of complex human diseases often results in the identification of several
potential risk variants within a gene and/or in the identification of several genes within a
linkage peak. Methods to test for multiple markers simultaneously are also being
developed to meet the need for additional tests including multiple markers.
There are two kinds of family-based methods to test for multiple markers. One class of
tests that take advantage of the correlation of closely positioned markers in the genome is
12
there is at least one marker associated with the disease, the global test gives a significant
result. FBAT-MM (Rakovski et al. 2007) and FBAT-LC(Xu et al. 2006) are examples of this kind of method for family data. Both FBAT-MM and FBAT-LC used the statistics
for single-marker tests, and then linearly combine them with different weights. The other
class of tests is haplotype-based tests, regression-based tests (Rakovski et al. 2007) and sum of single-marker statistics tests (Hao et al. 2004), which can be used to avoid the problem of multiple testing by combining all SNPs into a single omnibus test.
A haplotype is a set of closely linked genetic markers present on one chromosome which
tends to be inherited together. Another way to think about it is that a haplotype is a “super
allele”. Haplotype analyses can show more power than single-marker analyses if the joint
linkage disequilibrium (LD) between markers and the disease locus is stronger than the
pairwise LD between a single marker and the disease locus (Morris & Kaplan 2002;
Nielsen et al. 2004). The null hypothesis of a global haplotype test is that none of the haplotypes are associated with the disease. The global test can also have more power than
individual haplotype tests since individual haplotype testing has the multiple-testing issue
13
1.4 Associated variants accounting for linkage methods
After fine-mapping association studies narrowed the linkage region to a disease trait to
about one or a few centimorgans (cM), researchers have tried different ways to further
narrow the fine-mapping results to guide the next step of positional cloning, which is
time-consuming and involves intensive laboratory work (Yuan et al. 2004). Thus a question of interest is which associated SNP (or combination of these SNPs) in the region
identified by linkage analysis influences susceptibility to the trait. Sun et al. (Sun et al. 2002) proposed an approach based on the observation that if a particular SNP is the only
polymorphism in the region that influences the trait, then conditional on the genotypes at
that SNP for the affected relatives, there should be no unexplained allele oversharing in
the region among affected individuals.
Sun’s approach identifies SNPs whose genotypes can fully explain the observed linkage
signal, but their test does not identify SNPs that partially explain the linkage signal, which
is more realistic in complex diseases. Li et al. (Li et al. 2004) proposed a Genotyped-IBD Sharing Test (GIST) to access whether alleles could account in part for the observed
linkage signal. This approach determines if families selected on the basis of the presence
of the tentatively associated allele show stronger evidence of linkage as measured by
increased allele sharing identical by descent (IBD) by affected family members (Li et al. 2004).
The above methods are based on IBD data, which usually can be inferred only from the
14
Yuan et al., (Yuan et al. 2004) using genotype data, developed a statistical hypothesis-testing method to pinpoint a SNP, or SNPs, suspected of responsibility for a disease trait
linkage among a set of SNPs tightly linked in a region (Yuan et al. 2004). This method used genotype data of affected individuals or case-control studies, which are widely
available in research groups. This method can be used for singleton data, relative pair
data, or general pedigree data.
Li et al. (Li et al. 2005) proposed a likelihood-based approach, Linkage and Association Modeling in Pedigrees (LAMP), which quantifies the degree of LD between the candidate
SNP and the putative disease locus through joint modeling of linkage and association
through a likelihood function of the marker data conditional on the trait data for a sample
of affected sib pairs, with disease penetrances and disease-SNP haplotype frequencies as
parameters. Model parameters were estimated by maximum likelihood and two
likelihood-ratio tests were proposed to access whether the candidate SNP can partially or
fully explain the linkage signal (Li et al. 2005).
This group of tests is neither a test of linkage nor a test of association. An SNP may be
tightly linked or in significant linkage disequilibrium with the causal polymorphism yet
still not be able to fully explain the linkage signal observed in the region (Yuan et al. 2004). The purpose of these tests is to pinpoint SNPs of real interests for guidance of
15 1.5 The scope of this dissertation
One linkage peak region identified by a linkage scan could harbor multiple disease
susceptibility loci, and multiple causal alleles could exist in one disease gene (Duerr et al. 2006; Cohen et al. 2006). The complexity within the linkage peak region could result in contradicting results for different association methods, thus it is crucial to investigate
those methods where there are multiple risk variants which models the real complex
disease situations. Two methods, GIST and LAMP, which access whether the SNP can
partially or fully account for the linkage signal in the region identified by a linkage scan,
are evaluated on Genetic Analysis Workshop 15 (GAW15) simulated rheumatoid arthritis
(RA) data and discussed in Chapter 2. Since the GAW15 simulated RA data has an
unrealistic linkage peak (LOD=60) on chromosome 6, it is hard to discriminate between
methods. We simulated simplified multiple risk variants models, where several single
marker association tests and multiple markers association tests are compared and
described in Chapter 3. LAMP is also evaluated under this multiple risk variants setting
and is described in Chapter 3 as well. From a linkage region on chromosome 3 identified
by two independent genome linkage scan with Coronary Artery Disease (CAD), multiple
disease susceptibility genes have been reported (Connelly et al. 2006; Wang et al. 2007; Wang et al. 2008). Within this region with multiple susceptibility genes, a search for HDL-C QTL and analyses of the relationship between genetic variants, HDL-C level to
CAD risk are discussed in Chapter 4. Finally, some possible ideas for future work are
16
Chapter 2
Comparison of GIST and LAMP on the
17 2.1 Background
The goal of a gene mapping study is to identify genetic variants that predispose to human
diseases. For a complex disease, investigators often map the locus of interest first by
linkage analysis, which typically results in a large candidate genomic region of up to 40
Mb in size. To localize the susceptibility allele more precisely, disease-marker association
analyses are performed, using a much denser map of genetic markers within the linkage
region. One particular method of association analysis is based on comparing marker
allele frequencies between unrelated cases and controls. In this design, only a subset of
the samples originally collected for linkage analysis can be used. As an alternative,
family-based association methods have been developed. The classic family-based
transmission/disequilibrium test was proposed to test for association in the presence of
linkage in family trios containing two parents and one affected offspring (Spielman et al. 1993). This approach has been extended to other family structures (Martin et al. 2000). If a SNP shows evidence of association, a hypothesis of interest is whether the linkage
result can be explained in part or in full by the candidate SNP. The Genotype IBD
Sharing Test (GIST) (Li et al. 2004) and Linkage and Association Modeling in Pedigrees (LAMP) (Li et al. 2005) are two methods that were specifically proposed to address different aspects of this question. The purpose of our study was to evaluate the
performance of GIST and LAMP on the simulated GAW15 data. We used the answers to
18 2.2 Methods
2.2.1 GIST
GIST considers one particular marker allele as tentatively associated with the disease
variant, and calculates family-specific weight variables defined by the presence of this
allele. The variable has to be defined in such a way that the weight variable and IBD
sharing configuration among affected family members at that same locus are uncorrelated
if there is no disease-marker association, also called the “unbiased selection scheme”. If
there is a significant correlation between family-specific weights and family-specific
linkage evidence, this suggests that the SNP allele could account in part for the observed
linkage signal. GIST calculates three kinds of family-specific weight variables,
corresponding to dominant, recessive, or additive inheritance models (Li et al. 2004).
Once a weight variable W has been defined, the sample correlation coefficient between family weights W and family-specific NPL scores Z is computed. Under no disease-marker association, this correlation is expected to be zero and a one-sided test may be
performed. A transformation of the correlation coefficient (Xi, i=dom, rec, add) that is
asymptotically standard-normally distributed is used as the test statistic. When we do not
know the underlying disease model, an alternative to carrying out all three tests in GIST
is to useXmax =max(Xdom,Xrec,Xadd). The distribution of Xmax under no disease-marker
association is estimated empirically by simulating a large number of ASPs under no
linkage for various allele frequencies (Li et al. 2004). The test based on Xmax should be
the most appropriate test as we usually do not know the true genetic model for a complex
19
2.2.2 LAMP
LAMP quantifies the degree of linkage disequilibrium (LD) between the candidate SNP
and the putative disease locus through joint modeling and estimation of linkage and
association parameters. LAMP constructs a likelihood of the marker data conditional on
the trait data for a sample of families with disease penetrances and disease-SNP haplotype
frequencies as parameters. Model parameters are estimated by maximum likelihood.
Three likelihood ratio tests are proposed to characterize the relationship between the
candidate SNP and the disease locus. The first test assesses whether the candidate SNP
and the disease locus are linked (LAMP Linkage test). The second test is the direct
association test, which assesses whether the candidate SNP and the disease locus are in
partial LD so that the SNP may account in part for the linkage signal (LAMP-LE test, H0:
r2=0). The third test is an indirect association test, which assesses whether there are other variants which can explain the linkage signal (LAMP-LD test, H0: r2=1). If the null
hypothesis of complete LD between the SNP and the disease allele is rejected, the SNP
does not fully explain the observed linkage signal, and there may be multiple disease
variants in this region (Li et al. 2005).
2.2.3 Dataset and Analysis
We used all 100 replicates of the simulated GAW 15 family dataset to evaluate the power
of GIST and LAMP. Each replicate included 1500 nuclear families of size 4 (2 parents
20
All SNP markers on chromosome 6, 7, 8, 9, 11, 16 and 18 (a total of 3069 SNPs) were
analyzed by GIST and LAMP. We also analyzed genotypes at all eight trait loci with
LAMP. For GIST, we used the family-specific NPL scores at the location of the
maximum multipoint LOD score on each chromosome, using the microsatellite markers
(Abecasis et al. 2002; Li et al. 2005). LAMP was run without any flanking markers. To compare the LAMP results to standard methods for linkage and association analysis, we
also calculated the average multipoint LOD score at the SNP closest to the trait locus,
using the SNP markers, and performed family-based association analysis of each SNP
with the pedigree disequilibrium test (PDT) (Martin et al. 2000; Li et al. 2005). LD analysis for 50 SNP markers surrounding each trait locus was performed with GOLD,
using the replicate 1 data only (Abecasis & Cookson 2000; Li et al. 2005).
2.2.4 Power Calculation
The power to reject the null hypothesis of GIST and LAMP-LE was defined in two
different ways: If we consider all SNP markers in the region defined by the true trait locus
± 5 cM as the correct candidates, the power was estimated by the proportion of replicates
with at least one p-value above a threshold value. If we only consider the SNP closest to
the trait locus as the candidate SNP, the power was estimated by the proportion of
replicates in which the p-value at this SNP was above a threshold value.
The threshold value was set differently for each test. Since chromosome 7 does not
contain any trait loci, the analysis results (p-values) obtained for this chromosome across
the 100 replicates define a null distribution for the hypothesis of “no linkage and no
21
independent under this null hypothesis (Chung et al. 2007), this hypothesis implies the null hypothesis of GIST (no correlation between family-specific NPL-scores and weights
derived from “non-associated” genotypes). Therefore, this is the relevant null distribution
for the GIST combined test and LAMP-LE test. The 5th percentile value of the chromosome 7 p-value distribution for each test was set as the threshold value (false
positive rate α=0.05).
To derive a null distribution for the LAMP-LD test (r2 =1), we analyzed genotypes at the actual trait loci. Due to the complexity of the GAW15 simulation model, we do not have
the perfect null situation. Since a basic assumption of LAMP is the presence of only one
disease variant in the region, we decided not to use the trait loci on chromosome 6 and 9.
Despite the fact that none of loci A, B, E and F are “pure” disease susceptibility loci, we
used these loci as the best guess approximation for the null distribution for the LAMP-LD
test.
2.3 Results
2.3.1 Characteristics of trait Loci and surrounding region
In order to evaluate different methods, it is useful to gain a better understanding of the
simulated data first. Table 2.1 lists the risk allele frequency at each trait locus, pairwise r2 values between the closest SNP marker and each trait locus, the number of markers in the
22
than 0.05. In other words, there is not much LD among the markers in the + 5 cM region.
From table 2.1, we can see that Locus C and F have a major risk allele. Locus D has a
rare minor risk allele with frequency less than 0.05. r2 values between Locus C, D, E and F and the closest SNP are over 0.1, while r2 values between Locus A, B, G, H and the respective closest SNP are practically 0. The maximum r2 values in the + 5 cM region around Locus A, B, G, H are all less than 0.02. The linkage evidence for chromosome 6 is
overwhelmingly high, but only modest NPL-based LOD scores were obtained for
chromosomes 11 and 18. For chromosomes 8, 9 and 16, the NPL-based LOD scores are
close to those for the “null” chromosome 7.
2.3.2 Power comparison between GIST and LAMP tests
The empirical 5% threshold value obtained from the chromosome 7 analysis was 0.0515
for the GIST combined test, and 0.04 for LAMP-LE. The empirical 5% threshold values
for LAMP-LD from Locus A, B, E and F were 0.08, 0.04, 0.02 and 0.14. Since only 100
replicates were available, these values were consistent with a 0.05 nominal p-value. Using
these empirical thresholds, the power to reject the null hypotheses of GIST and
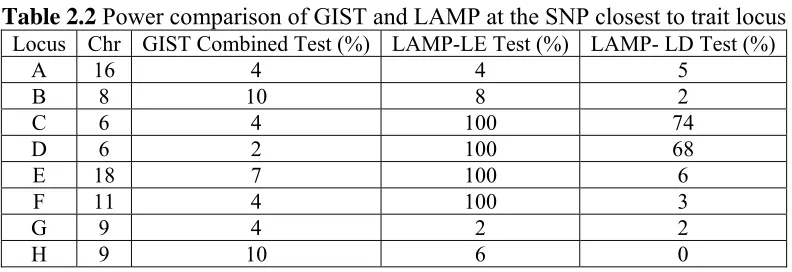
LAMP-LE at the closest SNP is shown in Table 2.2. The power of the GIST combined test is low
for each trait locus, while LAMP-LE has 100% power to reject the null hypothesis for the
closest SNP when there is at least moderate LD between the candidate SNP and the trait
locus, such as Locus E. Like GIST, the LAMP-LE test has similarly low power for Locus
23
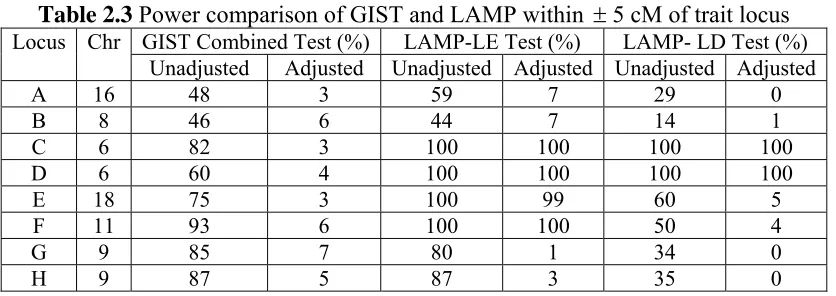
The power comparison of GIST and LAMP-LE across a + 5 cM region is shown in Table
2.3. Using the same threshold values as for Table 2.2, we calculated the power with and
without adjustment for multiple testing. The Bonferroni correction for multiple testing
corresponds to dividing the respective thresholds by the number of markers in the 10 cM
region surrounding each locus. In Table 2.3, the unadjusted power of the GIST combined
test is reasonably high for all trait loci, but after adjusting for multiple testing, it is
similarly low as in Table 2.2. The LAMP-LE test still has almost 100% power to reject
linkage equilibrium when there is at least moderate LD (i.e., r2≥0.145), even with
adjustment for multiple testing, but, as expected, has low power when there is no LD, e.g.
Locus A, B, G and H, as in Table 2.2. The power of the LAMP-LE test increases when r2
increases.
The pattern of the power estimates for the LAMP-LD test is similar in Tables 2.2 and 2.3,
and consistent with expectations. The power decreases when r2 increases, and also depends on the magnitude of the linkage evidence. For Locus C and D, both on
chromosome 6 with very strong linkage evidence, the power to reject the null hypothesis
of complete LD with a single susceptibility variant is high, even though there is almost
complete LD with the closest SNP (r2=0.94). Locus G and H are also located on the same chromosome, but they show little linkage evidence and hence the power to reject
complete LD is low. For Locus A and B, LAMP-LD has low power to reject complete
LD, presumably also because of little linkage evidence. Since Locus E has a lower r2 value with the closest SNP than Locus F, and they both have moderate linkage evidence,
24
2.3.3 Comparison of MERLIN and LAMP Linkage test, PDT and LAMP-LE test
We compared the results from the LAMP linkage test with a standard linkage analysis
using MERLIN, and also compared results from the LAMP-LE association test with PDT
(data not shown). These comparisons suggest that the linkage and association tests from
LAMP for these family structures are very similar to the linkage test implemented in
MERLIN and the family-based association test implemented in PDT, respectively.
2.4 Discussion
We have completed GIST and LAMP analysis on eight totally different trait loci for
rheumatoid arthritis simulated in GAW15 using SNPs that mimic a 10K SNP chip set and
microsatellite markers. Our results from applying linkage and association tests to the data
are consistent with the genetic effects and levels of LD for each chromosome.
GIST can only be applied to affected sibship data and considers only genotypes at the
tentatively associated SNP, without incorporating flanking markers. In theory, GIST can
detect association in regions with little overall evidence for linkage. Our results show that
the GIST combined test performs poorly even in cases which would seem to be favorable
for detecting an associated SNP (both linkage and LD). A possible reason for the failure
of GIST to detect associated alleles is because of the multiple loci interacting to affect the
RA hazard, and the overwhelming genetic heterogeneity, perhaps even within-family
heterogeneity. Since the linkage evidence is very modest on chromosomes 11, 16, and 18
(average LOD scores <1), there is also little power to detect association to the disease
25
LAMP can be applied to general pedigree data, including affected and unaffected
individuals, and can incorporate flanking markers. Our study shows that LAMP-LE
works well when there is at least moderate LD between marker and disease variant, even
when r2 values are as low as 0.145. The major disadvantage of LAMP is the speed. For large and sparsely genotyped pedigrees, LAMP can be painfully slow and such pedigrees
must be trimmed or discarded in practice.
2.5 Conclusions
GIST is simple and fast once family-specific NPL scores and weight variables have been
computed, but it did not perform well in the GAW15 simulated data. LAMP is more
flexible and more powerful, but much slower. LAMP seems to work particularly well
when there is at least moderate LD between the candidate SNP marker and the trait locus.
2.6 Acknowledgements
We gratefully acknowledge programming assistance from Xuejun Qin and Mike Schmidt.
This research was supported by the National Institutes of Health (NEI R03 EY015216,
26
2.7 Tables
Table 2.1 Characteristics of trait Loci and surrounding region
Trait Loci Closest SNP ±5cM region
Average Max NPL (SD) on Chromosome
Chr Locus cM Risk
Allele Frequency
Marker cM r2 Number
of markers
Maximum
r2
A 16 26.29 0.3658 SNP16_31 26.31 0.008 15 0.016 0.60(0.60)
B 8 170.9 0.3992 SNP8_442 167.6 0.002 10 0.006 0.53(0.47)
C 6 49.46 0.8688 SNP6_153 49.46 0.551 48 0.953 62.99(7.76)
D 6 54.57 0.0418 SNP6_162 54.62 0.958 22 0.958 62.99(7.76)
E 18 94.27 0.3797 SNP18_269 94.22 0.145 26 0.145 1.21(0.91)
F 11 115.29 0.6123 SNP11_389 115.28 0.94 41 0.94 0.84(0.63)
G 9 49.40 0.0938 SNP9_185 49.32 0.007 48 0.014 0.56(0.48)
H 9 51.41 0.1663 SNP9_192 51.40 0 45 0.011 0.56(0.48)
27
Table 2.2 Power comparison of GIST and LAMP at the SNP closest to trait locus
Locus Chr GIST Combined Test (%) LAMP-LE Test (%) LAMP- LD Test (%)
A 16 4 4 5
B 8 10 8 2
C 6 4 100 74
D 6 2 100 68
E 18 7 100 6
F 11 4 100 3
G 9 4 2 2
28
Table 2.3 Power comparison of GIST and LAMP within ±5 cM of trait locus
Locus Chr GIST Combined Test (%) LAMP-LE Test (%) LAMP- LD Test (%) Unadjusted Adjusted Unadjusted Adjusted Unadjusted Adjusted
A 16 48 3 59 7 29 0
B 8 46 6 44 7 14 1
C 6 82 3 100 100 100 100
D 6 60 4 100 100 100 100
E 18 75 3 100 99 60 5
F 11 93 6 100 100 50 4
G 9 85 7 80 1 34 0
29
Chapter 3
Genetic association tests under models
30
3.1 Introduction
Complex traits are often determined by multiple genetic and environmental factors with
small-to-moderate effects (Hao et al. 2004). Under such assumptions, association tests
arguably offer enhanced statistical power compared to the classical linkage approach in
searching for genetic loci (Hao et al. 2004). To date, evaluations of association tests have
been largely limited to single disease susceptibility alleles but models for complex disease
may include more than one disease susceptibility allele. The observed allelic association
(AA) between disease phenotype and marker genotypes partially depends on the strength of
linkage disequilibrium (LD) between the alleles of the disease-causing locus and the
observed marker loci. LD decays with increasing genetic distance more rapidly than linkage,
and, therefore, a set of closely-spaced markers is a prerequisite to map a disease locus using
association approaches. The traditional way to uncover multiple risk variants is to test each
SNP sequentially, then adjust for multiple testing to control the false-positive rate. Thus the
null hypothesis of traditional association approaches is there is no marker associated with the
risk variant. The alternative hypothesis is there is one marker associated with a single genetic
risk variant. One of the most discussed threats to the validity of genetic association tests is
population stratification, which refers to differences in allele frequencies between cases and
controls due to systematic differences in ancestry rather than association of genes with
disease. Family-based association methods have the advantage of avoiding false positive
results caused by population stratification because they have internal controls within families.
Different family-based association tests adopt different approaches to utilize family data of
31
3.1.1 Single-marker single genetic risk variant association methods
The introduction of the Transmission/Disequilibrium Test (TDT) was one important
landmark in the popularization of association studies (Spielman et al. 1993). It detects
apparent transmission distortion from parents to affected offspring. The TDT, which was
originally restricted to parent-offspring triads, has been extended to a variety of family
structures. The Pedigree Disequilibrium Test (PDT) extended the TDT idea to larger
pedigrees, but requires unaffected siblings to substitute for the missing parents (Martin et al.
2000). The APL (Association in the Presence of Linkage) test, works only on nuclear
families, but it can infer missing parental genotypes with or without unaffected siblings’
genotypes (Martin et al. 2003). FBAT (Family-Based Association Test), also works on
extended pedigrees, and it can infer missing parental genotypes as well (Rabinowitz & Laird
2000). LAMP (Linkage and Association Modeling in Pedigrees) works on extended
pedigrees, and has the advantage of being a likelihood-based method (Li et al. 2005).
3.1.2 Multiple Markers and Single Genetic Risk Variant
With increasing numbers of SNPs used in association studies, power decreases quickly due to
multiple-test correction penalties. To alleviate this problem, methods to combine individual
markers have been proposed, such as haplotype-based methods. A haplotype is the
combination of tightly linked alleles on the same chromosome, and it can be viewed as a
“super allele”. Under the Common Disease Common Variant (CDCV) model, a
32
on an ancestral haplotype (Morris & Kaplan 2002; Nielsen et al. 2004). Many traditional
methods have been extended to offer extensions to haplotype-based approaches, such as
APL-haplotype (Chung et al. 2006), FBAT-haplotype (Horvath et al. 2004), LAMP
extension (Biernacka & Cordell 2007), TRIMM (Shi et al. 2007) on family triad data.
TRIMM is also a method to test the association of a disease trait withmultiple, possibly
linked SNP markers and, subsequently, to nominate a set of “risk-haplotype-tagging alleles.”
It uses only the genotypes of affected individuals and their parents without requiring
haplotype assignments or phases. It can only be applied to family trio data. Neale et al. also
proposed to extend a multiple marker analysis into a Gene-Based Analysis (Neale & Sham
2004) which is basically a haplotype-based method only within gene-wide range.
3.1.3 Multiple Markers and Multiple Genetic Risk Variants
Gene mapping of complex human diseases often results in the identification of several
potential risk variants within a gene and/or in the identification of several genes within a
linkage peak. These findings are at odds with the hypothesis that a single risk allele is
responsible for a linkage peak. Along withthe declining costs ofgenotyping, the availability
ofdetailed HapMap dataand a growing numberof validated human SNPs, methods to test for
a disease association with multiple markers simultaneously are also being developed to meet
the need for more powerful analysis approaches.
There are two kinds of family-based methods to test for multiple markers. One class of tests
33
the global test. This test is sensitive to at least one marker being associated with the disease.
FBAT-MM (Rakovski et al. 2007) and FBAT-LC (Xu et al. 2006) are examples of this kind
of method for family data. Both FBAT-MM and FBAT-LC used the statistics for
single-marker tests, and then linearly combine them with different weights. The other class of tests
is regression-based tests (Rakovski et al. 2007) and sum of single-marker statistics tests (Hao
et al. 2004), which can be used to avoid the problem of multiple testing by combining all
SNPs into a single omnibus test.
We are interested in understanding the behavior of several association analysis tests under
single variant and multiple variant models. The goal of our study is to compare methods for
determining whether there is evidence for multiple independent risk variants in a linkage
region.
3.2 Methods
We used the simulation program, SIMLA(Schmidt et al. 2005), to generate family data sets
for use in linkage and association studies. SIMLA can generate haplotypes associated with
two distinct susceptibility variants (possibly with different disease risks) with up to 6 markers
included in each haplotype. The disease model may also include an interaction between the
two variants. In this simulation study, we simulated a common disease with prevalence of
0.20 with two haplotypes independently associated with two recessively acting susceptibility
34
disease variant is 3.0, and the estimated recurrence risk ratio (λs) is 1.13. The two disease loci
are in linkage equilibrium (LE) with each other. Five hundred 3-sib nuclear families with at
least 1 affected offspring and genotyped parents were simulated for all models. The general
maker map is shown in Figure 3.1. Along the map, M1, M2 and D1 are in one haplotype, and
M3 and D2 are in another haplotype, while M4 is not associated with either disease locus or
other markers. All markers are evenly spaced at 0.25 cM to model a common complex
disease of multiple susceptibility loci in a local linkage region. We simulated 1000 replicates
for each model.
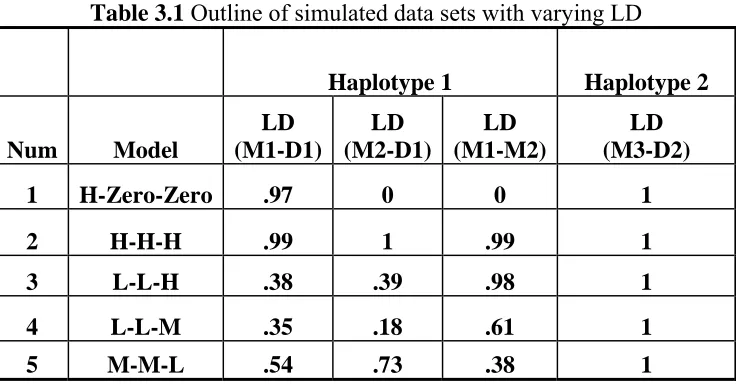
We simulated complex LD patterns within the first haplotype. We sought to include a range
of LD patterns from complete LD (r2=1) to minimal of LD under 5 different models, where
M3 is in complete LD with D2 in all models but the LD between M1 and M2 in each model
is different (Table 3.1). We name the models by referring to the strength of LD in the
following order: between M1 and D1, between D1 and M2 and between M1 and M2,
separated by a dash, High (H): r2 ≥ 0.9, Moderate (M): 0.4 ≤r2< 0.9, Low (L): 0 < r2 < 0.4,
Zero: r2=0. In Model 1, M1 is also in complete LD with D1 but there is no LD between M2
and D1 and M1 and M2 (H-Zero-Zero). In Model2, both M1 and M2 are in complete LD
with D1 and each other (H-H-H). In Model 3, M1 and M2 are in high LD, but the pairwise
LD between M1, M2 and D1 drops down to around .40 (L-L-H). Both Model 4 and Model 5
have only moderate LD values. LD between M1 and M2 is higher than pairwise LD between
M1, M2 and D1 in Model 4 (L-L-M) while LD between M1 and M2 is lower than pairwise
35
Tests for Hardy-Weinberg Equilibrium (HWE) showed no departure from HWE for single
markers. We evaluated single-marker association methods that incorporate evidence for
linkage in a family based association setting, including APL (Martin et al. 2003), LAMP (Li
et al. 2005) and FBAT (Rabinowitz & Laird 2000). They all work well for single marker
analysis, but here we compare their performance under models with multiple susceptibility
variants. LAMP, APL and FBAT are compared in Model H-Zero-Zero, Model H-H-H and
Model L-L-H for 1000 replicates.
Three likelihood ratio tests were proposed to characterize the relationship between the
candidate SNP and the disease locus in LAMP. The first test assesses whether the candidate
SNP and the disease locus are linked (LAMP-Linkage). The second test is the direct
association test, which assesses whether the candidate SNP and the disease locus are in
partial LD so that the SNP or a marker in LD with it accounts partially for the linkage signal
(LAMP-LE test, H0: r2=0). The third test is the indirect association test, which assesses
whether there are other variants which can explain the linkage signal (LAMP-LD test, H0:
r2=1). If the null hypothesis is rejected, then the SNP completely accounts for the linkage
signal(Li et al. 2005).
In order to distinguish among multiple risk variants associated with different disease loci, we
36
test and the APL-OSA conditional association test (Chung et al. 2008). APL-OSA, the
FBAT-LC and APL-Haplotype are compared in Model 1, 3, 4 and 5 for 1000 replicates.
Ordered-subset analysis (OSA) (Hauser et al. 2004b) is a powerful linkage analysis tool that
considers genetic heterogeneity based on a trait-related covariate. The covariate may help to
identify a more genetically homogeneous subset of families, for example, those with an
earlier age at disease onset. The basic idea of the OSA method is to use a family-specific
covariate, such as the average covariate value in affected family members, to identify the
family subset that provides the strongest linkage signal. Families are ordered by their
covariate values and the multipoint (parametric or nonparametric) LOD score for each subset
of families is recalculated every time a family is added into the subset. The maximum LOD
score may occur at different map positions for different subsets of families. If the covariate is
related to the disease, families with high or low ranking covariate values may be genetically
more homogeneous and thus provide stronger evidence for linkage to a particular disease
locus. The significance of the subset and its evidence for linkage is evaluated using a
permutation procedure to estimate empirical p-values. The OSA method has been applied
successfully to many complex disease studies (Hall et al. 1990; Allingham et al. 2005;
Woodroffe et al. 2006; Schmidt et al. 2006; Shah et al. 2006). Association study designs
based on OSA-identified covariate cutoff points have also been proposed (Schmidt et al.
37
APL-OSA applies the linkage OSA method (Hauser et al. 2004b) to the APL test statistic,
which is a measure of allele transmission from parents to offspring. APL-OSA (Chung et al.
2008) uses a trait-related covariate to identify a subset of families that has the most extreme
APL statistic for a given marker. The null hypothesis of APL-OSA is that there is no
correlation between the family-specific contribution to the APL statistic and the family
covariate. A permutation procedure is used to approximate the distribution of the APL-OSA
statistic under the null hypothesis that there is no relationship between the family-specific
covariate and the family-specific evidence for allelic association. APL-OSA is a single-locus
test, but in this study we use APL-OSA as a conditional test where APL statistics of other
markers are used as the trait-related covariate. We use the high-to-low covariate ordering to
test if there is correlation between transmission of the analysis marker and the conditioning
marker. The goal is to evaluate independence of markers in the setting of multiple risk
variants. The idea is similar in spirit to the conditional linkage test used by Cox et al. (Cox et
al. 1999). They described an approach to assess the evidence for statistical interaction
between unlinked regions takes the evidence for linkage at one region into account when
assessing the evidence for linkage across the rest of the genome. Using this method, they
showed that the interaction of genes on chromosomes 2 (NIDDM1) and 15 (near CYP19)
38
3.3 Results
3.3.1 Single-marker methods comparison
The comparison of single-marker association tests for the first 3 models, H-Zero-Zero,
H-H-H and L-L-H-H-H is listed in Table 3.2. The type I error rate for APL, LAMP LE and FBAT tests
was measured by M4 which is a non-associated marker in all models. The type I error rate for
the LAMP-LD test was measured by M3 which is in complete LD with D2 and the null
hypothesis of LAMP-LD is r2=1. In Table 3.2, going from model H-H-H to model L-L-H,
the power of FBAT to detect a disease association with M1 drops from 99.6% to 59.5%, the
power of APL drops from 70.7% to 34.9%, the power of LAMP-LE drops from 100% to
93.8%, and the power of LAMP-LD remains at 10.0 - 10.3% for marker M4. The type I error
rate of FBAT is 5.0%, 4.7% and 4.0% in the three models, the type I error rate of APL is
4.6%, 6.6% and 4.8% respectively, while the type I error rate of LAMP-LE is 16.4%, 20.3%
and 15.8%, the type I error rate of LAMP-LD is 2.6%, 3.1% and 3.4%. Thus, FBAT has
better power compared to APL with genotyped parents, and the LAMP-LE test has the
greatest power. However, the LAMP-LE test has an unacceptably high type I error rate
(≈20%) when there are multiple disease-associated marker alleles, although the type I error
rate of both LAMP association tests is at the nominal level for single marker analysis, as
shown in previously published work (Li et al. 2005). The type I error rate of the LAMP-LD
test in the presence of multiple disease-associated marker alleles does not exceed the nominal
level, but it only has ≈10% power to reject the null hypothesis of r2=1 in all three models. Thus the results of LAMP are difficult to interpret when there are multiple disease-associated
39
The power of APL and FBAT to detect one or more associated marker allele(s) decreases as
the LD between the marker and disease locus decreases, but they both maintain the nominal
type I error rate in all models. Both FBAT and APL maintain good power as single marker
association tests in the presence of multiple disease variants as long as the LD remains
relatively strong (r2 > 0.5). Both APL and FBAT are robust single marker association
methods to use in the presence of multiple disease variants. However, the single marker tests
report only on one marker at a time and provide little information on whether there is one or
more than one susceptibility allele in a linkage region.
3.3.2 Multiple-marker methods comparison
After single marker association tests have detected which SNPs are associated, we are
interested in testing whether these SNP markers are independent. Since the LAMP-LD test is
unable to provide this information, we considered a conditional test of association
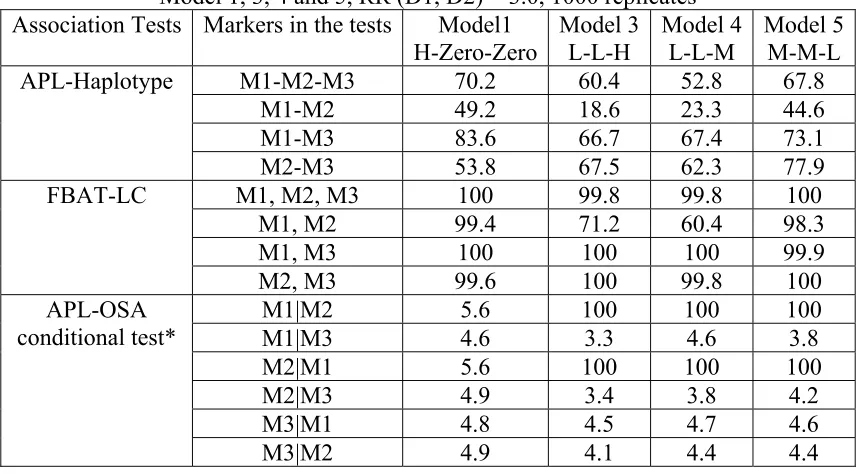
(APL-OSA) and a joint test (APL-Haplotype and FBAT-LC). Multiple-marker association methods
are compared and results for Model H-Zero-Zero, L-L-H, L-L-M and M-M-L are listed in
Table 3.3.
The power of the FBAT-LC test for the 2 marker haplotype M1-M2 is 99.4% and 71.2% in
Model H-Zero-Zero and L-L-H, and is always higher than the highest result for either marker
using FBAT single marker tests in both models, 99.3% and 61.6 respectively. The power of
40
and 40% in Models H-Zero-Zero, L-L-H, L-L-M and M-M-L, while the power of FBAT-LC
on (M1, M2) is 99.4%, 71.2%, 58% and 99% respectively. FBAT-LC also maintains higher
power than the APL-Haplotype test on (M1, M2) in Table 3.3. The higher power for
FBAT-LC is not surprising given the difference in the alternative hypothesis. The alternative
hypothesis for FBAT-LC is that any marker in the set of markers tested is associated and
APL-Haplotype is performing a specific joint test. Thus the FBAT-LC is a global test which
is sensitive to the presence of at least one disease-associated marker but does not identify the
specific one.
In Model L-L-H, the power of the APL single marker test is 34.9% and 34.2% for M1 and
M2 respectively (Table 3.2), and the power of the APL-Haplotype test is 62%, 19%, 70%
and 72% for M1-M2-M3, M1-M2, M1-M3 and M2-M3 respectively (Table 3.3). Thus,
APL-Haplotype with 3 markers has increased power compared to the APL single marker test.
However, the haplotype test can be quite misleading. M2 and M3 are associated with two
distinct susceptibility variants, but in Model H-Zero-Zero, L-L-H, L-L-M and M-M-L, the
power for the true M1-M2 haplotype is lower than for the M1-M3 and M2-M3 haplotypes.
This demonstrates that a haplotype analysis detects joint effects of disease variants but is
unable to distinguish between a single susceptibility variant model and multiple independent
susceptibility variants model, and also unable to distinguish between different haplotypes.
The results of the APL-OSA conditional test are shown in Table 3.3. While the power drops
41
on M3 in model L-L-M, the power of APL-OSA is 100% when analyzing M1 conditioning
on M2 or analyzing M2 conditioning on M1 in Models L-L-H, L-L-M and M-M-L. We
would like to see that markers is LD with the same risk variant would result in similar
allele-sharing patterns and that the results would be similar using both markers as the conditioning
marker. Thus we expect increased power for M1|M2 and M2|M1 for model L-L-H, L-L-M
and M-M-L. We observed the expected pattern for all models even for Model L-L-M with
modest LD between M2 and D1 (r2=.18). The type I error rate ranged from 0.033 to 0.06.
Thus, the APL-OSA conditional test has excellent power to detect the correct association,
suggesting that the APL-OSA conditional test is a promising tool for distinguishing markers
associated with different disease loci.
To further investigate the utility of the APL-OSA conditional test, we calculated the allele
frequency in all pedigrees and specific family subsets identified by APL-OSA in Model
L-L-H. The allele frequency for D1 and D2 is 0.19 and 0.17 respectively in 500 families for one
replicate in the L-L-M model. As expected, the estimated allele frequency of each disease
variant in the subset of families identified by APL-OSA is increased when conditioning on
the APL statistic of markers associated with that disease variant (Table 3.4). That is, the D1
risk allele frequency increased from 0.19 to 0.31 when conditioning on M1 or M2 but
remained the same as the overall frequency when conditioning on M3. The D2 risk allele
frequency increased from 0.17 to 0.41 when conditioning on M3 but remained the same as