18th International Conference on Structural Mechanics in Reactor Technology (SMiRT 18) Beijing, China, August 7-12, 2005 SMiRT18-J04-7
NON-LINEAR IMPACT ANALYSIS OF A CONCRETE BUILDING
Danièle Chauvel
EDF/SEPTEN, 12-14, Avenue Dutriévoz,
F-69628 Villeurbanne Cedex
Phone: +33-4-72827194,
Fax: +33-4-72827702
E-mail: [email protected]
Jean-Pierre Touret
EDF/SEPTEN, 12-14, Avenue Dutriévoz,
F-69628 Villeurbanne Cedex
Phone: +33-4-72827554,
Fax: +33-4-72827702
E-mail:
[email protected]
Friedhelm Stangenberg
Stangenberg und Partner, Viktoriastr. 47,
D-44787 Bochum
Phone: +49-234-9613016,
Fax: +49-234-9613019
E-mail: [email protected]
Michael Borgerhoff
Stangenberg und Partner, Viktoriastr. 47,
D-44787 Bochum
Phone: +49-234-9613030,
Fax: +49-234-9613019
E-mail: [email protected]
Rainer Zinn
Stangenberg und Partner, Viktoriastr. 47, D-44787 Bochum
Phone: +49-234-9613025,
Fax: +49-234-9613019
E-mail: [email protected]
ABSTRACT
In the nuclear activity domain, design requirements have evolved from the safety point of view. For example, the protection against external hazards has been increased by taking into account high levels of earthquake and also high energy airplane crash. Methodologies have to be developed to evaluate the ability of protective concrete shells to cope with these evolutions of design requirements.
Copyright © 2005 by SMiRT18
Keywords: Aircraft impact, non-linear analysis, CEB model, experimental validation
1. INTRODUCTION
The aim of the performed study was to check the mechanical behaviour of reinforced concrete structures under severe impact. The applied analysis methods had to be suited to take into account the expected non-linear structural behaviour.
The effects of different parameters have been examined: the shape and magnitude of the loading curve, the size and the shape of the impact area, the dynamic mechanical properties of the materials. The utilised programs for the non-linear dynamic FE analysis are ADINA and SOFiSTiK (total and partial models). Both programs are suited for the calculation of static and dynamic effects of general loading on any type of structure, which has to be divided into an assembly of individual elements interconnected at nodes (FE method). Both programs include non-linear assumptions for the materials concrete and reinforcing steel. Whereas SOFiSTiK is based on a layered concrete model regarding the reinforcement at both sides in the used shell elements, in ADINA the concrete is modelled by volume elements, and the reinforcing steel is modelled by truss elements. The material model of concrete includes cracking and crushing effects as well as tension stiffening. The influence of high strain-rates within the structure, which causes property changes in all used materials, is regarded according to published experimental results.
Moreover, an improved variant of the analysis method based on the CEB code model for impact analysis has been used, which consists of a spring-mass model with simplified non-linear behaviour laws for the concerned structural elements and adjusted to the concerned structures. With the aim of adjusting the parameters of the simplified model, the results from the different FE analyses are compared with the simplified approach.
In order to validate the computational approach, post-computations of experimental extreme impacts on reinforced concrete targets are presented. The computations refer to the so-called “Meppen slab tests” in Germany, where large-scale impact tests have been performed in order to investigate the ultimate load-bearing behaviour of reinforced concrete structures under high-speed impact loads.
2. COMPUTATIONAL APPROACH
2.1 SOFiSTiK
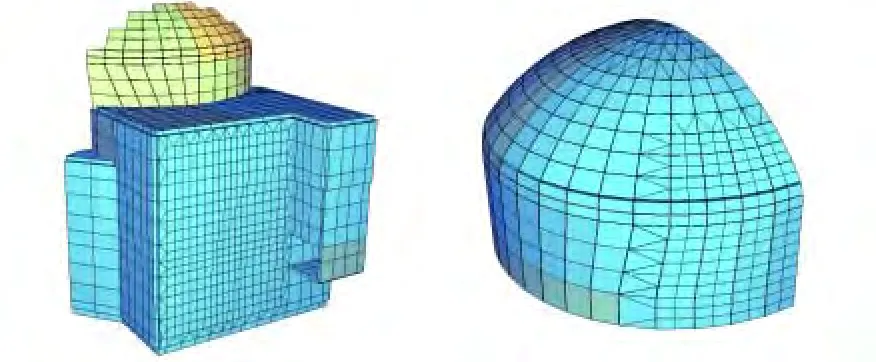
The computer program SOFiSTiK (2004) is suited for the calculation of static and dynamic effects of general loading on any type of structure, which has to be divided into an assembly of individual elements interconnected at nodes (Finite Element Method). In the current investigation, this program is used for dynamic analyses of models, which consist of shell elements. The numerical methods of the utilized computer program include the consideration of the effects caused by non-linear material behaviour of the shell structures and the investigation of
2nd and 3rd order theory effects due to geometrically non-linear behaviour. Fig. 2.1 shows examples of SOFiSTiK
FE models used in this study.
Fig. 2.1 SOFiSTiK FE models of a total structure (left) and a partial structure (right)
The SOFiSTiK shell element is implemented as triangular as well as quadrilateral element. Since the element remains plane, the bending and membrane actions of the individual element are decoupled. For the plate action, the shell element is based on Mindlin’s plate theory with an extension by a non-conforming formulation. The element formulation of the membrane stress state is carried out by a classical isoparametric formulation or by a similarly classical non-conforming formulation by Wilson and Taylor.
The analysis of non-linear effects in SOFiSTiK is done by iterations using a modified Newton method with constant stiffness matrix. The non-linear material behaviour of reinforced concrete in the shell elements is regarded by use of a layer model with arrangement of the crosswise reinforcement layers in their correct positions near the surfaces. The non-linear behaviour of the components of reinforced concrete is defined by
• non-linear uniaxial stress-strain laws of concrete (increase of strength due to biaxial compressive
behaviour regarded),
• consideration of tension softening of concrete after cracking dependent on fracture energy,
• trilinear stress-strain laws of reinforcing steel.
For geometrically non-linear analysis the initial stress matrix is added to the stresses of the primary stress state. In this way, a stability failure is recognized even in cases without unplanned initial deformation.
2.2 ADINA
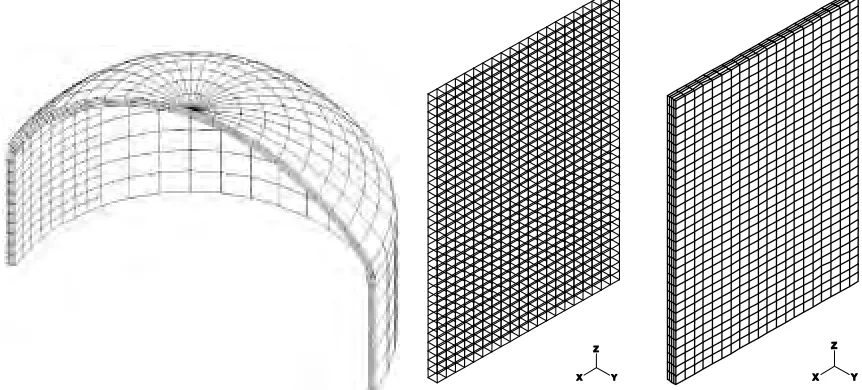
The computer code ADINA (Automatic Dynamic Incremental Nonlinear Analysis), (1996) and (Bathe, 1989), comprises solution capabilities for two- and three-dimensional non-linear finite element analysis of concrete structures. In the ADINA computations performed in this study, the concrete is modelled by volume elements, and the reinforcing steel (bending reinforcement bars and stirrups) is modelled by truss elements. The implemented concrete material law includes the consideration of triaxial non-linear stress-strain behaviour, tensile cracking, tensile stiffening, compression crushing and strain softening. To model the failure of the concrete material in tension and compression and to account for multiaxial conditions in the uniaxial stress-strain behaviour, failure envelopes are employed. As failure criterion, the ultimate strength surface according to Ottosen (1977) proposed in the CEB-Bulletin No. 156 (1983) is used. The stress-strain law for the truss elements representing the reinforcing steel, used in the computations, is elastic-plastic with kinematic hardening conditions. Fig. 2.2 shows examples of ADINA FE models used in this study.
Fig. 2.2 ADINA FE models of a containment structure and a flat wall (left: reinforcing
bars, right: concrete volume elements)
2.3 Improved CEB Model
Copyright © 2005 by SMiRT18
Spring R1B global deformation (bending)
Spring R1 describes the bending behaviour of a plastified circular plane slab (parameters r and a are circular plate radius and radius of load area, respectively, γ = a/r). The elastic bending moment Mdy and the cracked rigidity
kII = E·JII are evaluated taking into account the eventual normal force associated with the bending moment. The
ultimate plastic bending moment Mdk is evaluated following the design criteria concerning the allowable strains in the concrete and in the reinforcement. The elastic resistance Rdy of the slab, calculated for the clamped case on the periphery and loaded by a unit force on a circular area with radius a, and the maximum elastic displacement udy are introduced acc. to formulas (1). The plastic resistance Rdk of the slab is determined by application of yield line theory with the ultimate bending moments Mdk+ (field) and Mdk- (support), the maximum plastic displacement udk is evaluated acc. to the allowed rotation θlim of the plastic hinge, cf. formulas (2). We use θlim = 0.0065 d/x ≤ 0.07, where x = neutral axis depth.
γ)
(γ
)
(
M
R
dy dyln
4
²
1
16
−
⋅
+
⋅
=
ν
π
,[
]
γ
)
(
γ
)
(
γ
γ
²
γ
²
D
M
a
=
u
dy dyln
4
²
1
ln
4
3
4
4
+
⋅
−
+
−
⋅
⋅
ν
(Eq. 1)Spring R2B local deformation (punching)
+
+
⋅
=
+ −r
a
M
M
R
dk dkdk
3
2
1
)
(
2
π
,
u
dk=r
⋅
θ
lim (Eq. 2)Spring R2 represents the punching shear behaviour characterized by the resistance due to the stirrups. The
contribution of the tensile strength of the concrete along the expected cone boundaries is neglected. The values for
punching resistance RS and elastic deformation us assuming that the tensile stress is uniformly applied on a
distance equal to h/3 are inserted acc. to formulas (3), where ASτ = amount of stirrups per unit area and α = angle of
the punching cone assumed to α = 31°. For the computations documented hereafter the maximum plastic
displacement of stirrups is not relevant because the amount of stirrup reinforcement is chosen in a way that RS is not reached.
Masses M1 and M2
A
f
]
a
-)
d
+
[(a
=
R
yk s2 2
S
π
τα
tan
,u
s=
0.33
⋅
d
⋅
f
yk/
E
S (Eq. 3)M2 represents the mass of the assumed punching cone, M1 the remaining participating mass of the slab.
Whereas M2 can directly be determined from geometric parameters, M1 is evaluated under the assumption that the
original slab with stiffness kII and the one-mass-system given by
have the same lowest natural frequency. Then the co-vibrating masses follow with
M
+
M
=
M
eff 1 2,k
=
R
/
w
(Eq. 4)y d y d
w
/
R
k
.
h
r
=
M
dyy d II 4 eff
⋅
4
104
ρ
,
+
+
2 2tan
3
1
tan
α
α
ρπ
h
a
ah
h
=
M
2 (Eq. 5)Displacement
Fo
rce
Us Udy Udk
Rdy RS
Rdk
R1 R2
M2
R2
M1
R1
Fig. 2.3 CEB model
2.4 Experimental Validation
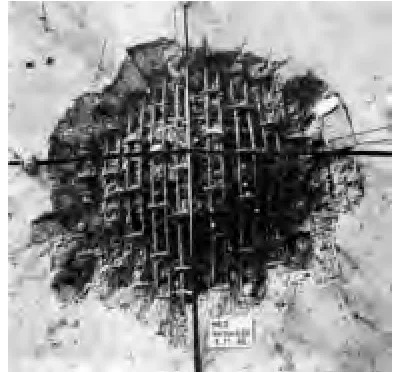
In order to validate the computational approach, post-computations of extreme impacts on reinforced concrete targets (so-called “Meppen slab tests” in Germany) are presented, where large-scale impact tests of reinforced concrete structures under high-speed impact loads have been performed. The mass of the (deformable) impacting body was about 1000 kg, the impact velocities were in the range 200 up to 250 m/s. The projectile was a steel projectile with length 6 m, diameter 60 cm and wall thickness 7 resp. 10 mm. The target was a reinforced concrete slab of total dimension 6.5 x 6.0 m. Fig. 2.4 shows a photo of a slab after a test, in the foreground the deformed projectile (residual length of projectile after test 1 - 2 m), and a photo of the rear slab side after a test. The Finite element model for the computations with the program SOFiSTiK is shown in Fig. 2.5 together with the substitute load area of the plate with thickness 0.9 m and the fixed supports for out-of-plane motions. The number of plate elements of the FE model is 1296. The ADINA model (no Figure) consists of 2,645 nodes, 1,936 volume concrete elements and 2,553 truss steel elements.
The resulting displacement-time histories of the SOFiSTiK and ADINA computations are compared in the right-hand side of Figure 2.5 (test II/21). The computed values are in good agreement with the measured displacements (no Figure).
0 0.02 0.04 0.06 0.08 0.1
Time [s]
0 20 40 60
D
ispl
a
ceme
nt [
mm]
SOFiSTiK
ADINA
Fig. 2.5
FE model with supports and load area (left), displacement-time
histories of test II/21 (right)
3. LOAD FUNCTIONS
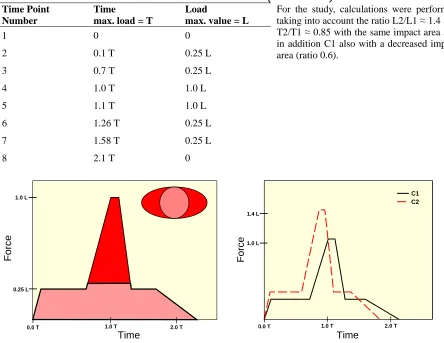
The total impact load comprises several components with different time characteristics for different parts of missile. Two different load functions C1 and C2 have been developed acc. to Riera (1968), both resulting in the total load-time functions given in Table 1 (values T and L have to be replaced by T1, L1 and T2, L2, respectively) and illustrated in Fig. 3.1. The impact area is shown in principle in the upper right corner of the left-handed side of Fig. 3.1 together with two different coloured parts related to different loadings.
Table 1 Load-time function (normalized)
Time Point Number
Time
max. load = T
Load
max. value = L
1 0 0
2 0.1 T 0.25 L
3 0.7 T 0.25 L
4 1.0 T 1.0 L
5 1.1 T 1.0 L
For the study, calculations were performed taking into account the ratio L2/L1 ≈ 1.4 and
T2/T1 ≈ 0.85 with the same impact area and
in addition C1 also with a decreased impact area (ratio 0.6).
6 1.26 T 0.25 L
7 1.58 T 0.25 L
8 2.1 T 0
Time
Force
C1 C2
1.0 L 1.4 L
0.0 T 1.0 T 2.0 T
Time
Fo
rce
0.25 L 1.0 L
0.0 T 1.0 T 2.0 T
Fig. 3.1 Load-time functions C1 and C2 and related load areas (left)
Copyright © 2005 by SMiRT18
4. COMPUTATIONS AND RESULTS
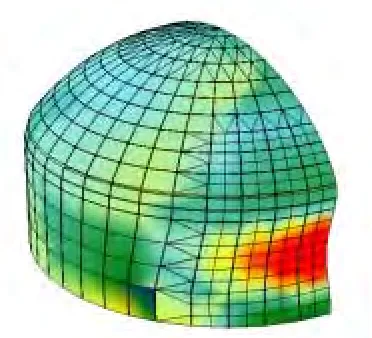
From the various computations some examples are illustrated by graphical representation of selected results in the following. Due to the confidentiality of the computations only relative numbers can be presented. Fig. 4.1 shows deformed structures of the partial models computed by SOFiSTiK (cf. Fig. 2.1) and ADINA (cf. Fig. 2.2) under an impact of type C1 (cf. chapter 3) at time t ≈ 1.0 T1. The amplitudes (not in-scale in Fig. 4.1) of the deformations derived from both programs are in good agreement.
Fig. 4.2 shows resulting displacements due to an impact of type C1 on a flat wall. On the left-hand side of Fig. 4.2 the time-histories of displacements from four different computations are compared showing an excellent agreement between each other: ADINA (model cf. Fig. 2.2), SOFiSTiK 2D partial model (similar to ADINA model), SOFiSTiK 3D model of total structure (cf. Fig. 2.1) and simplified model acc. to section 2.3. On the right-hand side of Fig. 4.2 the deformed shape of the SOFiSTiK 3D model at the time of maximum displacement is shown (deformations not in scale). This example demonstrates the accurateness of the simplified procedure for this case.
Fig. 4.1 Deformations of partial models SOFiSTiK (left) and ADINA (right) due to load
C1 at t
≈
T1
Time
Di
spla
ce
me
nt
2.0 T
1.0 T 3.0 T
Udk
0
ADINA SOFiSTiK-2D SOFiSTiK-3D CEB model
Copyright © 2005 by SMiRT18
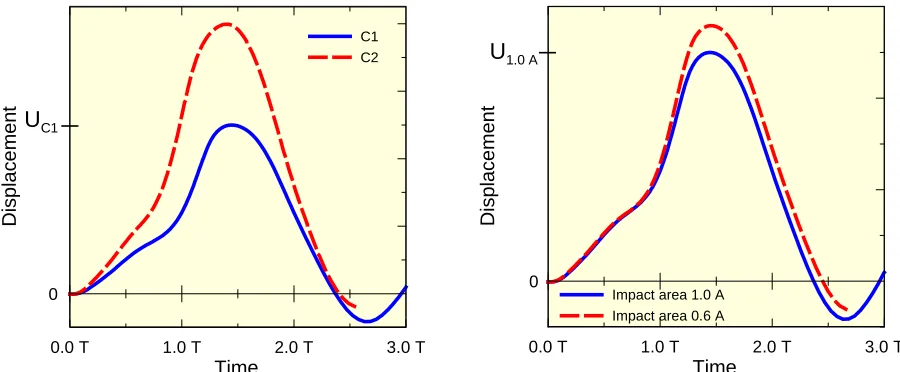
Two further comparisons of results for the flat wall of Fig. 2.1 with deviating conditions in regard to concrete strength and amount of bending reinforcement are made in Fig. 4.3. On the left-hand side of Fig. 4.3, the time-histories of maximum displacements due to load functions C1 and C2 according to Fig. 3.1 are presented. The load function C2 with nearly 40 % larger maximum load causes a disproportionate increase of maximum displacement by approximately 60 %.
On the right-hand side of Fig. 4.3, the time-histories of maximum displacements due to an impact of type C1 acting on an impact area decreased to 60 % of the original size as shown in Fig. 3.1 are plotted in comparison with the results for the complete area. The reduction of impact area by 40 % results in an increase of maximum displacement by round about 10 %.
0.0 T 1.0 T 2.0 T 3.0 T
Time
Disp
la
ce
ment
C1 C2
U
C10.0 T 1.0 T 2.0 T 3.0 T
Time
D
isplacement
Impact area 1.0 A Impact area 0.6 A
U
1.0 A0 0
Fig. 4.3 Displacements due to an impact on a flat wall, time-histories from computations
for different load functions (left) and different impact areas (right)
Moreover, a parametric study concerning the influences of concrete quality and amount of bending reinforcement on the mechanical behaviour due to an impact of type C2 has been performed for the flat wall already referred to as an example. Expectedly, the results of the analyses were stronger influenced by an increase of reinforcement than by use of a higher concrete quality.
The increase of concrete strength by 33 % causes a decrease of maximum displacement by 9 %. If the concrete strength is increased by 78 %, the maximum displacements are reduced by 16 %. On the other hand, the increase of bending reinforcement leads to a nearly equal reduction of deformations. In the analysed case, 14 % more bending reinforcement resulted in 12 % lower maximum displacements.
Thus, it can be concluded that there is a potentiality of limiting the deformations of the protective shield by appropriate choice of concrete strength and amount of reinforcement, if it should be necessary in order to avoid a contact with the internal structures.
5. CONCLUSIONS
The analysis methods for the examination of reinforced concrete structures under severe impacts must be able to regard the non-linear behaviour of the materials concrete and reinforcing steel as well as the non-linear structural behaviour of the compound system reinforced concrete. The influence of impact induced high strain-rates within the structure, which causes property changes in all used materials, has to be regarded according to experimental results.
The used FE computer programs ADINA and SOFiSTiK fulfil these requirements. While in ADINA the concrete structure is modelled by volume elements and the reinforcement by truss elements, in SOFiSTiK the reinforced concrete walls or slabs are represented by shell elements, which imply a layer model with arrangement of the crosswise reinforcement layers in their correct positions near the surfaces. With the aim of validation of this computational approach, post-computations of impact experiments on reinforced concrete targets have been performed by use of ADINA and SOFiSTiK FE models. These computations show a good agreement between measured and computed results, and it can be concluded that both programs ADINA and SOFiSTiK are well-suited for impact analyses of reinforced concrete structures in the non-linear range.
As analysis method with much less computational effort, the impact model defined in CEB-Bulletin No. 187 (1988) has been chosen for comparative calculations. The original CEB model has been improved with the aim of adjusting its parameters to the conditions of the more sophisticated FE models. Rather good agreements have been achieved by choosing clamped boundary conditions instead of simple support.
The performed dynamic analyses of severe impacts on the investigated concrete building have shown that the results for flat walls gained by use of all presented analysis methods do not deviate from each other in a significant measure. So it can be concluded, that the analysis effort at least for partial structures with extensively clear mechanical systems can be restricted. Nevertheless, more realistic information about the mechanical behaviour of severely impacted structures of all kind only can be received from non-linear dynamic FE analyses by use of total and partial models.
A parametric study concerning the influences of concrete quality and amount of bending reinforcement on the mechanical behaviour has shown that there is a potentiality of limiting the deformations of the protective shield by appropriate choice of these parameters, if it should be necessary in order to avoid a contact with the internal structures.
REFERENCES
SOFiSTiK AG, (2004), SOFiSTiK Analysis Programs Version 21.0, Manual.
ADINA R&P, Inc. (1996): ADINA – A Finite Element Program for Automatic Dynamic Incremental Nonlinear Analysis, Report 96-4 (ADINA 7.1).
Bathe, K.-J., (1989), Computers & Structures Vol. 32, No. 3 / 4, pp. 563-590.
Ottosen, N. S., (1977), Journ. Eng. Mec. Div. ASCE, Vol. 103, EM4.
CEB, Comité Euro-International du Beton, (1983), Bulletin d’Information No. 156.
CEB, Comité Euro-International du Beton, (1988), Bulletin d’Information No. 187.