DOI: 10.1534/genetics.105.055095
A General Model to Explore Complex Dominance Patterns in Plant
Sporophytic Self-Incompatibility Systems
Sylvain Billiard,*
,†,1Vincent Castric
†and Xavier Vekemans
†*Ecologie, Syste´matique et Evolution, UMR 8079, Universite´ Paris-Sud, 91405 Orsay Cedex, France and†Ge´ne´tique et Evolution des Populations Ve´ge´tales, UMR CNRS 8016, Universite´ des Sciences et Technologies de Lille 1,
F-59655 Villeneuve d’Ascq Cedex, France Manuscript received December 23, 2005 Accepted for publication December 21, 2006
ABSTRACT
We developed a general model of sporophytic self-incompatibility under negative frequency-dependent selection allowing complex patterns of dominance among alleles. We used this model deterministically to investigate the effects on equilibrium allelic frequencies of the number of dominance classes, the number of alleles per dominance class, the asymmetry in dominance expression between pollen and pistil, and whether selection acts on male fitness only or both on male and on female fitnesses. We show that the so-called ‘‘recessive effect’’ occurs under a wide variety of situations. We found emerging properties of finite population models with several alleles per dominance class such as that higher numbers of alleles are maintained in more dominant classes and that the number of dominance classes can evolve. We also investigated the occurrence of homozygous genotypes and found that substantial proportions of those can occur for the most recessive alleles. We used the model for two species with complex dominance patterns to test whether allelic frequencies in natural populations are in agreement with the distribution predicted by our model. We suggest that the model can be used to test explicitly for additional, allele-specific, selective forces.
T
HE population genetics of plant species withspo-rophytic self-incompatibility (SSI) are notoriously difficult to study both empirically and theoretically be-cause of the complex dominance relationships
occur-ring among alleles. Wright(1939) developed a theory
for gametophytic self-incompatibility (GSI), a genetic system to avoid self-fertilization involving recognition between a protein expressed in the haploid pollen and two codominantly expressed pistil proteins, and iden-tified negative frequency-dependent selection as the major evolutionary force promoting allelic diversity. According to Wright’s theory, selection under GSI is symmetric among alleles, and the only relevant feature of an allele is its current population frequency. In SSI, however, the incompatibility phenotypes of pollen and pistils are determined by the diploid genotypes of the paternal and maternal plants, respectively, and are governed by complex dominance interactions among alleles that introduce asymmetrical selection among
alleles (Bateman1952; Schierupet al.1997). A general
understanding of the population genetics of SSI has also been difficult because different authors investigated different, often nonoverlapping model representations of SSI, sometimes with unstated assumptions, so that
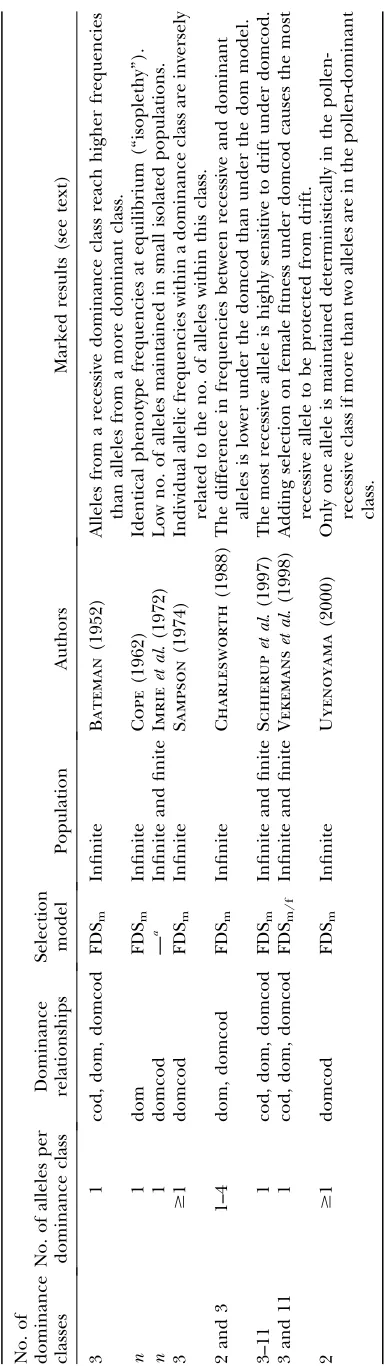
their outcomes have been difficult to compare (Table 1). Differences among models comprise: (1) frequency-dependent selection acting on male fitness only
(cor-responding to Wright’s assumption)vs.selection on both
male and female fitnesses, named ‘‘fecundity selection’’ in Vekemanset al.(1998); (2) expression of dominance
in both pollen and pistilsvs.codominance in pistil and
dominance in pollen; and (3) occurrence of at most one allele per dominance class along a hierarchical
lad-der of dominancevs.allowing several alleles per
domi-nance class.
Previous analyses of deterministic models of SSI have shown the following:
1. Recessive alleles should reach higher equilibrium frequencies than more dominant alleles, the so-called
‘‘recessive effect’’ (Bateman 1952; Sampson1974).
The reason is that negative frequency-dependent se-lection tends to homogenize the frequencies of the phenotypic classes (the ‘‘isoplethy’’ hypothesis). Be-cause of dominance, recessive alleles can be present in more phenotypic classes than are dominant al-leles, and they thus reach higher total frequencies
(Cope1962).
2. Within a given class of dominance, individual allelic frequencies should be inversely related to the num-ber of alleles in that class, the so-called ‘‘small
number effect’’ (Sampson1974). This arises because
within a given dominance class, alleles are selectively
1Corresponding author:Laboratoire GEPV, UMR 8016, Baˆt. Sn2, Uni-versite´ Lille 1, F-59655 Villeneuve d’Ascq Cedex, France.
E-mail: [email protected]
equivalent and are thus expected to reach identical frequencies at equilibrium (as in completely sym-metric models of balancing selection such as GSI). In contrast to expectation 1 above, recessive alleles, if present in higher number, could thus potentially reach lower overall equilibrium frequency than dominant alleles.
3. The recessive effect is substantially less pronounced in models where dominance is acting in pollen (with a single allele per dominance class) and all alleles are codominant in the pistil (domcod model) as compared to models with identical expression of dominance
in pollen and pistil (dom model) (Charlesworth
1988; Schierupet al.1997). In the latter, the strength
of the recessive effect was found to increase with an increasing number of dominance classes whereas the
reverse was true for the domcod model (Schierup
et al.1997).
4. The properties of the domcod model denoted in expectation 3 are no longer valid when selection
acts on both the male and the female fitnesses (i.e.,
when the availability of compatible pollen is limited). Under such a selection scenario, the properties of the domcod and dom models are qualitatively very
similar (Vekemanset al.1998).
5. A peculiar behavior was observed for alleles in the recessive class in a domcod model with two classes of dominance and no selection on female fitness. In many instances where two alleles were introduced in the recessive class, only a single allele could be
maintained deterministically (Uyenoyama 2000).
Also, with a single recessive allele, the total frequency of dominant alleles was increasing with the number
of alleles, varying from 0.5 to 0.8 when increasing
from 2 to 50 dominant alleles in the population.
Detailed theoretical investigations of SSI in finite populations have been rather scarce and did not model cases with more than one allele per dominance class. Imrieet al.(1972) showed that only a very low number of alleles at the S locus (S alleles) would be maintained in a small population under domcod SSI, but that recur-rent migration would lead to a substantial increase in
the number of alleles maintained. Schierupet al.(1997)
compared different models of SSI with or without domi-nance, with dominance represented as a linear hierar-chy with a single allele per dominance level. The total number of alleles maintained in finite populations was found to decrease with increasing expression of domi-nance and was interpreted as the result of decreasing overall strength of selection in the presence of reces-sive alleles that are not expressed in heterozygous
geno-types (Schierupet al.1997). The domcod model showed
idiosyncratic evolutionary dynamics of alleles, with most dominant alleles having a higher rate of successful in-vasion whereas most recessive alleles had a higher rate of loss, leading to continuous evolution toward an
increasing absolute level of dominance within
popula-tions (Schierup et al. 1997). The introduction of
se-lection on female fitnesses was found to override this
running-over process (Vekemanset al.1998).
Although data on patterns of dominance and distri-bution of allelic frequencies in natural populations are accumulating slowly, application of the theoretical results to actual data has remained difficult because extant patterns of dominance relationships among al-leles at SSI loci are typically more complex than the over-simplified dominance relationships assumed in the
models (e.g., Stevens and Kay 1989; Kowyama et al.
1994; Mehlenbacher1997). However, testing
predic-tions from models on the distribution of allelic fre-quencies within and among populations is necessary to assess the occurrence of frequency-dependent selection,
to test whether selection is acting on male vs. female
fitnesses, and to detect the occurrence of additional selective forces, potentially differing among alleles. Ad-ditional components of selection could arise, for in-stance, as a consequence of the association of S-allele lineages to different sets of deleterious alleles at linked
loci (the ‘‘sheltered load’’; Uyenoyama1997) or of the
occurrence of partial overlap among pairs of allelic specificities leading to selection to avoid false rejection
of nonself pollen (Richman 2000; Chookajornet al.
2004). Although the sheltered load hypothesis was ini-tially suggested for GSI systems, it is potenini-tially of major interest in SSI, with the difference that its strength is expected to vary among dominance classes as recessive
alleles may occur as homozygotes (Bechsgaard et al.
2004).
Here, we present a flexible model of SSI that allows deterministic computations for any number of domi-nance classes with any number of alleles per domidomi-nance class and full definition of dominance relationships in pollen and pistil between each pair of alleles. Our model also allows specifying whether selection acts on male fitness only or both on male and on female fit-nesses. The model allows the computation of expected equilibrium frequencies as well as single-generation genotypic changes in cases with complex patterns of dominance previously determined from nature. We use the model to explore situations with more than two dominance classes and different numbers of alleles per class, both in deterministic models and in finite pop-ulations. In both types of models we estimate the relative frequencies of alleles from the most recessive and the most dominant classes. We also estimate frequencies of homozygote genotypes as they are of special interest in the context of the sheltered load hypothesis. In finite populations we monitor the number of alleles per dominance class and the number of dominance classes maintained. We discuss how our results extend the current knowledge about SSI and permit explicit de-tection of non-frequency-dependent selection compo-nents in species with SSI.
MODEL AND METHODS
We consider a sporophytic self-incompatibility system
determined by n specificities in a diploid
hermaphro-dite species. The phenotype of an individual bearing
specificitiesiandjdepends on the patterns of
expres-sion (relative dominance) of their associated alleles at the pollen and pistil self-incompatibility genes. We suppose that a given allele encodes for a single specific-ity and a given specificspecific-ity is encoded by a single allele. An
i-specific pollen protein is produced when allele Si is
expressed in the anthers, whereas ani-specific protein
is produced at the pistil surface when the Si allele is
expressed in the pistil. The pollen and pistil phenotypes
of an individual SiSj can then be interpreted as the
relative proportions of proteins i and j produced in
anthers and pistils, respectively. Note that a given plant may express different specificities in pistils and anthers if the dominance relationships between co-occurring alleles are not the same in the reproductive structures. Moreover, an individual may express two different spec-ificities if the alleles it carries are partially codominant in a reproductive structure, possibly at different in-tensities in the case of partial dominance. A cross is considered incompatible when pollen and pistil pro-teins bearing the same specificity come into contact provided there is enough of them in both reproductive structures for recognition to occur.
In the following, we computed the expected geno-typic frequencies under any scheme of dominance
rela-tionships among nalleles and two contrasting models
of frequency-dependent selection:
1. Frequency-dependent selection occurring through
male and female reproductive structures (FDSm/f), also
called fecundity selection by Vekemanset al.(1998).
2. Frequency-dependent selection occurring only
through male reproductive structures (FDSm) first
proposed by Wright(1939). The main hypothesis
of this model is that all maternal plants produce the same number of offspring without regard for the quantity of compatible pollen they receive.
Dominance relationships: We define a and f, two
square matrices of dimension n 3n, respectively
con-taining the dominance relationships for all pairs of
alleles in anthers and pistils, wherenis the number of
different specificities actually present in the population.
The elements on row iand columnjin these matrices
areaij¼1ajiandfij¼1fji, respectively the
dom-inance level of alleleSiover alleleSjin pollen and pistil,
with 0# aij#1 and 0# fij#1 for all {i,j}. For instance,
ifaij¼1,Siis fully dominant overSjin anthers and if
aij¼aji¼12,SiandSjare codominant. More generally,
ifaij.1
2,Siis partially dominant overSjin anthers.
From genotypes to phenotypes:We denoteAijandPij,
respectively, the anther and pistil phenotypes of an
vectors of dimensionnas follows:Aij[½x1;. . .;xu;. . .;
xnwithxu¼0 foru;fi;jg,xi¼aijandxj¼aji¼1aij
ifi6¼j, andxi¼1 ifi¼j. We can define in the same
way the phenotype of the pistil:Pij[½x1;. . .;xu; . . .;xn
withxu¼0 foru;fi;jg,xi¼fijandxj¼fji¼1fij
ifi 6¼j, andxi ¼ 1 if i ¼j. Typically, Aij and Pij have
the form ½0 0. . .0aij . . .0aji0, which can be
inter-preted as the proportion ofu-specific protein produced
in anthers and pistil of an individual SiSj, for all u2
f1;2;. . .;ng.
Cross compatibilities: This definition of the
pheno-type is convenient because a cross between a pollen from
anSiSjplant and the pistil of anSkSlplant is compatible
if AijPklT# s, with 0 # s #1 a specified threshold value, and the superscript T indicates the transpose of
vector Pkl. We denote pijkl the variable that takes the
value 1 if the cross between a pollen from anSiSjplant
and the pistil of aSkSlplant is compatible and 0 if it is
not; in other words,pijkl¼1 ifAijPklT# sor elsepijkl¼0. A cross is compatible in four cases:
i. Ifi6¼k,i6¼l,j6¼k, andj6¼l, thenAijPklT¼0 and the cross is compatible.
ii. Ifi¼k,i6¼l,j6¼i, andj6¼l,AijPilT¼aijfiland the
cross is compatible ifaijfil# s. If we specifys¼0
then the cross is possible only if Siis fully recessive
relatively toSjorSlor both.
iii. Symmetrically, ifj¼l,i6¼k,j6¼i, andj6¼k,AijPkjT¼
ajifjk¼ ð1aijÞð1fkjÞ, and the cross is compatible
ifajifjk# s.
iv. Ifi¼k,j¼l, andi 6¼ j,AijPijT¼aijfij1ajifji¼ aijfij1ð1aijÞð1fijÞ.
While the cross implies two plants with the same
genotypeSiSj, the cross may be compatible if
domi-nance is expressed differently in anthers and pistil;
for example, ifSiis fully dominant overSjin anthers
and fully recessive in pistil, then we haveaij¼1 and
fij ¼ 0, and therefore AijPklT¼0 and the cross is
compatible.
Genotypic frequency change: We denotefijthe
fre-quency of genotypeSiSjin the population, fij9 the
fre-quency of genotype SiSj in the next generation, and
F[ffijg a symmetric matrix. We assume an infinite
population of diploid hermaphrodite individuals pro-ducing an infinite number of pollen and ovules. We also assume that the probability that a given pistil receives a given type of pollen depends only on the frequency
of the latter in the pollen pool. We denotewijklthe
frac-tion of seeds produced by a cross betweenSiSjpollen
andSkSlovules among all seeds. The fraction of seeds
produced by a cross between genotypes SiSj and SkSl
iswijkl 1 wklij. Hence, the frequency of seeds SiSk
pro-duced by a cross between genotypes SiSj and SkSl is
(wijkl1wklij)/4 ifk6¼l andi6¼j, (wijkl1wklij)/2 ifk¼lor
i ¼ j, and (wijkl 1 wklij) if k ¼ l and i ¼ j. Finally,
the frequencies of heterozygotesSiSjand homozygotes
SiSiafter one generation are
f9ij¼
Xn
k¼1 1
2ðwiijk1wjkiiÞ1 Xn
k¼1 1
2ðwikjj1wjjikÞ
1X
n
k¼1 k6¼i
Xn
l¼1 l6¼j
1
4ðwikjl1wjlikÞ fori6¼j;
fii9¼ Xn
j¼1 1
2ðwiiij1wijiiÞ1
Xn
j¼1 j6¼i 1 4wijij1
Xn
j¼1 j6¼i
Xn
k¼1 k6¼i6¼j
1
4ðwijik1wikijÞ:
ð1Þ
The value ofwijklfor any two genotypes depends on their
population frequencies, on the compatibility indicators
pijkl, and on the chosen regime of frequency-dependent
selection: FDSm/for FDSm.
Under FDSm/f, a pistilSkSlreceives compatible pollen
with a probability equal to the overall sum of the fre-quency of compatible pollen Pni;j;i#jpijklfij. Hence, if compatible pollen is rare (pollen limitation), a given plant may produce less seeds and selection may occur through both male and female reproductive functions.
Pollination of a pistil SkSl by a pollen SiSj occurs with
probability fij fkl and fertilization with probability pijkl
fijfkl. Hence, the contribution of a cross between a
pol-lenSiSjand a pistil SkSl to the next generation under
FDSm/fis
wijkl[
pijklfijfkl
Pn s;t;u;v s#t;u#v
fs;tg6¼fu;vg
ðpstuv1puvstÞfstfuv1Pnu;v
u#v
puvuvfuv2
: ð2Þ
Under FDSm, every plant receives enough compatible
pollen such that all plants produce the same quantity of seeds and selection occurs through the male reproduc-tive function only. The total frequency of compatible pollen with an SkSl pistil is Pnu;v;u#vpuvklfuv such that
ovules of anSkSlplant are fertilized by pollen from an
SiSjplant with probability
pijklfij
Pn
u;v u#v
puvklfuv
: ð3Þ
According to FDSm, a cross between a pollenSiSjand a
pistil SkSl thus contributes to the next generation in
proportion
wijkl[
pijklfijfkl
Pn
u;v u#v
puvklfuv
: ð4Þ
Overall the frequency of alleleSiin the next
gener-ation thus equals tof9i¼f9ii1
Pn
j6¼i1=2f9ij, wheref9iiand
f9ij can be obtained from Equation 1, where values for
wijklcan be obtained from either Equation 2 or Equation
Simple cases:Three kinds of dominance relationships
have typically been used in the literature (Schierup
et al.1997; Vekemanset al.1998): cod, where all alleles are codominant in pistil and pollen; dom, where alleles occur in a linear dominance hierarchy, identical in both pistil and pollen (two alleles from the same dominance class are codominant and each allele of a given domi-nance class is either strictly dominant or strictly recessive relative to the alleles of another dominance class); and domcod, where alleles follow the dom model in pollen and the cod model in pistil. Each of these three models can be conveniently represented with our notations, using the following dominance relationships matrices
aandf(here represented for three dominance classes
and six alleles, two alleles in each class):
acod¼ fcod¼fdomcod¼
1 0:5 0:5 0:5 0:5 0:5
0:5 1 0:5 0:5 0:5 0:5
0:5 0:5 1 0:5 0:5 0:5
0:5 0:5 0:5 1 0:5 0:5
0:5 0:5 0:5 0:5 1 0:5
0:5 0:5 0:5 0:5 0:5 1
0 B B B B B B B B B B B @
1 C C C C C C C C C C C A
adom¼fdom¼adomcod¼
1 0:5 0 0 0 0
0:5 1 0 0 0 0
1 1 1 0:5 0 0
1 1 0:5 1 0 0
1 1 1 1 1 0:5
1 1 1 1 0:5 1
0 B B B B B B B B B B B @
1 C C C C C C C C C C C A
: ð5Þ
Hence, for instance, alleleS1in the domcod model is
codominant with allele S2 only (they are in the same
dominance class) and recessive relative to all other alleles in pollen, while it is codominant with all alleles in pistil. Here, we do computations mainly for two kinds of dominance relationships, dom and domcod, for which we state for clarity that class 1 is always the most recessive class. It is, however, possible to numerically compute genotypic frequencies at equilibrium for any dominance relationships between alleles (see below). A
Mathematica (WolframResearch2004) notebook
per-forming those calculations is available from S. Billiard.
Deterministic equilibrium frequencies:According to
Equations 1, 2, and 4, the frequency change for a given genotype depends on the genotypic frequencies matrix
F. We thus computed the frequency of all genotypes
after reproduction, during which frequency-dependent
selection occurs, using Equations 1 and 2 under FDSm/f
or Equations 1 and 4 under FDSm. Deterministic
equilibrium genotypic and allelic frequencies were computed using recursively Equations 1, 2, and 4 until
the frequency change in one generation was,106for
all genotypes. The initial genotypic frequencies are the same for all genotypes and set as the inverse of the total
number of possible genotypes 2=ðnðn11ÞÞ.
Allele number in the most recessive class: This
analysis was motivated by the unexpected result of
Uyenoyama (2000) who showed that, under FDSm
and domcod dominance relationships with two domi-nance classes, two alleles could not coexist in the recessive class except when more than two alleles occur in the recessive class or two or less alleles in the dominant class, in which case all recessive alleles can be maintained. We determined if this result still holds for models with more than two dominance classes, for dom and domcod dominance relationships and under
both FDSm/fand FDSm. For a given set of parameters, we
first ran computations until deterministic equilibrium was reached (see previous paragraph). Since all geno-typic frequencies are equal at the beginning of the deterministic computations, no alleles are lost deter-ministically during this step. We then perturbed the system by randomly changing the frequency of all genotypes (multinomial sampling of genotypic frequen-cies with 1000 trials) and let the population evolve deterministically for an additional 10,000 generations. The deterministic equilibrium after the perturbation did not depend on the sampling. So, we chose to perform the procedure a single time for each single parameter set. We specifically investigated whether (1) allelic frequencies came back to the same equilibrium values as before the perturbation (we considered that the equilibrium frequencies before and after the per-turbation were identical if the difference between them
was,106) or (2) some alleles tended to disappear. We
performed computations for 3, 4, 5, 6, and 10 dominance classes, with one, two or three alleles by dominance class. Only some combinations of these parameters have been examined (see supplemental data at http://www.genetics. org/supplemental/ for the complete list of parameter combinations tested).
Selection strength: Because frequency-dependent
selection acts on genotypes rather than alleles and since an infinite array of genotype frequencies is compatible with a given set of allelic frequencies, measuring the strength of selection for a given allele is not an easy task. In general, the strength of selection can be defined as a function of the frequency change in a generation. When a genotype departs from its equilibrium frequency, negative frequency-dependent selection is expected to bring frequencies back to equilibrium. To measure
selection strength for allele i in a synthetic way, we
compared its frequency change in a generation nor-malized by the genetic variance si[ðfi9fiÞ=ðfið1fiÞÞ for a given deviation from its equilibrium frequency
di[ðfifi*Þ=fi*, where a superscript asterisk refers to
equilibrium values. Practically, random deviations were obtained by sampling 500 diploid individuals from a population at deterministic equilibrium for cases with
two alleles by dominance class. Values ofdiandsiwere
of selection for alleleiwas measured as the slope of the
linear regression betweendiandsi.
Stochastic simulations:For simulations in finite
pop-ulations withNdiploid individuals, we used a three-step
life cycle:
i. Gametogenesis, syngamy, and seed production: Frequency-dependent selection occurred during this step and we used Equations 1, 2, and 4 to com-pute the genotypic frequencies in the seed pool (assuming that individuals produce an infinite number of seeds).
ii. Drift: Given the genotypic frequencies in the seed pool after frequency-dependent selection, we
ran-domly sampled N seeds to constitute the next
generation of adults.
iii. Mutation: The number of mutation events occur-ring in a generation was drawn from a Poisson
distribution with mean 2Nm, with m the
muta-tion rate. We used aK-allele model (KAM);i.e., we
randomly drew for each mutation event one of the
2N genes, whose allelic state was equiprobably
changed to one of K 1 other possible states,
irrespective of dominance classes.
To compute the expected number of alleles in finite populations, simulations were performed for dom and domcod dominance relationships, under both selection regimes, with three dominance classes. We fixed the
number of possible allelic states toK¼18 (6 per class)
andK¼ 30 (10 per class) forN ¼100 and N ¼500,
respectively. Those limits were fixed after some pre-liminary simulations showing that for these population sizes, a higher number of alleles at a given time was never or very rarely reached. Some alleles could be lost by drift or introduced in the population by mutation,
and thus n varies but at any given time, n # K.
Sim-ulations were also performed with a higher number of possible allelic states, but the results were quantitatively
similar (not shown). Simulations were started withK/3
alleles in each class, the total number of alleles at the
beginning was thus n ¼ K, and the initial genotypic
frequencies were set at deterministic equilibrium with-out mutation as described above. We ran simulations for 10,000 generations to reach a drift–mutation–selection equilibrium where the mean total number of alleles over time remained stable. We then recorded the num-ber of alleles in each class every generation during 100,000 generations and computed the probability that a given number of alleles were present in a given class during the whole process. An allele was counted if its
frequency was.0.01 after drift. We performed 100
in-dependent replicates of the whole process and we pres-ent the mean over replicates. Since the process is stationary, that is to say the mean and the variance of the number of alleles in the population do not change with time, our estimation of the expected number of alleles should not be biased.
DETERMINISTIC DYNAMICS AND EQUILIBRIUM
Model verification: The deterministic equilibrium
frequencies obtained using our model were compared to the results available in the literature for models
with FDSmwith only one allele in each class (Schierup
et al. 1997), n alleles in two classes under domcod (Uyenoyama 2000), n alleles in three classes under
domcod (Sampson1974), and nalleles in four classes
under dom (Schierupet al.2006) as well as with FDSm/f
with 1 allele in each class (Vekemanset al.1998). Results
were identical in all cases, thus confirming that the proposed formalization is a correct generalization of all previous SSI models.
Deterministic dynamics:Figure 1 shows the dynamics
of allelic frequencies under dom and domcod
domi-nance patterns with three domidomi-nance classes and FDSm/f
or FDSmselection regimes. Although equilibrium was
reached more quickly under FDSm/fthan under FDSm
for the dom model, equilibrium allelic frequencies were sensibly the same under both selection regimes. Under domcod, in contrast, the equilibrium values differed greatly between the two selection regimes: The differ-ence between dominance classes was higher under
Figure1.—Dynamics of the total frequency of dominance
FDSm/fthan under FDSm. Despite the large difference in the frequencies at equilibrium under domcod, the equilibrium values were reached in approximately the same number of generations under both models of selec-tion. This is due to the fact that selection occurred
through male and female fitnesses under FDSm/f;
con-sequently, although the difference between initial and
equilibrium frequencies was greater under FDSm/fthan
FDSm, selection was also stronger and the approach
toward equilibrium frequencies was faster.
The recessive effect: We investigated the recessive
effect in models with different numbers of dominance classes and numbers of alleles per class, using both selection regimes. We quantified this effect with either the frequency of a single allele from a given class or with the total frequency of all alleles of that class. Figure 2 shows that equilibrium frequency of a given allele decreases when the dominance level of its class in-creased under both dom and domcod dominance patterns and for both selection regimes. The effect
was, however, weak under domcod with FDSm.
Interest-ingly, equilibrium allelic frequencies were almost iden-tical between the two selection regimes under the dom model, which generalizes the results obtained by Vekemanset al.(1998) in a simpler model with only one allele by class. In the domcod model in contrast, equilibrium allelic frequencies were sharply different
between FDSm and FDSm/f with substantially higher
difference between the most recessive and the most
dominant allelic frequencies under FDSm/f.
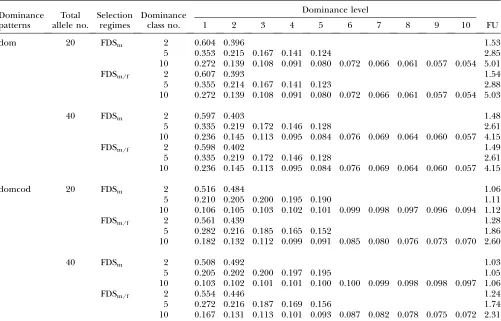
Figure 2 also reveals that the equilibrium frequency of an allele of a given class increases together with the total number of classes. This effect arises as a consequence of fixing the total number of allelic states (the small
number effect; Sampson1974). In such case, the
num-ber of alleles by class varies and the total frequency of a class is then equally shared among all alleles of that class. Moreover, the total frequency of a class depends on the total number of alleles considered. For a given number of classes, an increase in the total number of alleles
Figure2.—Frequency at deterministic
resulted in an increase in the total frequency of the most dominant classes, together with a decrease in the total frequency of the most recessive classes (Table 2).
In spite of the inherent asymmetry among alleles in SSI caused by dominance, the frequency unevenness (FU), as measured by the ratio of the total frequency of the most recessive to the most dominant classes, was very
low in some cases, especially under FDSmand domcod
dominance patterns (Vekemanset al.1998 showed this
result for one allele by class). Indeed, in this case FU re-mained as low as 1.03 when the 20 alleles considered belong to two dominance classes only. Yet, several fac-tors had an impact on FU. For a given set of parameters
in Table 2, FU under FDSm/f was on average 35.5%
higher than under FDSm. Moreover, as revealed by Table
2, the number of dominance classes strongly influenced how even allelic frequencies remained among classes. FU generally increased with the number of classes, reaching overall frequencies for the most recessive class 5.03 times higher than the overall frequencies for the most dominant class with 20 alleles evenly distributed among 10 dominance classes. Table 2 also shows that when the number of alleles by class increases, FU
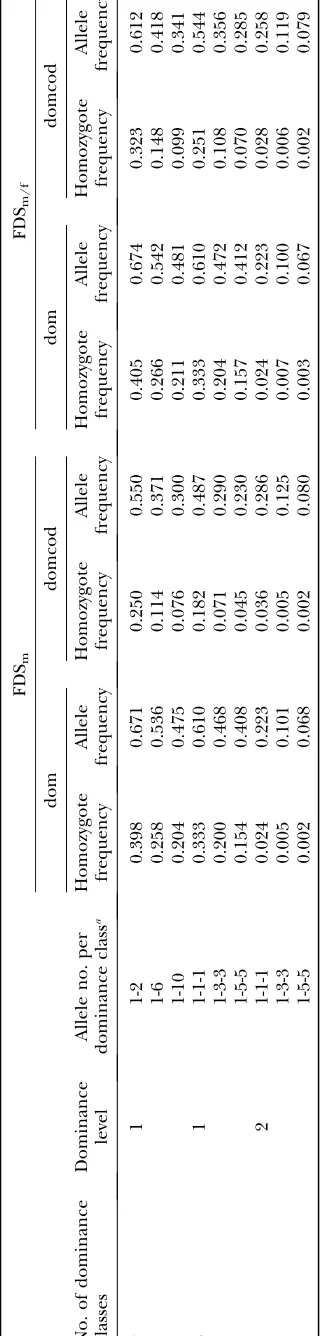
de-creases, under both dominance patterns and selection regime. This is due to the fact that the higher the number of alleles, the lower the selection strength dif-ference between alleles of different dominance classes since the number of compatible genotypes is increased for all genotypes. Hence FU tends toward 1 when the total number of alleles increases. Conversely, when there is only one allele in the most recessive class and there are several alleles in the more dominant classes, the re-cessive effect may be large (Table 3).
These results confirmed the generality of the reces-sive effect when there is a linear dominance hierarchy between alleles in pistil and pollen (dom) or in pollen only (domcod), for models with a larger number of dom-inance classes and higher numbers of alleles per class than had previously been considered, as well as under the two selection regimes considered.
Homozygote frequencies:Because of the dominance
relationships among alleles in SSI, homozygotes can be formed for alleles belonging to all classes but the most dominant one. As revealed by Table 3, homozygotes for the most recessive allele can reach high equilibrium fre-quencies even when the total number of alleles is high
TABLE 2
Total frequency of dominance classes at equilibrium under the FDSmor the FDSm/fmodel, for 20 and 40 alleles
equally distributed among dominance classes
Dominance patterns
Total allele no.
Selection regimes
Dominance class no.
Dominance level
1 2 3 4 5 6 7 8 9 10 FU
dom 20 FDSm 2 0.604 0.396 1.53
5 0.353 0.215 0.167 0.141 0.124 2.85
10 0.272 0.139 0.108 0.091 0.080 0.072 0.066 0.061 0.057 0.054 5.01
FDSm/f 2 0.607 0.393 1.54
5 0.355 0.214 0.167 0.141 0.123 2.88
10 0.272 0.139 0.108 0.091 0.080 0.072 0.066 0.061 0.057 0.054 5.03
40 FDSm 2 0.597 0.403 1.48
5 0.335 0.219 0.172 0.146 0.128 2.61
10 0.236 0.145 0.113 0.095 0.084 0.076 0.069 0.064 0.060 0.057 4.15
FDSm/f 2 0.598 0.402 1.49
5 0.335 0.219 0.172 0.146 0.128 2.61
10 0.236 0.145 0.113 0.095 0.084 0.076 0.069 0.064 0.060 0.057 4.15
domcod 20 FDSm 2 0.516 0.484 1.06
5 0.210 0.205 0.200 0.195 0.190 1.11
10 0.106 0.105 0.103 0.102 0.101 0.099 0.098 0.097 0.096 0.094 1.12
FDSm/f 2 0.561 0.439 1.28
5 0.282 0.216 0.185 0.165 0.152 1.86
10 0.182 0.132 0.112 0.099 0.091 0.085 0.080 0.076 0.073 0.070 2.60
40 FDSm 2 0.508 0.492 1.03
5 0.205 0.202 0.200 0.197 0.195 1.05
10 0.103 0.102 0.101 0.101 0.100 0.100 0.099 0.098 0.098 0.097 1.06
FDSm/f 2 0.554 0.446 1.24
5 0.272 0.216 0.187 0.169 0.156 1.74
10 0.167 0.131 0.113 0.101 0.093 0.087 0.082 0.078 0.075 0.072 2.31
and they possibly represent an important proportion of individuals carrying the most recessive allele. The ho-mozygote frequency is higher under dom than under domcod for both selection regimes and is lower under
FDSmthan under FDSm/f. Table 3 also shows homozygote
frequencies for alleles of class 2 when there are three dominance classes. Homozygotes for class 2 alleles reach much lower equilibrium frequency than the class 1 allele.
ALLELE NUMBER BY DOMINANCE CLASS
Allele number in the most recessive class:Uyenoyama
(2000) showed that under FDSm and domcod
domi-nance patterns with two domidomi-nance classes, very re-strictive conditions are required for two alleles to be deterministically maintained in the most recessive class. We used our general model to extend this investigation and explore the conditions under which several alleles can be deterministically maintained in the most reces-sive class when there are more than two dominance classes for both selection regimes, under dom and dom-cod dominance relationships (all parameter combina-tions examined and results are available as supplemental data at http://www.genetics.org/supplemental/).
Under FDSm/f, two or more alleles in the most
re-cessive class were always maintained and had identical frequency at equilibrium under both the dom and the domcod dominance relationships. The same was true
for the dom model under FDSm. In contrast, under
FDSm in the domcod model, several alleles could be
maintained in the most recessive class only if more than two alleles occurred in the most recessive class. When exactly two alleles occurred in the most recessive class, they could still be maintained if (1) there is a single allele in each other dominance class and/or (2) there is a single allele in each class but exactly two alleles in the most dominant class (3 classes), in one of the 3 most dominant classes (4, 5, and 6 classes), or in one of the 4 most dominant classes (10 classes). In all other cases, notably with two alleles in the most recessive class and three alleles in at least one of the other classes, the reces-sive allele with the lowest frequency ultimately disap-peared. Altogether our results thus suggest that the occurrence of a single allele in the most recessive class
is a specific property of the FDSmregime when combined
with the domcod dominance relationships.
Number of alleles maintained in finite populations:
Simulations with three dominance classes, under dom-cod dominance relationships and for both selection regimes in a population of 100 and 500 diploid individ-uals, showed that the distributions of the allele number
for dom under FDSm/fand FDSmwere similar to those
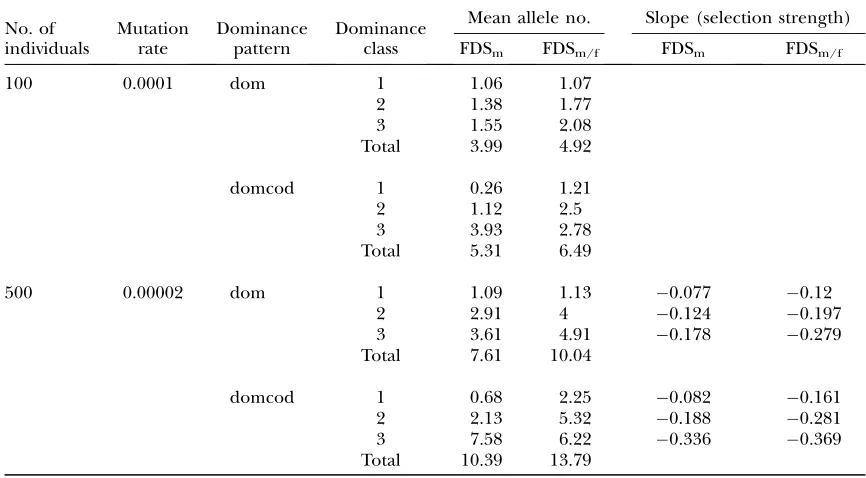
for domcod under FDSm/f(Figure 3). The average
num-bers of alleles under FDSm/fand FDSmunder dom and
domcod are given in Table 4.
Interestingly, the number of alleles maintained in a
class increased with dominance. Under FDSm/f, there
was a high probability to observe only one allele in the most recessive class, but this probability decreased with increasing population size. When comparing both
dom-inance models under FDSm/f, we found that the
num-ber of alleles maintained in each class was higher under domcod than under dom (Table 4).
When the population size was large enough, more than one allele could frequently be maintained in the
most recessive class under FDSm/fand domcod (Table
4). Under FDSm, however, one allele was at best
ex-pected in the most recessive class, with many cases where all alleles from this class became lost from the
popula-tion. Under FDSmwhenN¼100, distributions for the
number of alleles were quite different between dom and domcod. Under domcod, the most typical outcome was no allele in the most recessive class and mostly one allele in class 2. Under dom, one allele was always maintained in the most recessive class (Table 4). Under domcod,
when the size of the population was increased toN¼500
individuals, the probability of loss for the most recessive
class was0.33. In the latter case, class 2 became the
most recessive class, where a single allele was thus
ex-pected to be maintained (vs. one to four alleles
main-tained when class 1 existed in the population). As a consequence, the distribution of the number of class 2 alleles became bimodal (Figure 3). Although the distri-bution of the number of class 3 alleles was not bimodal,
it was, however, wider than under FDSm/f presumably
because when class 1 was lost, more alleles were present in class 3.
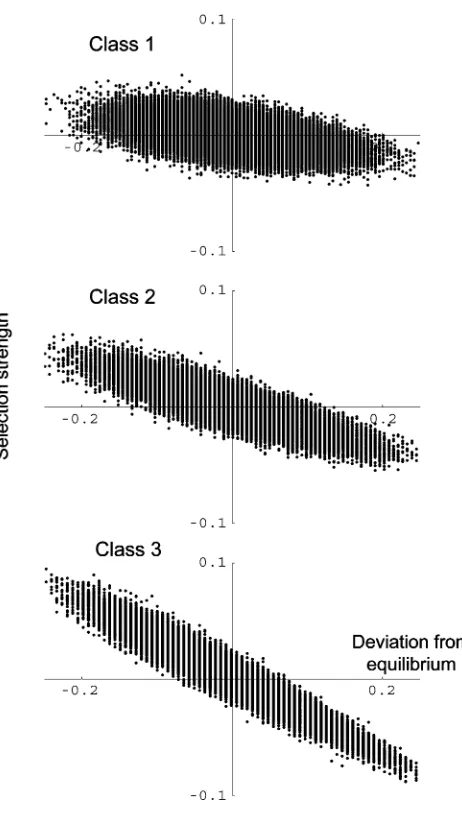
Selection strength: Although selection strength
var-ied extensively according to the genotypic composition of the population (Figure 4), the expected selection strength over all genotypic compositions closely fol-lowed negative frequency-dependent selection. Most in-terestingly, Figure 4 shows that the relationship between selection strength and relative deviation differed among classes. The slope was high for the most dominant class, intermediate for the intermediate class, and low for the most recessive class. In addition, the regression slope was
higher under FDSm/fthan under FDSm(Table 4), in line
with the fact that equilibrium was attained more quickly (Figure 1). The slopes were also higher under domcod than under dom under both selection regimes, and they were also higher for alleles in higher dominance classes. This strongly suggested that alleles in the most recessive class are subject to weaker selection than alleles in the dominant classes. This analysis provided a mechanistic explanation for the differences in the number of alleles maintained in a class in finite populations. The stronger selection is, the higher the number of alleles maintained in the population is expected to be. Indeed, even if al-leles in the most dominant classes are expected to be the least frequent (Table 2), the most dominant class has the highest number of alleles (Table 4) because those alleles are returned to their equilibrium frequency faster than alleles in the recessive classes. Hence, for a given equili-brium frequency and a given population size, the probability for an allele to be lost by drift is negatively correlated with its dominance level.
Figure 3.—Distribution
APPLICATIONS
Comparison between expected and observed
fre-quencies in natural populations:The dominance
rela-tionships between alleles have been studied in only a few species with sporophytic self-incompatibility and, at best, only partially. An estimation of observed allelic fre-quencies in a natural population is also available in a few cases only. To illustrate the potential use of our model to test the hypothesis of negative frequency-dependent se-lection, we applied our model to two cases for which
both data sets are available: Sinapis arvensis (Stevens
and Kay 1989) and Ipomoea trifida (Kowyama et al.
1994). Assuming that individuals were sampled in a large population at selection–mutation equilibrium, it is possible to test whether the observed allelic frequencies are significantly different from the expectation under our model. For that purpose, we used a likelihood-ratio test to test whether the observed frequencies signifi-cantly differ from a multinomial distribution with the expected equilibrium allelic frequencies as parameters. The expected equilibrium allelic frequencies were com-puted using our general model, with the number of
allelesnequal to the number of specificity observed in
each population:n¼33 for the population ofS. arvensis
and, respectively, n ¼ 5, n ¼ 16, and n ¼ 6 for
pop-ulations M81, M84, and G80 ofI. trifida.We computed
the log-likelihood ratio
Q[2X
n
j¼1 Njln
Nj
2Nfj*; ð6Þ
whereNjis the number of copies of allelejobserved in
the population, N is the total number of sampled
individuals,fj* is the expected frequency at equilibrium
for allelej, andnis the number of alleles observed in the
sample. The observed allelic frequencies are then
significantly different from the expectations if Q is
higher than a chi square with n 1 d.f. We also
per-formed the test on each allele independently, consider-ing all other alleles as a sconsider-ingle one, and tested if its observed frequency significantly differed from its
ex-pected frequency under our models (footnoteain Tables
5 and 6). For that purpose, we also used a likelihood-ratio
test withn¼2.
Example 1—S. arvensis:Stevensand Kay(1989)
ob-tained genotype frequencies for 34 individuals from a natural population. They found 35 alleles, belonging to three distinct dominance classes in pollen and two dom-inance classes in pistil. Interestingly, several domdom-inance relationships were asymmetrical. Allele 1, for instance, was one of the most recessive alleles in pistil but one of the most dominant alleles (together with allele 2) in
pollen (Stevens and Kay 1989;appendix a). Table 5
reports the observed frequencies from Stevens and
Kay(1989) as well as the expected frequencies obtained
under FDSm and FDSm/f. Overall, the observed
fre-quencies were not significantly different from the
expected frequencies under FDSm/f while they were
significantly different from the expected frequencies
under FDSm(Table 5). This discrepancy was mostly due
to several large differences between both selection regimes in the expected frequencies at equilibrium,
TABLE 4
Mean allele number and selection strength per dominance class in a finite population
No. of individuals
Mutation rate
Dominance pattern
Dominance class
Mean allele no. Slope (selection strength)
FDSm FDSm/f FDSm FDSm/f
100 0.0001 dom 1 1.06 1.07
2 1.38 1.77
3 1.55 2.08
Total 3.99 4.92
domcod 1 0.26 1.21
2 1.12 2.5
3 3.93 2.78
Total 5.31 6.49
500 0.00002 dom 1 1.09 1.13 0.077 0.12
2 2.91 4 0.124 0.197
3 3.61 4.91 0.178 0.279
Total 7.61 10.04
domcod 1 0.68 2.25 0.082 0.161
2 2.13 5.32 0.188 0.281
3 7.58 6.22 0.336 0.369
Total 10.39 13.79
notably for alleles 23 and 25. Allele 25 is the single most recessive allele in pollen and one of the nine most recessive alleles in pistil. Its observed frequency is significantly different from the expected frequency
under FDSm. Surprisingly, although allele 23 was
pre-dicted to be one of the less frequent alleles in the population, it was actually one of the most frequent in the samples, suggesting that evolutionary forces other than negative frequency-dependent selection may play a role in the evolution of this allele.
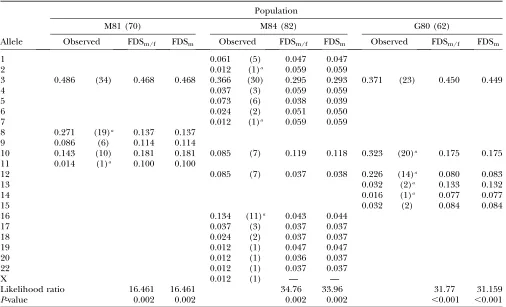
Example 2—I. trifida:The genotype of 214
individu-als from three populations was determined and 23
al-leles were found by Kowyamaet al.(1994). We give in
Table 6 the expected allelic frequencies obtained under
the FDSm and FDSm/f models as well as observed
frequencies in three populations. The dominance relationships matrix used for the computations is
de-rived from Kowyama et al. (1994) and is given in
appendix b. The dominance relationships are
approx-imately symmetric in pollen and pistil for all alleles. For computations in each population, we used a reduced matrix restricted to alleles present in each population. We found almost no differences between the predic-tions under both selection regimes. The observed frequencies were significantly different from the expect-ations in each population (Table 6). This departure was due to 2 alleles in population M81, 3 in population M84, and 4 in population G80. Allele 3 was recessive to all other alleles in pistil and pollen and it was, as expected, the most frequent in all populations. Allele 10 was recessive to all alleles except allele 3 and, as a conse-quence, it was expected to be the second most frequent allele after allele 3 in all populations. However, it was actually not the second most frequently observed allele in populations M81 and M84. Indeed, allele 8 in population M81 and allele 16 in population M84 had a much higher frequency than expected.
Although some level of concordance can be found,
especially forS. arvensis, the two examples above
gen-erally enabled us to reject the model’s predictions.
Figure4.—Selection strength as a function of the relative
deviation from equilibrium, under FDSm and domcod for three dominance classes. Each point represents a result for a randomly chosen genotypic composition of the population (see text for details). For a given relative deviation from equi-librium, several genotypic compositions are possible. The re-sults of a regression analysis for each class are shown in Table 4.
TABLE 5
Observed and expected frequencies forSinapis arvensis
according to dominance relationships and data from
natural populations given in STEVENSand KAY(1989)
Allele Observed FDSm/f FDSm
1 0.029 (2) 0.070 0.081
2 0.015 (1) 0.023 0.029
3, 24 0.029 (2) 0.038 0.028
4, 6, 12 0.029 (2) 0.020 0.020
5, 9, 14 0.015 (1) 0.020 0.020
7, 13 0.059 (4) 0.020 0.020
8 0.044 (3) 0.018 0.020
10, 11 0.059 (4) 0.038 0.028
15 0.059 (4) 0.034 0.028
16 0.044 (3) 0.038 0.028
17, 27, 28, 35 0.015 (1) 0.020 0.020
18, 19, 29, 30, 34 0.029 (2) 0.020 0.020
20 0.015 (1) 0.046 0.054
23 0.088 (6) 0.020 0.020a
25 0.015 (1) 0.069 0.104a
26, 31 0.015 (1) 0.038 0.028
32, 33 0.015 (1) 0.055 0.058
Likelihood ratio 38.961 46.633
P-value 0.185 0.046
The number of identified alleles is given in parentheses next to the observed allele frequencies.
aAlleles for which the observed frequency is significantly
Although the low number of individuals analyzed relative to the total number of alleles in the population may greatly affect the accuracy of allele frequency estimates, this pattern of discrepancy may actually reveal that additional evolutionary forces are indeed interfer-ing with the strict frequency-dependent selection imple-mented in our model. Our model may thus be viewed as a ‘‘null model,’’ where frequency-dependent selection is the only evolutionary force taken into account.
DISCUSSION
Generality of the model:Due to the generality and
flexibility of our approach, we were able to investigate a large range of SSI models in a single framework. This enabled us to fill the gaps between previously scattered theoretical investigations (Table 1) as well as to extend previous results to situations with many dominance classes and several alleles per class. This approach has been used to compute equilibrium genotypic and allelic frequencies under a variety of conditions and to com-pute expected genotypic changes over a single genera-tion on the basis of known genotypic composigenera-tion from
a natural population, as well as to perform exploratory stochastic simulations. These analyses rely on the as-sumption that the only relevant force acting on S alleles is negative frequency-dependent selection generated by self-incompatibility. Basically we showed that the higher frequency of recessive alleles is a general feature of SSI models, but also that in finite populations the number of dominance classes will evolve according to the pop-ulation size, and that dominant classes will contain more alleles than recessive classes. We also showed that
fecundity selection (FDSm/f) may have large effects on
the dynamics of allelic frequencies as well as on the expectation of the number of alleles, the number of dominance classes, and the number of alleles by class maintained in finite populations. We notably showed
that contrary to FDSm, it is possible to maintain
de-terministically more than one allele in the most re-cessive class under domcod and consequently in finite populations.
Because our model uses very general recurrent equa-tions, it can be extended to incorporate direct selection on S alleles, such as, for instance, selection due to the expression of linked deleterious alleles in homozygotes.
TABLE 6
Observed and expected frequencies forIpomoea trifidaaccording to dominance relationships and data from natural
populations given in KOWYAMAet al.(1994)
Population
M81 (70) M84 (82) G80 (62)
Allele Observed FDSm/f FDSm Observed FDSm/f FDSm Observed FDSm/f FDSm
1 0.061 (5) 0.047 0.047
2 0.012 (1)a 0.059 0.059
3 0.486 (34) 0.468 0.468 0.366 (30) 0.295 0.293 0.371 (23) 0.450 0.449
4 0.037 (3) 0.059 0.059
5 0.073 (6) 0.038 0.039
6 0.024 (2) 0.051 0.050
7 0.012 (1)a 0.059 0.059
8 0.271 (19)a 0.137 0.137
9 0.086 (6) 0.114 0.114
10 0.143 (10) 0.181 0.181 0.085 (7) 0.119 0.118 0.323 (20)a 0.175 0.175
11 0.014 (1)a 0.100 0.100
12 0.085 (7) 0.037 0.038 0.226 (14)a 0.080 0.083
13 0.032 (2)a 0.133 0.132
14 0.016 (1)a 0.077 0.077
15 0.032 (2) 0.084 0.084
16 0.134 (11)a 0.043 0.044
17 0.037 (3) 0.037 0.037
18 0.024 (2) 0.037 0.037
19 0.012 (1) 0.047 0.047
20 0.012 (1) 0.036 0.037
22 0.012 (1) 0.037 0.037
X 0.012 (1) — —
Likelihood ratio 16.461 16.461 34.76 33.96 31.77 31.159
P-value 0.002 0.002 0.002 0.002 ,0.001 ,0.001
The sample size is given in parentheses next to the population name and the number of identified alleles is given in parentheses next to the observed allele frequencies.
a
In line with most other theoretical investigations of
self-incompatibility (SI) (but see Charlesworth1988), we
also assumed that self-incompatibility was fully
func-tional (technically, the compatibility thresholdswas set
to zero in all our computations). However, partial self-incompatibility is often reported in empirical studies (Nouet al.1991; Reinartzand Les1994; Good-Avila
and Stephenson2002; Mableet al.2005), and
exam-ination of its effect using modifications of our model is straightforward.
Generality of the recessive effect: As was shown by
several authors in a number of different specific situations, we observed in deterministic models that alleles from the most recessive class were always more frequent than dominant alleles, and this result was consistent across any number of classes, any number of alleles per class, and both types of selection (Table 2 and Figure 2). However, the strength of this recessive effect varied greatly among models. In the dom model, the effect increased drastically with increasing number of dominance classes, but was little affected by the number
of alleles per class. In the domcod model with FDSm, the
recessive effect was weak and did not increase much with the number of dominance classes, whereas the effect
was stronger under FDSm/f. These results are
qualita-tively identical to those obtained by Schierup et al.
(1997) and Vekemanset al.(1998) in models with only
one allele per class. We showed that the recessive effect is even higher when the number of alleles by classes is different, especially when there is only one allele in the most recessive class (Table 3). In general agreement with these results, higher frequencies of the most recessive alleles have been observed in most empirical surveys of S alleles in natural populations of species with
SSI (Sampson1967; Stevensand Kay1989; Kowyama
et al.1994; Mableet al.2003; Gle´ minet al.2005). Using our model, the recessive effect seemed also to be verified for the most recessive alleles in a case with very complex overall patterns of dominance, such as allele 25 inS. arvensis. In other complex cases, it may be difficult to decide unambiguously which allele is dominant or recessive but we can still interpret differences in expected frequencies in terms of relative dominance.
How many alleles per dominance class in finite
populations?This study is the first to investigate models
of SSI that allow multiple alleles per dominance class in
finite populations (but see Uyenoyama 2000). We
consistently found that the number of alleles main-tained per dominance class increases with dominance level. This result is not trivial because deterministic computations in models with an identical number of alleles in each class predicted a lower frequency of more dominant alleles, which could potentially cause a higher rate of loss of dominant alleles due to genetic drift. Empirical studies seem to agree overall with this
expectation. InArabidopsis lyrata, where four dominance
classes have been recorded, 8 S alleles are known overall
in the two most recessive classes, whereas the two most
dominant ones comprise 16 S alleles (Prigoda et al.
2005). Similarly, in a single population of this species, 3 and 8 S alleles were found in the most recessive and the
most dominant classes, respectively (Schierup et al.
2006). InBrassica insularis, where two dominance classes
are known and dominance relationships seem to follow the domcod model, 2 alleles have been identified in the
recessive class whereas.18 alleles have been recorded
in the dominant class (Gle´ minet al.2005). Differences
in allele numbers between the most recessive and the
most dominant classes are increased under FDSm/f, as
compared to the FDSmmodel, and we showed that the
overall strength of selection is higher under the former. The higher number of alleles in dominant than in recessive classes could be due either to higher rates of incorporation of new alleles, with dominance confer-ring a large advantage over recessive alleles when rare (Schierupet al.1997), and/or to lower rates of loss. Our estimates of the strength of selection on alleles from different classes of dominance indicate a clear trend of increasing selection intensity with increasing domi-nance (Table 4). SSI systems thus appear as important examples of asymmetric balancing selection. Because individual allelic frequencies within a given dominance class are inversely related to the number of alleles in that
class (Sampson1974), the recessive effect is amplified by
this difference in allele numbers, with substantially higher differences in frequencies between dominant and recessive alleles in finite populations, which could explain the very high differences in allelic frequencies
observed forI. trifida(Table 6).
An additional mechanism must be taken into account to explain the number of alleles by dominance class
under the FDSm model of selection and domcod
dominance relationships. Indeed, as first pointed out by Uyenoyama(2000), under deterministic conditions, two alleles cannot coexist in the most recessive class: As soon as a slight perturbation is introduced, the less frequent allele tends to disappear. Although this argu-ably occurred under a wide range of parameters, we also showed that some cases exist where two alleles can be maintained in the most recessive class for up to 10 dominance classes. It is interesting to note that this
result does not extend to FDSm/f under which two
alleles can typically coexist at deterministic equilibrium under domcod. When the size of the population is small, only one allele is observed in the most recessive class (Figure 4). However, when the size of the popula-tion increases, then more than one allele coexist in the most recessive class even under domcod dominance
relationships, contrary to results under the FDSmmodel
(Table 4 and Figure 4). Gle´ min et al. (2005) found
evidence for the occurrence of two alleles in the most
recessive class within populations of B. insularis and
alleles in the most recessive class in a panmictic population when selection occurs through both male and female reproductive structures. Because of the low
density inB. insularispopulations, pollen limitation due
to low pollinator activity could indeed generate a female component of frequency-dependent selection through
fecundity selection (Vekemans et al. 1998), and the
FDSm/fmodel is likely to be relevant.
How many dominance classes in finite populations?
In finite populations, the number of dominance classes
may evolve. Schierupet al.(1997) showed that under
the FDSmregime and domcod, the most recessive alleles
could not be maintained in finite populations: Every time a more dominant allele appeared in the popula-tion (in their model the number of dominance classes was infinite), the most recessive allele tended to be lost, resulting in a constant turnover of the most recessive allele. Hence, absolute levels of dominance tend to increase over time. Here we reported a phenomenon
similar to the results of both Uyenoyama(2000) and
Schierupet al.(1997). Indeed, as shown in Figure 3 and
Table 4, under FDSmand domcod, class 1 may be lost.
The probability of loss of the most recessive class de-pends on the size of the population, suggesting that a simple interaction between demography and selection may cause differences in the number of dominance classes in different species. This could be relevant to ex-plain why in the Brassica genus, only two dominance classes are found in Brassica, where domcod patterns of
dominance are reported (Thompsonand Taylor1966),
whereas at least four dominance classes are known to
occur in A. lyrata where patterns of dominance are
dom-like (Prigodaet al.2005). Our results suggest that
differences in numbers of dominance classes can be explained by an interaction between demography and selection. The lower number of dominance classes in the Brassica genus could be related, for instance, to the occurrence of an ancient bottleneck, which would be congruent with the observation of lower phylogenetic
diversity of alleles in Brassica than inA. lyrata(Schierup
et al.2001).
Measure of selection strength:The measure we used
to quantify selection strength allowed us to better understand the difference in allele number maintained in different dominance classes under different models. Selection strength is a synthetic quantitative measure ex-plaining the different dynamics and expectations at equilibrium in finite populations both for selection regimes and for any kind of dominance relationship. Figure 4 showed that the frequency of an allele is not sufficient to predict its frequency change in a genera-tion under negative frequency-dependent selecgenera-tion be-cause this change will depend upon the exact genotypic composition of the population at this generation. In-deed, the frequency of an allele can increase in a generation even if it is higher than its equilibrium frequency expectation. Sporophytic self-incompatibility
systems illustrate how difficult it may be to measure selec-tion under complex selecselec-tion regimes such as negative frequency-dependent selection, notably since it de-pends on genotypic rather than allelic frequencies. In finite populations, selection strength reflects the prob-ability of loss for an allele and depends on its dominance class. However, within complex dominance patterns, it can be difficult to determine the absolute dominance level of an allele and it is possible to use selection strength for this allele to estimate its probability of being lost or maintained.
Frequency-dependent selection models and pollen
limitation: We observed large differences in the
prop-erties of the FDSmand FDSm/fmodels of selection, in
terms of frequencies at equilibrium, dynamics, and
ex-pected number of alleles by class. Notably, under FDSm/f
several alleles are expected in the most recessive class,
contrary to under the FDSmmodel. The fundamental
difference between both models is that under the FDSm
model, all plants receive sufficient compatible pollen to fertilize all their ovules, such that all plants produce the same quantity of seeds whatever their S-locus genotype and whatever the genotypes of the other individuals in the population. However, it is known that ‘‘pollen
limita-tion’’ may be frequent in natural populations,i.e., that
seed output is limited by the availability of compatible
pollen (Larsonand Barrett2000). Under the FDSm/f
model, not all plants produce the same quantity of seeds when the population departs from equilibrium because the probability that a given ovule will be fertilized is proportional to the amount of compatible pollen and thus varies among genotypes at the S locus. It would be interesting to know which of the two models of selection is closer to natural conditions, and we anticipate that this should heavily depend both on the species consid-ered and on ecological conditions. Indeed, when pop-ulations are small, because of a recent bottleneck or a recent colonization event, or highly structured or when pollen dispersal is strongly spatially restricted, we could expect pollen limitation to be important. The occur-rence of clonality due to vegetative propagation within species with SSI can also increase the incidence of pol-len limitation, due to within-ramets incompatible
polli-nation (DeMauro1993; Younget al.2002). Under those
circumstances, FDSm/fmodels could be more relevant.
Causes of the deviation between expected and
ob-served frequencies in natural populations:Our model
enabled us to compute expected frequencies for each allele and each genotype at equilibrium for any kind of dominance relationship. We showed that observed al-lelic frequencies were significantly different from the
expected frequencies under FDSmforS. arvensis(Table
5) and that alleles 23 and 25 taken independently had frequencies significantly different from their
expec-tations. ForI. trifidathe observed frequencies were
between expected and observed allelic frequencies. First, the empirical determination of allelic frequencies and dominance relationships within natural popula-tions may be inaccurate. Indeed, in articles from which those data were taken, only a fraction of all pairwise dominance relationships between alleles were actually tested, the others being inferred transitively. Also, errors in allele identification and statistical uncertainty due to low sample size relative to the number of alleles could lead to imprecise estimation of allelic frequencies. In particular, if all alleles are not known, the model will overestimate the allelic frequencies at equilibrium, es-pecially for alleles in the same dominance class as the missing alleles. Second, the sampled population may not be at equilibrium because of drift or perturbations of the habitat or because the colonization of the pop-ulation is recent. Third, poppop-ulation structure can also cause some deviation from deterministic equilibrium because the intrademe frequencies distribution can be different from that of a panmictic population for
inter-mediate migration rates (Schierup1998). Fourth, some
important model assumptions could be erroneous. In-deed, we assumed that all S alleles are selectively equiv-alent while there are reports of differential selection on
S alleles (Bechsgaardet al.2004). Also, we have seen
that the frequency of homozygotes is not negligible, especially for alleles in the most recessive dominance classes and when the number of S alleles is low. Hence, selection on S-allele-linked deleterious recessive alleles may play an important role in the dynamics of S alleles
in sporophytic systems (Uyenoyama1997) and could
explain the discrepancy between expected and ob-served frequencies in a natural population. Finally, several mechanisms have been described that could oc-cur in addition to frequency-dependent selection and potentially affect predictions for the number of alleles and their respective frequencies.
CONCLUSIONS
The model presented here is very general and allows predicting either genotypic frequencies at deterministic equilibrium (and all statistics derived from genotypic
frequencies such asFis) or the expected genotypic
fre-quencies that change in a generation. We confirmed previously identified characteristics of SSI systems and generalized them to situations with several alleles per dominance class. Moreover, we found emerging prop-erties of such systems in finite populations such as the dynamics of the number of dominance classes and the asymmetry in allele numbers among classes. However, these predictions hold only under the assumptions that the sole mechanism acting is negative frequency-dependent selection due to the particular reproductive system. Hence, the results obtained under this model constitute a direct test of this hypothesis, as illustrated with two example applications. Consequently one can
use this model as a tool to detect alternative selection forces that may be allele specific. Furthermore, in this article, the dominance classes were set either as param-eters in the deterministic computations or as the result of the maintenance or loss of alleles in a finite pop-ulation because of drift and frequency-dependent selec-tion. However, the model can be used to examine the evolution of dominance through the selection of a dominance modifier.
We thank F. Christiansen for sending a Mathematica notebook to verify our derivations in models with four dominance classes. We are indebted to S. Gle´min, to an anonymous reviewer, and to the associate editors for their suggestions to improve the manuscript. S. Billiard especially thanks M. Ballatore without whom this work would not exist. The self-incompatibility team at Lille University is supported by an Action The´matique et Incitative sur Programme grant from the Centre National de la Recherche Scientifique, an Action de Recherches Con-certe´es d’Initiative Re´gionale grant from Re´gion Nord-Pas de Calais, and a Fonds Europe´en de De´veloppement Re´gional grant from the European Union.
LITERATURE CITED
Bateman, A. J., 1952 Self-incompatibility systems in angiosperms.
1. Theory. Heredity6:285–310.
Bechsgaard, J., T. Bataillonand M. H. Schierup, 2004 Uneven
segregation of sporophytic self-incompatibility alleles in Arabidop-sis lyrata.J. Evol. Biol.17:554–561.
Charlesworth, D., 1988 Evolution of homomorphic sporophytic
self-incompatibility. Heredity60:445–453.
Chookajorn, T., A. Kachroo, A. G. Clarkand J. B. Nasrallah,
2004 Specificity determinants and diversification of theBrassica
self-incompatibility pollen ligand. Proc. Natl. Acad. Sci. USA101:
911–917.
Cope, F. W., 1962 The effects of incompatibility and compatibility
on genotype proportions in populations ofTheobroma cacaoL. Heredity17:183–195.
DeMauro, M. M., 1993 Relationship of breeding system to rarity in
the lakeside daisy (Hymenoxys acaulis var. glabra). Conserv. Biol.7:
542–550.
Gle´ min, S., T. Gaude, M. L. Guillemin, M. Lourmas, I. Olivieri
et al., 2005 Balancing selection in the wild: testing population genetics theory of self-incompatibility in the rare speciesBrassica insularis.Genetics171:279–289.
Good-Avila, S. V., and A. G. Stephenson, 2002 The inheritance of
modifiers conferring self-fertility in the partially self-incompatible perennial,Campanula rapunculoidesL.(Campanulaceae). Evolu-tion56:263–272.
Imrie, B. C., C. J. Kirkmanand D. R. Ross, 1972 Computer
simula-tion of a sporophytic self-incompatibility breeding system. Aust. J. Biol. Sci.25:343–349.
Kowyama, Y., H. Takahasi, K. Muraoka, T. Tani, K. Haraet al.,
1994 Number, frequency and dominance relationships of S-alleles in diploidIpomoea trifida.Heredity73:275–283. Larson, B. M. H., and S. C. H. Barrett, 2000 A comparative analysis of
pollen limitation in flowering plants. Biol. J. Linn. Soc.69:503–520. Mable, B. K., M. H. Schierupand D. Charlesworth, 2003
Esti-mating the number, frequency, and dominance ofS-alleles in a natural population ofArabidopsis lyrata(Brassicaceae) with sporo-phytic control of self-incompatibility. Heredity90:422–431. Mable, B. K., A. V. Robertson, S. Dart, C. D. Berardo and L.
Witham, 2005 Breakdown of self-incompatibility in the
peren-nialArabidopsis lyrata(Brassicaceae) and its genetic consequences. Evolution59:1437–1448.
Mehlenbacher, S. A., 1997 Revised dominance hierarchy for
S-alleles inCorylus avellanaL. Theor. Appl. Genet.94:360–366. Nou, I. S., M. Watanabe, A. Isogai, H. Shiozawa, A. Suzukiet al.,
1991 Variation of S-alleles and S-glycoproteins in a naturalized population of self-incompatibleBrassica campestris.Jpn. J. Genet.