F U R T H E R ILLUSTRAT ION S OF THE APPLICABILITY OF A
COEFFIC IENT MEASURING THE CORRELATION
B E T W E E N A VARIABLE A N D THE DEVIA- T I O N O F A D E P E N D E N T VARIABLE
FRO M ITS PROBABLE V A L UE
J. A R T H U R HARRIS
Station for Enperamental Evolution, Cold Spring Ifarbor, N e w York
[Received November 1, 19171
TABLE O F CONTENTS
PAGE
. . .
INTRODUCTORY 328
Earlier applications 33 1
Further illustrations 332
. . . ... arts in Paramecium.. ... ” . . . . . Absence of relationship between size of litter and sex Illustration 2 .
Illustration 3. Proportion of pistillate and hermaphrodite flowers in the
Illustration 4.
Illnustration 5. Relationship between the total number of pedicels and the
Illustration 6. Interrelationship of cotyledons and primordia
Illustration 7. Change in proportion of parts in developing trout Illustration 8. Relationship between total solids and sucrose cont
juice of sugar beets Illustration 9. Relationshi
Illustration IO. Viability of dominants an
...
inflorescence of the composite Homogyne. 336
number of abnormal pedicels in Spiraea Vanhouttei.. . . .
of Phaseohs vulgaris highly variable in seedling characters..
Fertility of capsules and viability of seed in carnation crosses 337
337
340 . . .
of sterile spikelets in wheat. . .
Mendelian hybrids . . .
RECAPITULATION 3.50.
LITERATURE CITED . . . 35 I
. . .
INTRODUCTORY
Eight years ago I pointed out (HARRIS 1909 a ) that when 21 is some fraction of x the correlation between them, rzz,, while of descriptive value,
APPLICABILITY OF A CO EFFICI ENT OF CORRELATION 329
does not give all of the information which is required concerning the interrelationship of these two variables, and that a coefficient showing whether the value of y becomes relatively larger or smaller with increas- ing values of x, would have considerable analytical value.
I showed' then that if x = px, where
p
=y/z,
the bars denoting pop- ulation means,VW-VXvV
The purpose of this paper is to illustrate the range of usefulness of this coefficient by noting biological progress which has been made by its use, and by actually applying it to series of data which have not been heretofore fully analyzed by the higher statistical methods.
Before passing to actual illustrations of applicability of the coefficient, some questions of method should be considered.
In cases in which the coefficient rx, is desired the correlation table has usually been formed t o determine r,,, where ZI
+
y = x. T he mean and standard deviation for x made up of any number of component3 (HARRIS 1917 c) are well known (PEARL 1909, HARRIS 1918 a ) ; w h e n x = v + y- _
-x=v+YJ U, = 1/ U;
+
a;+
27,,yuvuyIf one has made his summations about zero as origin, as suggested elsewhere (HARRIS 1910 b) it is quite easy to determine the necessary moments from those already available.
-
x = X ( x ) / n = p ( V )
+
X(y)]/n U: = [ q z q
+
X(y2)+
22(vy)]/n- 2
S(xv) =X(vZ)
+
8 ( v y ) X b Y ) = X( y2)+
X(VY) The product moments areX(vy) is in each case the product moment already obtained in the cal- culation of ruv
I n the original paper (HARRIS 1909 a )
,
the method of determining the value of us, which is essential f o r calculating the equation for the regres-sion of z on x, was not indicated.
J. ARTHUR HARRIS 330
The first and second moment of y for each grade of x, i.e., %(y,)
and S(y;), are easily determined. The first of these will have been obtained in computing the population product moment,
S(xy),
by the method cited above.Remembering that 2(y,) and 2(y;) are the first and second moments about zero as origin for the several y arrays of x, the moments of
x
for each array are
2 ( z , ) =
S(Y5)
- %Pn.From these the means of arrays which are required for plotting the re- gression curve are given a t once by
2, =
[
2 ( y z ) - ..px]/fl,For the whole population the first moment of s about o as origin is
The second moments for the individual arrays are
and for the population
= S { Z ( y . 3 - 3 p x [ Z ( y , > - %fix]
-
%(Px>’]
jS ( 4 = S(y2)
-
2 p S ( x y )+
s [ % ( P x ) 2 ] ,
(Iz; = [ S ( z ’ ) / N ] ”
or in some cases more conveniently for actual computation,
where S denotes summation of values of y arrays of x, or throughout the population. Thus
I t is quite possible to determine the correlation between x and z, the deviation of
3
from its probable value, directly.Remembering that [2(yz) - n,px] is the first moment about zero as origin of z for any array, the product moment for the population is
where S denotes summation of the values of the y arrays of x.
from
where S ( x y ) and S ( x 2 ) are the product monients of x and y and the second moment of x for the population.
Practically it is more convenient to determine the product moment
APPLICABILITY OF A CO EFFICIEN T O F CORRELATION 331
EARLIER APPLICATIONS
The method has been most extensively applied to problems of fertility and fecundity. Thus the relationship between the number of ovaries formed and the number of ovaries developing into fruits has been investi- gated in the inflorescence of Staphylea (HARRIS 1909), Celastrus ( HAR-
RIS 1909 b) and Crinum (HARRIS 1912). In Staphylea and Crinum inflorescences which produce larger numbers of flowers mature relatively fewer fruits. I n Celastrus there is apparently no relationship between the number of flowers formed and the capacity of the inflorescence for maturing the ovaries into fruits.
In the fruit, the relationship between the total number of ovules laid down and the deviation of the number of seeds matured from their probable number has been investigated in Sanguinaria (HARRIS I 910 a ) .
For Phmeolus vztlgaris a first study (HARRIS 1913) of 53 series comprising 166,130 pods and a supplemental investigation of 16 series comprising 56,698
pods
(HARRIS 1917 a ) leave no doubt that the pods with the larger number of ovules mature relatively fewer of their ovules into seeds. The same relationship holds in the arborescent legume,Cercis canademis, as is shown by studies based on massed data (HARRIS 1914 a ) and on series from individual trees (HARRIS 1914 b).
The relationship found in Cercis and Phaseolus is not universal for the Leguminosae. In a series of 1427 pods of Robinia (HARRIS 1909 a ) , the pods with larger numbers of ovules mature a relatively higher propor- tion of their ovules into seeds. The correlation between the actual num- ber of ovules formed and the actual number of seeds developing is
ro8 = .693
+-
.009, while that between the number of ovules formed and the deviation of the number of seeds matured from their probable value is rOs = .365.015.
That this result represents a real biological relationship is indicated by the correlations, hitherto unpublished, for the individual trees. Only three of the twelve constants in table I are negative in sign. No one of
these can be regarded as statistically significant when the probable error is taken into consideration, while seven of the nine positive coefficients must be looked upon as statistically trustworthy.
J. A R T H U R H A R R I S 332
TABLE I
Relationship betweeit seed and ovule piumber iia Robirzia
I
Number of ' Number of
tree
1
podsI I22
2 64
3 111
4 I02
5 I22
6 I20
7 I 2 0
9 I 28
I O 78
I 1 105
I 2 196
8 , I59
,478k.049 ,430k.054 ,6712.034
5332.044
.6 14ir ,033
.590% ,040
.2jgZk.O57 .507%.057 .7 142.032 .797C.018 1.16 1.59 6.26 4.77 (-)I.& 4.24 6.73 3.08 (-10.67 13.22
of pistillate flowers increases as the total number of flowers per inflo- rescence increases. In Ficaria the relative number of pistils increases as the total number of sporophylls becomes larger.
Dr. BLAKESLEE and I (1918) have applied this coefficient to the deter- mination of the relationship between the total annual egg production and the monthly egg production o f White Leghorn fowl. W e have there shown by means of this coefficient that the winter months, November, December, January and February, and the following autumn months, August, September and October, show an increase over their theoretical quota of eggs when the annual total egg production rises above the normal. That is, rez, the correlation between total annual egg produc- tion and the deviation of the monthly production from its probable value, is on the whole significantly and substantially positive. The spring and summer months, April, May, June and July, show negative value? of rcz, that is, they make a lower relative contribution to the annual total than might be expected when the total varies in the direction of an in- crease above the normal egg production of the flock as a whole.
F U R T H E R ILLUSTRATIONS
IlZustration I . Proportionality of parts i n Paranzeciwn
A PPL IC ABIL ITY O F A COE FFICIENT OF CORRELATION 333
(a) distance from the anterior end of the organism to the posterior mar- gin of the mouth, ( b ) distance from the posterior margin of the mouth to the posterior end of the organism, and (c) the total length in series of conjugant and non-conjugant Paramecia.
H e has calculated and discussed for a purpose which does not con- cern us here the correlations between certain of these dimensions. All the correlations between the absolute measurements, calculated from his data, are given in table 2 .
TABLE 2
Relationship between total length, 1, and anterior length, a, and between anterior length and posterior length, p , in Paramecium.
"
Lot 7, table 40 Lot 7, table 41 Lot 19, table 51
Lot 19, table 52 Lot 22, table 55
Lot 22, table 56 Lot 24, table 64 Lot 24, table 65
.246f.o50
. 3 8 2 f . o ~ .6712.034 -.403 2.026 .620 +. .025 .570f .047
277f.040 .488?.031
J'352.025 [email protected] .8322 .016
.939f-074 .4852.049 9 6 2.073 &of .or4 .885f.o8g 3.0 7.5 10.4 3.3 4.7 7.1 12.0 7.6
* L o t 7, table 40, conjugants of wild cultures. 2. Lot 7, table 41, non-conjugants
of wild cultiires. 4. Lot 19, table 52,
non-conjugants of race g . 5. Lot 22, table 55, wild culture conjuganits not yet sep- arated. 6. Lot 22, table 56, wild culture conjugants about twelve hours after separa- tion. 7. Lot 24, table 64, unseparated conjugants of race h. 8. Lot 24, table 65, con- jugants of race k about twelve hours after separation.
I n this table the constants for anterior and posterior length are ar- ranged in pairs of conjugants and non-conjugants or ex-conjugants. I n every instance the correlation between the anterior and posterior por- tions of conjugants is lower than that between the same dimensions in
non-conjugants or ex-conjugants.'
All of these values are low, as JENNINGS has noted. In the case of lot 22 the coefficient for the conjugants is actually negative in sign.
The correlation between total length and the length of the section anterior to the mouth is high. I n every case the villue of yZa is higher in non-conjugants or ex-conjugants than in conjugants. The additional relationship to be brought out by the formulae here under discussion is
3. Lot 19, table 51, conjugants of race g.
'See in this connection the discussion by J ~ N N I N C S (1911, pp. 65-66, 71-73),
J. A R T H U R H A RRIS 334
that between the total length of the organism and the relative length of either anterior or posterior element.
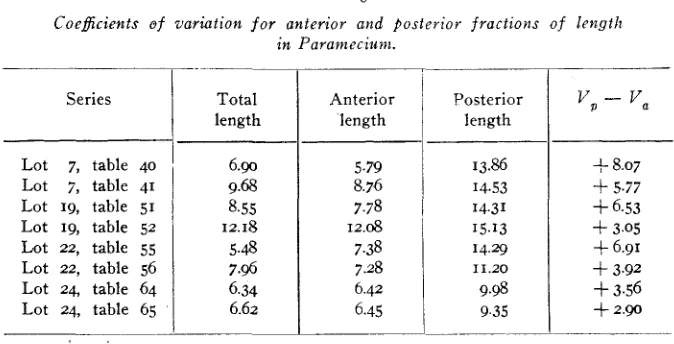
JENNINGS (1911, p. 63) has emphasized the high variability of the post-oral dimension. Table 3, in which all the coefficients of variation
7.38 7.28 6.42 6.45
TABLE 3
Coeficients of variation for anterior and posterior fractions of length
in Paramecium.
14.29 11.20 9.98 9.35 Series
Lot 7, table 40 Lot 7, table 41 Lot 19, table 51 Lot 19, table 52 Lot 22, table 55
Lot 22, table 56 Lot 2 4 table 64 Lot 24, table 65
Total length
6 . 9 9.68 8.55 12.18 5.48 7.96 6.34 6.62
Anterior
'
Posterior length length'YP - v a
f- 8.07
+
5.77+
6.53+
3.05+
6.91+
3.92+
3.56+
2.90are laid side by side, fully confirms his conclusion in this regard. Utiliz- ing these coefficients of variation we obtain the values for the correlation between total length and the deviation of the anterior length from its probable value, given in the fourth column of table 2.
These constants are negative in sign throughout, and while variable in magnitude all may reasonably be considered statistically significant in comparison with their probable errors.
Thus when Paramecium varies in length both anterior and posterior fractions of the body contribute to this variation, but as length in- creases the anterior portion becomes relatively shorter.
For one series, the unseparated conjugants of race k , I have deter- mined the regression of the anterior length on total length and the re- gression of the deviation of the anterior length from its probable value on the total length of the organism. The equations are
a = 3.0359
+
e4977ua: = .7616, Z, = 3.3743 - .I135 1
APPLICABILITY O F A COEFFICIENT O F CORRELATION 335
30 31 32 33 34 35 36
DIAGRAM I.-Relationship of anterior length to total length in Paramecium. Com-
pare diagram 2.
t
-80
Z%/
~enyth25 26 27 28 2 9 t0 3/ 32 33 34 35
36
j. ARTHUR HARRIS 336
Illustration 2. Absence of relationship betwecn size of litter
and s e x
in
swinePARKER and BULLARD ( I 91 3) have discussed the possible relationship
between the size of the litter and sex in the contents of 1000 uteri of swine. From a simple percentage table they state that the relative num- bers of males and females are “even in the extreme cases so nearly uni- form that we may conclude with reasonable assurance that there is no intimate relation between sex and the size of the litters.”
The correlations between the total numbers of pigs in the litter,
I,
and the number of males, iiz, and females, f , may be deduced from their
data. They are
rEm = .6833 t .0114
rlf = .6875 k .0112
From these and the three coefficients of variation one may deduce For males rlz = - .0177 2 .0213
F o r females rfz =
+
.0177 t .0213The correlation is sensibly zero, with regard to its probable error. This method of analysis therefore fully confirms the conclusion drawn
by PARKER and BULLARD.
Illustration 3. Proportion of pistillate and hermaphrodite powers in
the inflorescence of the composite Nonzogyne
LUDWIG (1901) has given data for the correlation between the num- ber of pistillate and the number of hermaphrodite flowers in the inflo- rescence of Homogyne. From his data we deduce
Fo r hermaphrodite flowers, la,
-
h = 31.8333, U, = 7.3981, V , = 23.240
F or pistillate flowers,
p ,
p
= 10.5370, U p = 2.6460,v,
= 25.1 12 For total flowers, f ,f =
42.3704, of = 8.7749,v,
= 20.7099For hermaphrodite and pistillate flowers, For total flowers and hermaphrodite flowers,
For total flowers and pistillate flowers,
T h p = -3899
*
.0449Yjh .9607 & .0049, rfzh = .2429 _+ .0499
APPLICABILITY O F A COEFFICIENT O F CORRELATION 337
I t follows, therefore, that in the larger heads the purely pistillate flow- ers are relatively less, and the hermaphrodite flowers relatively more, numerous.
Illustration 4. Fertility of capsules and viability of seed in.
carnation crosses
STUART (1912) has recorded the number of seeds obtained and the number germinated, planted into the field, and producing flowers in various carnation crosses. Our problem is to determine whether the seeds which come from capsules producing a large number of seeds are relatively more (o r less) viable than those from capsules producing
small numbers.
Using his two larger tables of data, tables 3 and 6,3 and confining at- tention to the relationship between number of seeds per capsule, and the number which germinated, I find
For commercial X commercial, STUART’S table 3, N = 23, For single flower X double flower, STUART’S table 6, N = 32,
The signs are both negative, indicating a relatively higher failure to germinate among the seeds which are produced many in a capsule. With regard to their probable errors, the constants are untrustworthy. Be- cause so few observations are available, no biological significance is at- tached to these two series, which serve merely as another illustration of the kind of problems to which the method may be applied.
Illustration
5.
Relationshp between the total number of pedicels andIn Spiraea Vanhouttei the pedicels of the umbel-like raceme normally produce but a single flower each. An abnormal condition in which one or more pedicels may bear a relatively large number of flowers is fre- quently observed (HARRIS 1917 d ) .
Let x be the total pedicels in an inflorescence and a the number which are abnormal. Then if abnormality be distributed purely at random among the pedicels one would expect material values of rxa. The cor- relation r,, meets our requirements since it shows whether inflorescences with a large number of rays have relatively more or fewer of their rays abnormal than those with a small number.
I n table 6 the cases in which the seeds are not normally developed a r e omitted.
r,, = .775 t .056, rSg = .649 I+ .069,
r,, = -.072 t .141
r,,
= - .118 k .118.J. ARTHUR HARRIS 338
During the last fifty years a great deal has been said about the in- fluence of nutrition, vegetative vigor, etc., upon the development of anomalies. If a larger number of rays indicates greater vigor or better nutrition one might U priori expect larger inflorescences to have a pro-
portionately higher number of branched rays, providing of course, that the classic theories are true.
The constants for a short series of data collected in 1906 were pub- lished in 1909. SinceOthen a large number of determinations have been made on a general sample of inflorescences from a number of shrubs in
1909 and from three large individual shrubs in 1913.
In the latter series the data have been analyzed in two ways. First, the inflorescences which contain at least a single abnormal pedicel have been used as the basis of the correlations. These are designated as the ab- normal inflorescences. Second, the normal inflorescences from the same plants have been included and counted as zero in the distribution of number of abnormal rays.
The results are:
For 1906" r,, =
+
.121 t .os4r,, = - .071 t .034 L
For 1909. Massed statistics. Inflorescences producing some abnor- mal pedicels ( Ar = 785),
Y,, =
+
.I542 2 .0235 Y,, = - .0915 2 .0239For 1909. Massed statistics. All 2040 inflorescences,
r,, =
+
.1584 t .0146r,, = f .Os70 k .OIL@.
For 191 3. Individual plants. Inflorescences producing some abnor- mal pedicels,
Plant I . A- = 747 inflorescences.
r,, =
+
.0880 t .0244 rz2 = - .2846 t .0227Y,, =
+
.I 148 t .0263 r,, =-
.3855 t .0227 Plant 2. AT = 641 inflorescences.APPLICABILITY OF A COEFFI CIEN T OF CORRELATION 339
Plant 3. N = 548 inflorescences.
r , , =
+
. 9 4 1 .0285rxz = - f .0265
Fo r 1913. Individual plants. All inflorescences, Plant I. hr = I 135 inflorescences.
r,, = - .0067 I+ .0200 r,, = - 2 1 2 5 t .01g1
r,,
= - ,0821-+-
.0214r,, =
-
.3681 f .0187rXa = -.0360 rt .0223
r,, = - .2342 rt .0211
F or all t le samples of inflorescences in which there is at least one abnormal pedicel the correlations between the total number of pedicels and the number of normal pedicels is positive in sign and perhaps sta- tistically significant, but low in actual magnitude. Thus the number of abnormal pedicels increases on the average as the total number of pedi- cels per inflorescence becumes larger. T he relationships are, however. very slight indeed.
For these five series the correlation between the total number of pedi- cels and the deviation of the abnormal pedicels from their probable value, is negative in sign. Thus the larger inflorescences have a rela- tively smaller proportion of abnormal pedicels than do those with a smaller total number of pedicels.
In the four series in which the wholly normal inflorescences are in- cluded, the correlations between total number of pedicels and number of abnormal pedicels is positive in 1909 but negative throughout and insig- nificant in magnitude in 1913. The three series from individual shrubs studied in 1913 show low but significantly negative correlations between the total number of pedicels per inflorescence and the deviation of the number of abnormal inflorescences from their probable value. The con- stant for the heterogeneous data of 1909 is positive but insignificant.
Taking the data altogether, there can be no reasonable doubt that the relative number of abnormal pedicels decreases as the total number of abnormal pedicels increases.
This is shown in diagram 3, which represents the regression of the deviation of the number of abnormal rays from their probable value on
Plant 2. N = 975 inflorescences.
Plant 3. N = 912 inflorescences.
J. A R T H U R HARRIS 340
the total number of rays in the series showing the lowest, and in one of these showing the highest, correlation.
c
.5 .o
-R
DIAGRAM 3.-Regression of the deviation of the number of abnormal pedicels from their probable value on the total number of pedicels in Spiraea.
The standard deviations are : For 1909, vz = 2.4691.
For 1913, plant I , uz = 3.0527. The regression equations are :
For 1909, 3 = 1.3186 - . d o 9 x
For 1913, z = 3.5036 - 2 2 1 2 x .
Illtistration 6. Interrelationship of coty1edom.s and pri~nordial leaves in a race of Phaseolus vulgaris highly variable im seedling characters
APPLICABILITY O F A CO EFFICIEN T O F CORRELATION 341 highly differentiated from those developed after growth is resumed as an independent organism.
Those. rare cases in which the number of leaf homologs which are 'laid down during the development of the seed is highly variable seem t o off er especially favorable opportunities for the morphologist t o learn something of the interrelationship of the two forms which may be assumed by homologous organs.
Suitable material fo r such work is furnished by a race of Phaseolus
zuiggaris (HARRIS 1916 b) having a modal number of four cotyledons and four primordial leaves, but highly variable in the number of both of these organs.
The correlations and regression equations are :5
Correlation between number of cotyledons and number of leaves :
c = 3.4759
+
0.0421 1 Less mature series, r = .I I 70 i- .0320.1 = 3.2919
+
0.3252 CC = 3.5128 f 0.0499 1 1 = 3.0039
+
0.4922 Cc = 3.5030
+
0.0464 11 = 3.3565
+
0.4142 c More mature series, r = .1568 -t .0236.Combined series, r = .1386 i- .0193.
The correlations between number of cotyledons and number of pri- mordial leaves indicate slender interrelationships in this newly originated race between characters which are usually thought of as highly cor- related.
Note from the equations that there is on the average a change of .3 to
.5 of a leaf fo r each variation of one cotyledon, but that there is a change of only .04 of a cotyledon for a variation of one leaf.
The results for the combined series are represented graphically in diagram 4. Regression is for each character very nearly linear.
Correlation between total leaf homologs and number of cotyledons :' Less mature series, r = .4328
-+
.0264.c = 2.4595
+
0.1413 h5 T h e plants were graded in a less mature and a more mature series as a precau- tion against recording as primordial leaves those really developed subsequently to the maturation of the seed.
J . ARTHUR HARRIS 342
-7
-6
-5
8
%
9
*
e
-4-3
DIAGRAM 4.-Relationship between number of cotyledons and number of primordial leaves in a tetracotyledonous race of Phaseolus vulgaris.
More mature series, r = .4337 t .019j. Combined seriez, r = .4312 t .0084.
c = 2.6704
+
0.1260 hC 2.5954
+
0.1314 hThe straight line showing the regression of number of cotyledons, c,
on total leaf homologs, h, is shown with the empirical means in dia- gram j.
Correlation between total leaf homologs and number of leaves : Less mature series, r = .9459 t .0034.
APPLICABILITY O F A COEFFICIENT OF CORRELATION 343
4
68
/d /2/4
16’
18344 J. ARTHUR HARRIS
More mature series, r = .9j79
-+
.0020 Combined series, r = .9533 I:.OOIS.I = - 2.6704
+
0.8740 1~I
- 2.5953+
0.8685 kDiagram 5 gives the regression of number of leaves on the number The solid dots representing Correlation between total leaf homologs and the deviation of the of leaf homologs (cotyledons
+
leaves).the empirical mean leaf number lie practically on the theoretical line. number of leaves from their probable value :
Less mature series, r = .6936 k .0226. More mature series, r = .7642 2 .o18;. Combined series, r = .7378 k .0089.
The correlations between total leaf homologs and the deviations of the cotyledons from their probable value are numerically identical with the foregoing but negative in sign.
The results show a high degree of consistency of the two series. These final constants show that when the total number of leaf homologs in- creases, the,variation is due to a far greater extent to the laying down of
a greater number of primordial leaves than to the formation of a larger number of cotyledons. The regression equations for both the deviation of the number of leaves from their probable value ( z I ) and the deviation of the number of cotyledons from their probable value (2,) are given by
gz = .874557 "cc = 2.5954 - 0.3007 h
"cz = - 2.5954
+
0.3007 12and represented in diagram 6. The results are clearly linear.
Illustration 7.
JENKINSON (1912) has given data for total length and length of head for three growth stages in the American rainbow trout. His con- stants are:
Change in proportion of parts in developing trout
Total length, 1
APPLICABILITY O F A C OE FFIC IENT O F CORRELATION 345
/
Zero BarDIAGRAM 6.-Regression of the deviation of the number of cotyledons and of the number of leaves from their probable numbers on the total number of leaf homologs
in Phaseolus. Note that the theoretical lines and the empirical means are identical but opposite in sign.
Whence we deduce:
Stage I , rl, =
+
.649 & .027.Stage 3, rls =
-
.071
rt. o q .
Stage 5 , rlz =-
.534 & .038.336 J. ARTHUR HARRIS
Thus while in each stage the larger individuals have the larger heads, the relationships between the total length of the body and the proportional length of the head changes greatly during development.
Illitstration 8. Relaitionship between total solids and sucrose coiitent
Sucrose content of the juice of the sugar beet has been one of the classic examples of variation in text-hooks on genetics. Xevertheless our knowledge of the problems are, as indicated by a recent review (HARRIS 1917 b), far from complete. Relatively little is known, for example, of the correlation between total solids and sucrose content. Yet this problem is not merely of physiological and genetical interest but of very great practical importance as well, since the coefficient of purity of the juice is an important factor in sugar manufacture.
Table 4 shows the correlation between total solids and sucrose con- tent in 475 Nevada sugar beets. Nominally this series is composed of a number of commercial varieties, but since it has been shown elsewhere (HARRIS and GORTNER 1913) that the correlation between weight and composition of juice is not greatly influenced by the combination of these nominal varieties, such heterogeneity as exists probably does not influ- ence materially the correlations.to be deduced. F o r purposes of compari- son the constants for a series of 61 determinations from Washington are added.
in the juice of sugnr beets
The Nevada series gives: Fo r total solids,
For sucrose,
For total solids and sucrose,
For total solids and deviation of sucrose from its probable value, Mean = 18.021, U = 3.7223, CV = 20.656
Mean = 14.989, U = 4.0727, CV = 27.171
r
= .882 & . m 7rsz=
+
.251 t .029 For the Washington series the results are:Fo r total solids, For sucrose,
For total solids and sucrose,
Mean = 16.445, U = 1.5896, CV == 9.666 Mean = 11.838, U = 1.9098, CV = 16.133
R ( I I I I I I I I I I I I I I I S " " -
I I I I
511 I I 1 1 1 I I I I I H o 5 % N - N H I I I I
J. ARTHUR HARRIS 348
F or total solids and deviation of sucrose from its probable value,
raC = .47I I+ .067
Thus in both cases the correlation between total solids and sucrose is msderately high, as is necessarily the case because of the fact that total solids are to a considerable extent made up of sucrose.
Quantity of sucrose is in both cases more variable than the total amount of solids. The correlation between total solids and the rela- tive amount of sucrose is in both cases positive and of a substantial order of magnitude. Beet juice with higher total solids contains both abso- lutely more and relatively more sugar than that of beets with low total solid content.
Another way of approaching the problem is to calculate the correla- tions between total solids and the coefficient of purity, which is often determined.
Nevada series, Washington series,
rsp = .340 t .027
rsp = .529 t .062
These values are also positive and substantial, but their interpretation involves difficulties due to spurious correlation.
Illtistration 9. Rclationship between total number of spikclets a d number of sterile spikelets in wheat
GRANTHAM and GROFF (1916) have given data for the correlation between the total number of spikelets and the number of sterile spike- lets at the base of the head in varieties of wheat. Let t = total spikelets and s = sterile spikelets. Then from their two tables I find, without applying SHEPPARD'S correction,
Bearded varieties, Beardless varieties,
vi. = .635 t .039, rtg=
+
.164 t .063rtg = .542 t .054, rtzs=
+
.232 s+ .072APPLICABILITY OF A C OE FFIC IENT O F CORRELATION 349
Illustration I O . Via8bility of dominants and recessives in F , generation
F, D ( R ) X D ( R ) , according to Mendelian theory, gives in F, a population with somas 3 D : R. Let there be N individual families in this population and the number of individuals per family be variable. This variation may be due solely t o fluctuations in the number of zygotes produced, or it may be in part attributable to the failure of some of the zygotes to reach maturity. This failure may be random o r differential with respect to the alternative characters involved. If differential, one might expect a correlation between the actual number of individuals per family and the deviation from the probable number of either of the alternative types of individuals which it contains.
I n current Mendelian literature discrepancies between observed and theoretical ratios are often explained as due to selective fertilization or to a lower viability of particular zygotes.
If the latter explanation be correct yZz, the correlation between the
number in the litter and the deviation from their probable frequency of the number which shows a particular character, should have a statistic- ally significant value. As a n illustration of the kind of data to which
this test may be applied, I take YULE’S (1914) table of DARBISHIRE’S (1904) results for albinos in mice families. If the fertilized ovum which is to produce an albino be less capable of development than that which is to develop into a normal individual rl, should take a substantial positive value, i.e., the relative numbers of albino young should be larger in the large litters, since the small litters are assumed t o be small in part be- cause albino-producing fertilized ova are supposed to be less viable.
of Mendelian hybrids
T he actual results are:
-
-
I =
4.5868 a= 1.1322 1.7518 aa= 1.0752Vi = 38.193 V a = 94.963 r z a = .3756
c
.os27rzz = - .0287 t .0612
where
I
= number in litter, U = number of albinos in litter, and x =deviation of number of albinos from their probable value.
3 50 J. ARTHUR HARRIS
RECAPITULATION
In many instances the biologist has to consider the relationship be- tween a measurement and some of its logical subdivisions or components. The first has been called an independent and the second, which is always some fraction of the first, a dependent variable.
For the analysis of such relationships two coefficients are required, the correlation between the variable and the dependent variable and the correlation between the variable and the deviation of the dependent var- iable from its probable value on the assumption that the relative mag- nitude of the dependent variable is independent of the magnitude of the variable.
This paper gives ( a ) the supplementary formulae which are required in certain cases in which the correlation between a variable and the deviation of a dependent variable from its probable value is to be com- puted, and ( b ) a series of illustrations of the applicability of this co- efficient, drawn from a wide range of biological phenomena.
The method has been most extensively applied to the problems of the physiology of seed production in plants. The relationship of the number of ovaries which develop to maturity to the total number of ovaries formed, and the relationship of the number of seeds which mature to the total number of ovules laid down, have been determined in a consid- erable number of plant forms. That it may be useful in the study of the relationship of seed viability to the number of seed formed is shown by analysis of meagre data for carnation crosses.
The formulae have been applied to the problem of sex by an investi- gation of the relative proportion of macrosporophylls and microsporo- phylls in data for Arisarum, Ficaria and Homogyne, and for the rela- tive numbers of males and females in litters of swine.
Under certain conditions the method may be of use in testing the assumption of the existence of a differential viability in Mendelian dominants and recessives.
The usefulness of the method in morphology has been illustrated by its application to the problem of the relationship between total length and anterior length in Paramecium, to that of the relative size of the head in developing trout, to that of the relative frequency of abnormal pedicels in the inflorescence of Spiraea, and to that of the relationship of
APPLICABILITY OF A C OE FFIC IENT O F CORRELATION 351
upon such biological theories as DRIESCH’S annunciation that in a dif- ferentiated system the proportionality of the parts is absolutely inde- pendent of the size of the system.
I n dealing with materials of economic importance, the method has been applied to the problem of the relative proportion of sterile spilce- lets in varieties of wheat with varying numbers of total spikelets per head, to the relationship between total solids and sucrose content in the juice of sugar beets, and has been found of the greatest value in analyz- ing the relationship between the egg production of the individual months and that of the entire year in the domestic fowl.
These illustrations are perhaps sufficient to show that the coefficient has great analytical value, and should have the widest usefulness.
Finally it must be understood that the conclusions drawn from the illustrations given in this paper are not in all cases to be extended be- yond the specific series of data to which the formulae have been applied. The data employed are, in some instances, intended t o illustrate the type of biological problem to which the formulae may be applied when more extensive data are available. No attempt has been made to discuss in detail the biological significance of results of so diverse kinds of illus- trations. Such discussion must be left to the specialist in the particular field in which the observations fall.
LITERATURE CITED
DARBISHIRE, A. D., 1904 On the result of crossing Japanese waltzing with albino mice. Biometrika 3: 1-51.
GRANTHAM, A. E., and GROFF, F., 1916 Occurrence of sterile spikelets in wheat. Jour. Agr. Res. 6 : 235-250.
HARRIS, J. ARTHUR, rgoga The correlation between a variable and the deviation of a dependent variable from its probable value.
xgogb Correlation in the inflorescence of Celastrus scandens. Ann. Rep. MO.
Bot. Gard. 20: 116-122.
r g ~ o a A quantitative study of the morphology of the blood root, Sanguinarm canadense. Biometrika 7 : 305-351.
~ g ~ o b T h e arithmetic of the product moment method of calculating the co- efficient of correlation. Amer. Nat. 44: 693-699.
1912 Biometric data on the inflorescence and fruit of Crinum Zongifolium.
Ann. Rep. MO. Bot. Gard. 23: 75-99.
1913 On the relationship between the number of ovules formed and the capacity of the ovary for maturing its ovules into seeds. Bull. Torr. Bot. Club 40: 447-455.
1g14a On the relationship between the number of ovules formed and the number
of seeds developing in Cercis. Bull. Torr. Bot. Club. 41: 243-256. IgI4b Further observations on the relationship between the number of ovules
formed and the number of seeds developing in Cercis. Bull. Torr. Bot. Biometrika 6 : 436-443.
J. A R T H U R HARRIS 352
HARRIS, J. ARTIEUR, 1916 a On the distribution and correlation of the sexes (staminate and pistillate flowers) in the inflorescence of the aroids Arisaruvz v d g a r e aiid
Arimruju prohoscidiitm.
rgI6b A\ tetracotyledonous race of Phaseolus vulgaris. Mem. N. Y. Bot. Gard.
1917 a Supplementary determinations of the relationship between the number of ovules per pod and fertility in Phaseolus.
1g17b Biometric studies on the somatic and genetic physiology of the sugar beet. Amer. Kat. 5 1 : j07-j12.
1g17c The correlation between a component, and between the sum of two or more components, and the sum of the remaining components of a variable. Quart. Publ. Amer. Stat. Ass. 15: 8j4-859. 61s. 30, 31.
1918a The interrelationship of the number of stamens and pistils in the flowers of Ficaria.
1918 b On the distribution of abnormalities in the inflorescence of Spiraea Vu%-
houttei. Amer. Jour. Bot. 4 : 624-636, diagrams 1-4, pls. 30, 31.
HARRIS, J. ARTHUR, and BLAKESLEE, A. F., with the cooperation of KIRKPATRICK, 14’~. F., 1917 Inter-periodic correlation in the egg production of the do- mestic fowl. Proc. Nat. Acad. Sci. 3 : 565-569, figs. I, z.
HARRIS, J. ARTHUR, and GORTNER, R. A., 1913 On the relationship between the weight of the sugar beet and the composition of its juice. Jour. Ind. Eng. Chem.
1918 The correlation between egg production during the various periods of
JENKINSON, J. W., 1912 Growth, variability and correlation in young trout. Bio-
JENNINGS, H. S., 1911 Assortative mating, variability and inheritance of size in the
LUDWIG, F., 1go1 Variationsstatistische Probleme und Materialien. Biometrika 1 :
PARKER, G. H., and BULLARD, C., 1913 On the size of litters and the numbers of
PEARL, R., 1909 The frequency constants of a variable z = f ( x l , x : ) . Biometrika 6:
STUART, W., 1912 Mendelian inheritance in the carnation. Bull. Vt. Agr. Exp.
YULE, G.
u.,
1914 Fluctuations of sampling in Mendelian ratios. Proc. Cambridge Bull. Torr. Bot. Club 42 : 663-673.6 : 229-244, figs. 1-3.
Genetics 2 : 282-290.
Biol. Bull. 34: 7-17, figs. 1-5.
5 : 192-195.
the year in the domestic fowl.
metrika 8 : 444-455.
conjugation of Paramecium. Jour. Exp. 2061. 11 : 1-134.
I I -29.
nipples in swine. Proc. Amer. Acad. Arts and Sci. 49: 399-426.
437-438.
Sta. 163.
Phil. Soc. 17 : 425-432.