Transactions of the 17th International Conference on Structural Mechanics in Reactor Technology (SMiRT 17)
Prague, Czech Republic, August 17 –22, 2003
Paper # F03-1
Mitigation Method of Thermal Transient Stress
by Thermalhydraulic-Structure Total Analysis
Naoto KASAHARA1) , Masakazu JINBO2) and Hiromi HOSOGAI3)
1) Oarai Engineering Center, Japan Nuclear Cycle Development Institute(JNC), Japan 2) Toshiba Corporation, Japan
3) Joyo Industries Limited, Japan
ABSTRACT
This study proposes a rational evaluation and mitigation method of thermal transient loads in fast reactor components by utilizing relationships among plant system parameters and stresses induced by thermal transients of plants. A thermalhydraulic–structure total analysis procedure helps us to grasp relationship among system parameters and thermal stresses. Furthermore, it enables mitigation of thermal transient loads by adjusting system parameters. In order to overcome huge computations, a thermalhydraulic–structure total analysis code and the Design of Experiments methodology are utilized. The efficiency of the proposed mitigation method is validated through thermal stress evaluation of an intermediate heat exchanger in Japanese demonstration fast reactor.
KEY WORDS:
thermal stress, thermal transient, fluid, structure, total analysis, mitigation, fast reactor, component design, Design of Experiments, Object OrientedINTRODUCTION
Thermal transient stress induced by fluid temperature variation is the main loads in liquid metal fast breeder reactors (LMFBRs). Since LMFBRs have high temperature operative conditions and utilize low heat capacity metals for cooling fluid, its fluid temperature change rapidly according to plant operations. Fluid temperature variations cause thermal stresses with their high thermal conductivities. Fig.1 is a plant system of Japanese demonstration fast breeder reactor (DFBR) [1], which has primary and secondary sodium circuits with water-steam lines. Power variations of core change their temperatures, and those predictions are required to evaluate thermal transient stresses. Here there are many system parameters of plants, which affect thermal transient conditions as in Fig.1. For considering scatter of these parameters, conservative thermal transient loads were assumed for structural design.
Thermal stresses become sometimes so critical in structural design that their rational prediction is highly expected. Precise evaluation, furthermore, leads to mitigations of thermal loads.
B.Decay heat at core +12.2%〜-44%
Prim ary Pum p
A.Delay of trip 0.3Sec〜2Sec
C.Flow coast down tim e 5.5Sec〜7.1Sec
E.Flow rate of pony m otor 13%〜17%
Secondary Pum p
D.Flow coast down tim e 5.5Sec〜7.5Sec
F.Flow rate of pony m otor 7%〜9%
G.SGSupplied water tem perature -3℃〜+3℃
H.SGSupplied water flow rate 22%〜28%
Reactor Vessel
IHX
Steam Generator
Turbine
Fig.1 Example of system parameters of fast reactor plant which affect thermal tansient loads
CONVENTINAL EVALUATION METHOD OF THERMAL TRANSIENTS
Conventional design procedure against thermal transient loads has two independent steps (Fig.2): (1) thermalhydraulic analysis to determine thermal transient conditions and (2) structural analysis to check structural integrity under above conditions. In the first step, there are some difficulties for considering variation of system parameters. There are several parameters and their combination numbers are huge. Furthermore, it is difficult to anticipate an effect of each parameter on thermal stress because there relations are indirect. Therefore, many thermalhydraulic analyses are performed to grasp scatter of fluid temperature from variation of related parameters. For structural analyses of the next step, thermal transient conditions are settled. Here qualitative relationships between fluid temperature and thermal stress are unclear. To consider unclearness of relation with stress and scatter of fluid temperature, design factors are introduced to make conservative thermal transient conditions. Once these conditions are determined, structural design efforts are taken under these given conditions.
Structural analyses Modify
One of satisfied design Strength evaluation Conservative thermal transient
condition
@@
Thermal hy
draulic
Yes
No System parameters
” M— ¬“ ®‰ ð Í
” M— ¬“ ®‰ ð Í
” M— ¬“ ®‰ ð Í
Thermal hydraulic analyses
” M— ¬“ ®‰ ð Í
” M— ¬“ ®‰ ð Í
” M— ¬“ ®‰ ð Í
Thermal hydraulic analyses
@@
Stru
ct
ur
e
Fig.2 Conventional procedure by thermalhydraulic and structure independent analysis
Time (Sec)
Te
mperat
ure (
•)
Thermal hydraulic analysis result (nominal)
Thermal transient condition for structural design
Fig.3 Thermal transient conditions at IHX evaluated by conventional method
NEW EVALUATION METHOD OF THERMAL TRANSIENTS
Optimized design Sensitivity analysis
The maximum stress with a combination of parameters
Modify Parameter adjustment
Sensitivity System parameters
Thermal hydraulic structure total analyses Thermal hydraulic structure
total analyses
Strength evaluation No Yes
Fig.4 New procedure by thermalhydraulic-structure total analysis
The difficulty to realize above procedure is its huge computations. To overcome this problem, authors adopted two ideas. One is a utilization of an integrated analysis code named PARTS (Program for Arbitrary Real Time Simulation) for the simulation of both thermal-mechanical behaviors of structures and plant thermalhydraulic dynamics [2]. This code can analyze both fluid and structural behaviors by linkage of autonomous calculation parts based on object-oriented programs. Calculation time of thermal stress is less than 1/100 of conventional procedures by using Green’s function method. Visual handling of calculation parts was also realized, and it leads to rapid data input. Fig.5 shows graphical user interface of PARTS code. In addition, the reliability of the program was improved by encapsulation. This code can omit data conversion process from a thermal hydraulic code to a structural analysis code and accelerate a turn-around time of calculation.
PARTS-FLO W
PARTS-D S
PARTS-STRESS
C O N TRO L
SIM U LATIO N C O N D ITIO N
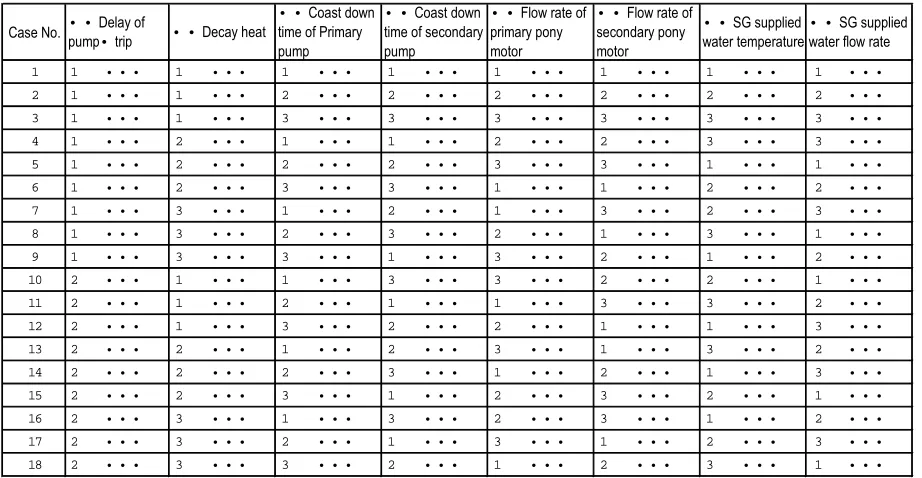
Another devise to overcome computations is the Design of Experiments ([3] for example). It reduces analysis cases that are required to evaluate many combinations of system parameters. For example, the DFBR has 8 system parameters and each parameter have the minimum, nominal and the maximum values as in Table 1. A total combination number of these parameters becomes 4374, however, the Design of Experiments reduces this number to 18 (Table 2) by taking orthogonal groups of a linear system into account [3].
Table 1 System parameters of Japanese DFBR which affect thermal transients at IHX
Level of param eter System param eters
{ ‚ R • NO M
| ‚ R • ‚ fDSG supplied water tem perature
28 “ 25 “
22 “ ‚ gDSG supplied water flow rate
‚ X “ ‚ W “
‚ V “ ‚eDFlow rate of secondary pony m otor
17 “ 15 “
13 “ ‚ dDFlow rate of prim ary pony m otor
7.5Sec 6.5Sec
5.5Sec ‚ cDFlow coast down tim e of secondary pum p
7.1Sec 6.5Sec
5.5Sec ‚ bDFlow coast down tim e of prim ary pum p
{ 12 “ ‚ m‚ n‚ l
| 44 “ ‚ aDDecay heat at core
‚ Q• b 0.3• b
‚ `DDelay of prim ary pum p trip
‚ l‚ `‚w ‚ m‚ n‚ l
‚ l‚h‚ m
Table 2 Orthogonal table of Design of Experiments methodology
Case No.
1 1 • • • 1 • • • 1 • • • 1 • • • 1 • • • 1 • • • 1 • • • 1 • • • 2 1 • • • 1 • • • 2 • • • 2 • • • 2 • • • 2 • • • 2 • • • 2 • • • 3 1 • • • 1 • • • 3 • • • 3 • • • 3 • • • 3 • • • 3 • • • 3 • • • 4 1 • • • 2 • • • 1 • • • 1 • • • 2 • • • 2 • • • 3 • • • 3 • • • 5 1 • • • 2 • • • 2 • • • 2 • • • 3 • • • 3 • • • 1 • • • 1 • • • 6 1 • • • 2 • • • 3 • • • 3 • • • 1 • • • 1 • • • 2 • • • 2 • • • 7 1 • • • 3 • • • 1 • • • 2 • • • 1 • • • 3 • • • 2 • • • 3 • • • 8 1 • • • 3 • • • 2 • • • 3 • • • 2 • • • 1 • • • 3 • • • 1 • • • 9 1 • • • 3 • • • 3 • • • 1 • • • 3 • • • 2 • • • 1 • • • 2 • • • 10 2 • • • 1 • • • 1 • • • 3 • • • 3 • • • 2 • • • 2 • • • 1 • • • 11 2 • • • 1 • • • 2 • • • 1 • • • 1 • • • 3 • • • 3 • • • 2 • • • 12 2 • • • 1 • • • 3 • • • 2 • • • 2 • • • 1 • • • 1 • • • 3 • • • 13 2 • • • 2 • • • 1 • • • 2 • • • 3 • • • 1 • • • 3 • • • 2 • • • 14 2 • • • 2 • • • 2 • • • 3 • • • 1 • • • 2 • • • 1 • • • 3 • • • 15 2 • • • 2 • • • 3 • • • 1 • • • 2 • • • 3 • • • 2 • • • 1 • • • 16 2 • • • 3 • • • 1 • • • 3 • • • 2 • • • 3 • • • 1 • • • 2 • • • 17 2 • • • 3 • • • 2 • • • 1 • • • 3 • • • 1 • • • 2 • • • 3 • • • 18 2 • • • 3 • • • 3 • • • 2 • • • 1 • • • 2 • • • 3 • • • 1 • • •
• •Delay of
pump•trip • •Decay heat
• •Coast down time of Primary pump
• •Coast down time of secondary pump
• •Flow rate of primary pony motor
• •Flow rate of secondary pony motor
• •SG supplied water temperature
APPLICATION TO THE IHX OF JAPANESE DFBR
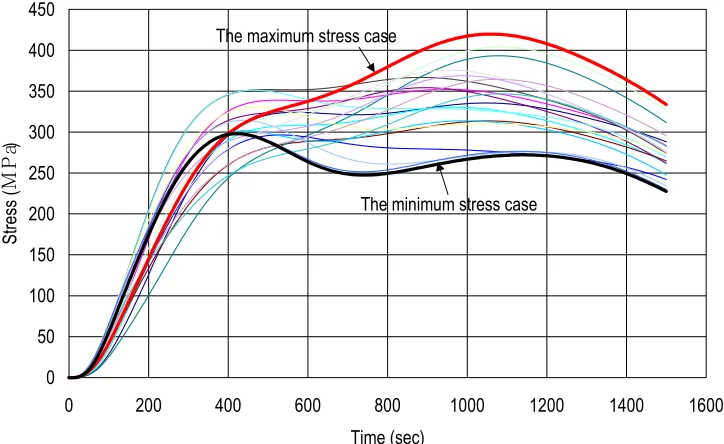
To validate efficiency of the proposed evaluation procedure, it was applied to thermal stress evaluation of the IHX in the Japanese DFBR. The Design of Experiments reduces analysis cases to grasp effects of system parameters to 18 analysis cases of Table 2. The PARTS code calculated fluid temperature and stress histories for these cases as in Fig.6 and Fig.7. Calculated results show that these results scatter according to variations of parameters. By using these results, the Design of Experiments methodology can predict the maximum and the minimun thermal stresses with combinations of parameters among all combinations (4374) like Table3. To confirm thise predictions, parameters of Table 3 were input to PARTS code and were adopted to calculate temperature and stress. The severest casees in Fig.6 and Fig.7 are results that give the maximum stress and the moderatest cases are ones which give the minimun stress. Lower colom of Table 3 compares the maximum and the minimum stresses between predictions from Design of Experiments methodology and calculations by the PARTS code. These results proved that the Desgn by Experiments can adequately predict the maximum and the minimum stresses.
Next, obtained thermal stresses by the new procedure are compared with conventional ones. The predicted maximum stress 420.9MPa was 9% lower than 462.0MPa calculated by the conventional method. Comparison between Fig.3 and Fig.6 can explain that reason. Thermal transient condition settled by the conventional method is over conservative compared with the severest case by the new procedure. It means that the proposed method can rationally evaluate thermal transient conditions and thermal stresses.
Furthermore, let us pay attention to the minimum thermal stress 298.1MPa that is 35% lower than the value by the conventional method. The best combination of system parameters in Table 3 gives this stress. Usually some parameters are uncontrollable, so that, it is difficult to achieve best parameters. Therefore, realistic approach to mitigate thermal stress is proposed here. The Design of Experiments methodology gives the sensitivities of thermal stress to each parameter as in Fig.7. By adjusting controllable and sensitive parameters, thermal loads can be mitigated.
300 350 400 450 500 550 600
0 200 400 600 800 1000 1200 1400 1600
Tine (sec)
Temp
erat
ure
(
℃)
Thermal transient which gives the maximum stress
Thermal transient which gives the minimum stress
0 50 100 150 200 250 300 350 400 450
0 200 400 600 800 1000 1200 1400 1600
Time (sec) St ress ( MP a)
The maximum stress case
The minimum stress case
Fig.7 Thermal stress calculated by PARTS code
Table 3 Maximum and minimum stress with combination of parameters predicted from Design of Experiments methodology
MAX
MIN
H.
SG supplied water flow rate
277.8
Prediction from design by experiment
NOM
MAX
G.
SG supplied water temperature
413.6
298.1
Calculation by PARTS Code
MAX
MIN
F.
Flow rate of secondary pony motor
MIN
MAX
E.
Flow rate of primary pony motor
NOM
MIN
D.
Flow coast down time of secondary pump
MIN
MAX
C.
Flow coast down time of primary pump
MIN
MAX
B.
Decay heat at core
NOM
MIN
A.
Delay of primary pump trip
Max stress
Min stress
MAX
MIN
H.
SG supplied water flow rate
277.8
Prediction from design by experiment
NOM
MAX
G.
SG supplied water temperature
413.6
298.1
Calculation by PARTS Code
MAX
MIN
F.
Flow rate of secondary pony motor
MIN
MAX
E.
Flow rate of primary pony motor
NOM
MIN
D.
Flow coast down time of secondary pump
MIN
MAX
C.
Flow coast down time of primary pump
MIN
MAX
B.
Decay heat at core
NOM
MIN
A.
Delay of primary pump trip
Max stress
Min stress
462.
0
-Evaluation by conventional procedure
-
462.
0
Evaluation by conventional procedure
310 320 330 340 350 360 370 380 390
0 1 2 3 4
Level
St
ress
(
MP
a
)
A.Delay of primary pump trip
B.Decay heat at core
C.Flow coast down time of primary pump
D. Flow coast down time of secondary pump
E.Flow rate of primary pony motor
F. Flow rate of secondary pony motor
G.SG supplied water temperature
H.SG supplied water flow rate
MIN MOM MAX
Fig.7 Sensitivities of thermal stress to system parameters evaluated from Design of Experiments methodology
CONCLUSIONS
A thermalhydraulic – structure total analysis procedure can grasp relationship among system parameters and thermal stresses. It enables rational prediction of thermal loads, because it avoids conservative assumption of thermal transient conditions. Furthermore, adjustment of system parameters, to which thermal stress is sensitive, can mitigate thermal loads.
To validate efficiency of the proposed method, it was applied to thermal stress evaluation of an intermediate heat exchanger in a Japanese demonstration fast reactor. A predicted thermal stress was 9% lower then a value calculated by conventional method. Possibility of thermal loads mitigation by adjusting system parameters was 35%. These results show that a proposed method is quite effective to evaluate rationally and to mitigate thermal transient loads.
ACKNOWLEDGEMENT
The authors are deeply indebted to Mr. Masaaki INOUE of Toshiba Corporation for his contributions to parametric analysis by PARTS code.
REFERENCES
[1] Nakamura,T et al., The development of demonstration fast breeder reactor (DFBR), IAEA,TECDOC-907,pp:59-70,(1995)
[2] Naoto Kasahara and Masaaki Inoue, Object Oriented Design Procedure for Nuclear Components Against Thermal Transient Stress, ASME, PVP-Vol.360, Pressure Vessel and Piping Codes and Standards,(1998)