Optimal Positioning and Sizing of DG Units
Using Differential Evolution Algorithm
Ravi1, Himanshu Sangwan2
Assistant Professor, Department of Electrical Engineering, D C R University of Science & Technology, Murthal,
Sonipat, Haryana, India1
P.G Student, Department of Electrical Engineering, D C R University of Science & Technology, Murthal, Sonipat,
Haryana, India2
ABSTRACT: During the recent years, there has been a significant change in the power industry on power distribution systems mainly because of the introduction of smart-grid technology and the incremental use of distributed generation. Distributed Generation (DG) is simply refers to power generation at the point of consumption by placing smaller generating units, usually ten mega-watts or smaller. The distribution power system is designed generally for radial power flow, but with the onset of DG, bidirectional power flow becomes possible. The presence of DG on the distribution system also creates some potential problems related to safety, reliability, stability and security of the electrical system. DG on a power system affects the power flow, voltages, short circuit currents, losses and also other results. The impact of DG on the system, is whether positive or negative, will depend on the location and the size of the DG used This dissertation focuses on testing various indices relating to this and effective methodologies to find optimal size and placement of the DG unit which helps in reducing voltage deviation and power losses. The test system used here is IEEE 14 bus radial distribution system. The fast and feasible execution for the placement of DG is obtained with the optimization technique as desired. We have used Differential Evolution as Optimization technique; the results of which are compared with already implemented test system using NSGA algorithm. Comparative results show improved voltage profile and reduction in losses.
KEYWORDS: Distribution Generation (DG), Differential Evolution (DE)
I. INTRODUCTION
level. Meta-heuristic algorithms came into existence then, their iteration process made the mitigation of voltage and harmonic deviation. This proposed method is tested on a 14-bus IEEE test system.
II. PROBLEMFORMULATION
The objective of the optimal size and location of DG problem to minimize the total power loss and voltage profile can be expressed as:
(1)
Where;
Where;
= between bus i and bus j line impedance; = between bus i and bus j line resistance;
= between bus i and bus j line reactance; = bus i voltage magnitude;
= bus j voltage magnitude; Constraints:
The objective function in (1) is subjected to the following constraints. (a) Bus voltage limits:
Vimin ≤ Vi ≤ Vimax (2)
Where;
Vimax and Vimin = maximum and minimum voltage limits of ith node respectively.
Vi = voltage at ith node.
(b) Feeder capacity limits:
Power flow in each branch must be less than or equal to its maximum capacity as given below.
|Ii| ≤ Iimax (3)
Where Iimax = maximum current capacity of ith branch.
III. SENSITIVITYANALYSIS
1. Loss Sensitivity Analysis
Sensitivity factor method is worked on the technique in which original non-linear equation is linearized around the initial point of operation, with the help of which solution space is reduced. Capacitor allocation problem is solved mainly using Loss sensitivity method. “Exact Loss” formula is used to provide real power loss in the system. The real power loss sensitivity factor with respect to real power injection is obtained by differentiating exact loss formula w.r.t. real power injection at bus Pi which is given by:
At each bus Sensitivity factors are analyzed, firstly by using the values obtained at base case load flows. To form a priority list decreasing order of the buses according to the sensitivity factor values are arranged. Against injected power, the total power loss gives a parabolic function and when the losses are at minimum, the rate of change of real power loss w.r.t. real power injection becomes zero.
which follows that,
where Pi gives at node i the real power injection, which is provided by subtracting real power demand and real power
generation at that node.
where PDGi represents real power injection from DG present on node i, PDi is the load demand at node i, combining
above equations we get
The above equation determines the size of the DG at which the losses are minimum. By arranging the list in ascending order, the bus stood in the top is ranked as the first location of DG and further the process is repeated by placing the concerned size of DG at that particular location which generates the next location of DG. The process is said to be terminated when it determines the same location.
2. Bus Sensitivity Analysis
Another method for reducing the search space is bus voltage sensitivity analysis. In this case each bus is penetrated at a time. After putting DG at each node its voltage sensitivity index can be calculated by equation. When DG is connected at bus I, voltage sensitivity index for bus i is given by:
where Vk is the voltage at kth node and N is the number of nodes. The node with the least BVSI will be chosen for
DG placement.
IV. DIFFERENTIALEVOLUTION
assure an optimal solution in every case. DE is used for multidimensional real-valued functions but does not use the gradient of the problem being optimized, which means it is not required that the problem has to be differential in case of DE as is needed in classic optimization methods such as gradient descent methods and quasi-newton method. On optimization problems that are not even continuous, are noisy, change over time, etc DE can be used.
In DE, a population of candidate solutions is maintained to optimize a problem and creating new candidate solutions with the help of combining available ones according to its simple formulae, and after that whichever candidate solution will have the best fitness or score on the optimization problem is kept. In this way the optimization problem acts as a black box which only provides a quality measure of provided candidate solution and therefore gradient is not needed.
Storn and Price originally introduced DE. Books are published on practical and theoretical aspects of using DE in parallel computing, multi objective optimization, constrained optimization, and the surveys of application areas are also contained in the books.
V. ALGORITHMFORFINDINGDGSIZINGUSINGDE
The algorithm for DG location and sizing can be given as: Step 1: Run load flow for base case.
Step 2: Find the Bus voltage sensitivity indices at each node using equation
by penetrating DG value at respective node and rank the sensitivities of all nodes in ascending order to form priority list.
Step 3: Select the bus with top 4 highest priorities.
Step 4: input them into differential evolution function and optimize the capacity of generators at all potential buses using objective function defines in equation 1.
Step 5: Change the size of DG in small steps and calculate power loss for each by running load flow. Step 6: Store the size of DG that gives minimum loss.
Step 7: Compare the loss with the previous solution. If loss is less than previous solution, store this new solution and Discard previous solution.
Step 8: Repeat Step 4 to Step 7 for all buses in the priority list.
Step 9: Execute the load flow again for the final PVDG values and plot the comparison results.
VI. RESULTSANDDISCUSSIONS
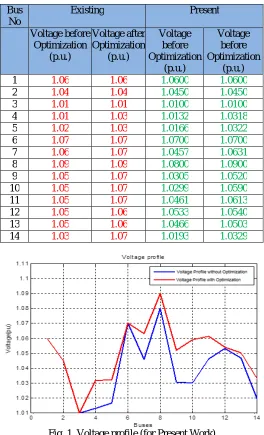
Table I
Results for Voltage profile before and after DG placement
Bus No
Existing Present
Voltage before Optimization
(p.u.)
Voltage after Optimization
(p.u.)
Voltage before Optimization
(p.u.)
Voltage before Optimization
(p.u.)
1 1.06 1.06 1.0600 1.0600
2 1.04 1.04 1.0450 1.0450
3 1.01 1.01 1.0100 1.0100
4 1.01 1.03 1.0132 1.0318
5 1.02 1.03 1.0166 1.0322
6 1.07 1.07 1.0700 1.0700
7 1.06 1.07 1.0457 1.0631
8 1.09 1.09 1.0800 1.0900
9 1.05 1.07 1.0305 1.0520
10 1.05 1.07 1.0299 1.0590
11 1.05 1.07 1.0461 1.0613
12 1.05 1.06 1.0533 1.0540
13 1.05 1.06 1.0466 1.0503
14 1.03 1.07 1.0193 1.0329
Fig. 1. Voltage profile (for Present Work)
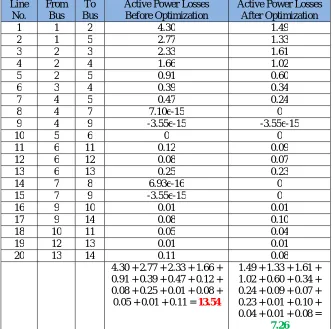
Table II
Losses in the lines between buses in the system
Line No.
From Bus
To Bus
Active Power Losses Before Optimization
Active Power Losses After Optimization
1 1 2 4.30 1.49
2 1 5 2.77 1.33
3 2 3 2.33 1.61
4 2 4 1.66 1.02
5 2 5 0.91 0.60
6 3 4 0.39 0.34
7 4 5 0.47 0.24
8 4 7 7.10e-15 0
9 4 9 -3.55e-15 -3.55e-15
10 5 6 0 0
11 6 11 0.12 0.09
12 6 12 0.08 0.07
13 6 13 0.25 0.23
14 7 8 6.93e-16 0
15 7 9 -3.55e-15 0
16 9 10 0.01 0.01
17 9 14 0.08 0.10
18 10 11 0.05 0.04
19 12 13 0.01 0.01
20 13 14 0.11 0.08
4.30 + 2.77 + 2.33 + 1.66 + 0.91 + 0.39 + 0.47 + 0.12 + 0.08 + 0.25 + 0.01 + 0.08 + 0.05 + 0.01 + 0.11 = 13.54
1.49 + 1.33 + 1.61 + 1.02 + 0.60 + 0.34 + 0.24 + 0.09 + 0.07 + 0.23 + 0.01 + 0.10 + 0.04 + 0.01 + 0.08 =
7.26
At some lines losses are zero and at others losses are higher than in the optimized case. At some lines the difference is more than 3 MW too. Total losses without PVDG placement is 13.54 MW and after the insertion of generators at required buses it is 7.26 MW. A difference of almost 6 MW is visible, which is a great achievement. In actual sensitivity analysis arrange the losses in all buses in the decreasing order and we have picked the top four bus locations for that. These buses are 2, 3, 4 and 5. Results can be improved if generators are placed on all buses, but it will cost of system tremendously as placement at all buses will include cost of installation, generator and maintenance cost too increases.
Work Power Loss % of Loss Reduction Without DG With DG
Existing 13.39 (MW) 8.71 (MW) 34.95
Fig. 2. Total losses (for Present Work)
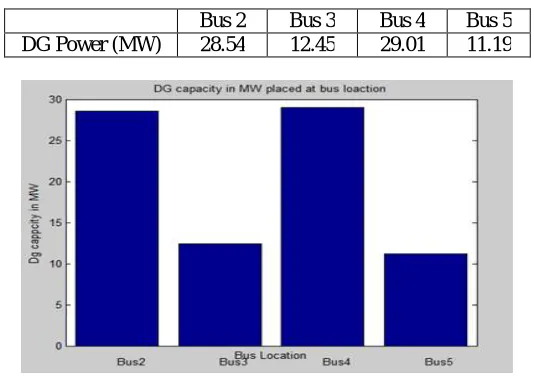
Table III
Potential buses and PVDG values inserted in the system on those buses
Bus 2 Bus 3 Bus 4 Bus 5 DG Power (MW) 28.54 12.45 29.01 11.19
Fig. 2. PVDG capacity placed at 4 higher loss buses
VII. CONCLUSION
This paper deals with that, in order to improve voltage profile and to reduce losses it is necessary to determine the optimal size as well as the location of DG in the system. So we analyze different points which are essential for optimal positioning of DG in our test system with Differential Evolution technique as under:
1. Technical losses are considered so that cost of installation and power losses are reduced.
2. Loss sensitivity method decreases the requirement to put renewable generators on all buses. It gives the exact buses at which losses are highest and DG can be placed on those buses.
REFERENCES
[1] Marko Vukobratovic et al., “Optimal Distributed Generation Placement in Distribution Network” Energycon 2014, May 13-16, 2014.
[2] L.M. Lukianenko et al., “Determination of the Optimal Placement and Capacity of Distributed Generation” IEEE International Conference on Intelligent Energy and Power Systems, 2014.
[3] Ebrahim Babaei et al., “Optimal Placement of DG Units Considering Power Losses Minimization and Voltage Stability Enhancement in Power System” International Journal of Automation and Control Engineering, Volume 3, Issue 1, February 2014.
[4] S.P.Rajaram et al., “Optimal Placement of Distributed Generation for Voltage Stability Improvement and Loss Reduction in Distribution Network” International Journal of Innovative Research in Science, Engineering and Technology, Volume 3, Special Issue 3, March 2014. [5] Deepak Pandey and Jitender Singh Bhadoriya, “Optimal Placement & Sizing Of Distributed Generation (DG) to Minimize Active Power Loss
Using Particle Swarm Optimization” International Journal Of Scientific & Technology Research, Volume 3, Issue 7, July 2014.
[6] Rashmi Priya and Surya Prakash, “Optimal Location and Sizing of Generator in Distributed Generation System” International Journal of Innovative Research in Electrical, Electronics, Instrumentation and Control Engineering, Vol. 2, Issue 3, March 2014.
[7] Maruthi Prasanna et al., “A New Simplified Approach for Optimum Allocation of a Distributed Generation Unit in The Distribution Network for Voltage Improvement and Loss Minimization” International Journal Of Electrical Engineering & Technology, Volume 4, Issue 2, March, 2013.
[8] M. Padma Lalita et al., “Siting & Sizing of Dg for Power Loss & Thd Reduction, Voltage Improvement Using Pso & Sensitivity Analysis” International Journal of Engineering Research and Development, Volume 9, Issue 6 ,December 2013.
[9] Amany M. El-Zonkoly, “Optimal Placement of Multi DG Units Including Different Load Models Using PSO” Smart Grid and Renewable Energy, 2010.
[10] Athira Jayavarma and Tibin Joseph, “Optimal Placement of Solar PV in Distribution System using Particle Swarm Optimization”, International Journal of Advanced Research in Electrical, Electronics and Instrumentation Engineering, Vol. 2, Special Issue 1, December 2013.
[11] S.Ishwarya and P.R. Surya, “ICGICT Allocation of DG for IEEE 33 Bus Systems” International Journal of Innovative Research in Computer and Communication Engineering, Vol.2, Special Issue 1, March 2014.
[12] Subin Sunny and P.Balaji, “The Better Optimization Technique for the Placement of DG in Order to Reduce Overall Cost of Power System” International Journal of Engineering and Advanced Technology, Vol.2, Issue 5, June 2013.
[13] M.Jegadeesan and V.Keerthana, “Optimal Sizing and Placement of Distributed Generation in Radial Distribution Feeder using Analytical Approach” International Journal of Innovative Research in Science, Engineering and Technology, Volume 3, Special Issue 3, March 2014. [14] Azah Mohamed et al., “Optimal DG Placement and Sizing For Voltage Stability Improvement Using Backtracking Search Algorithm”
International Conference on Artificial Intelligence, Energy and Manufacturing Engineering, June 9-10, 2014. [15] K. S. Verma et al., “GA based Optimal Sizing & Placement of Distributed Generation for Loss Minimization” World Academy of Science, Engineering and Technology, Vol. 1, 2007-11-28.
[15] Adnan Anwar and H. R. Pota, “Loss Reduction of Power Distribution Network Using Optimum Size and Location of Distributed Generation” Power and Energy Society General Meeting, IEEE, 2012.
[16] D.Rama Prabha and T. Jayabarathi, “Determining the Optimal Location and Sizing of Distributed Generation Unit using Plant Growth Simulation Algorithm in a Distribution Network” WSEAS Transactions on Systems, Volume 13, 2014.
[17] P.Sobha Rani and Dr. A. Lakshmi Devi, “Optimal Sizing of DG Units using Exact Loss Formula at Optimal Power Factor” International Journal of Engineering Science and Technology, Vol. 4 No.09, September 2012.
[18] Ram Singh et al., “Optimal Placement of DG in Radial Distribution Network for Minimization of Losses” International Journal of Advanced Research in Electrical, Electronics and Instrumentation Engineering, Vol. 1, Issue 2, August 2012.
[19] P.Siva Prasad and Dr. M. Sushama, “Optimal Distributed Generation Placement in Radial Distribution Systems Based on Combined Power Loss Sensitivity Approach” National Conference on Power Distribution, DSD-CPRI, Bangalore, February 6th & 7th 2014.
[20] Sharmistha Sharma et al., “A Load Flow based Approach for Optimum Allocation of Distributed Generation Units in the Distribution Network for Voltage Improvement and Loss Minimization” International Journal of Computer Applications, Volume 50, No.15, July 2012.
[21] Sarin Baby and Neenu Rose Antony, “Optimal DG Placement Considering Voltage Stability Enhancement using PSO” International Conference on Control Communication and Computing, 2013.