Abstract
METZGER, STEFFANIE KRISTINE. Nitrogen Availability from Swine Manure Following Anaerobic Treatment and Storage. (Under the direction of John Classen.)
The purpose of this research was to determine the percentage of nitrogen excreted that
needs to be land applied and the effects of three factors, facility type, geographic location and
lagoon loading concentrations, on the quantity of nitrogen available for land application following
anaerobic treatment and storage. This quantitative research was conducted on data collected
from 1995 - 1997 to determine if a correlation exists between the lagoon inflow nitrogen
concentration and the percentage of nitrogen removed from a lagoon for land application
purposes and the causal-comparativeness of geographic location and facility type on the
percentage of nitrogen removed for land application purposes. Because this thesis was
developed as quantitative research, rather than experimental research, that is, the independent
variables were not manipulated, there does exist a need to be cautious or tenuous in the
conclusions achieved from this study.
The study consisted of 122 facilities in Missouri (107) and Oklahoma (15). The facility
breakdown was 46 Breeding/Gestation/Farrowing and Nursery (B/G/F/N) units, 6
Breeding/Gestation and Farrowing (B/G/F) units, 6 Nursery, 62 Grower/Finisher (G/F) units and 1
each genetic multiplier and Artificial Insemination (AI). Each facility was evaluated for one to
three years depending on the maturity of the lagoon system. Lagoon maturity was defined as
being in operation for a minimum of two (2) years. Information pertaining to the nitrogen
excretion, water use rates, lagoon concentrations and effluent removal rates were determined for
each facility. Following three years of data collection, it was found that the average nitrogen
availability (excluding application losses) of the facilities in this study was between 23% and 52%
versus the MWPS-18 value of 15% - 30% and the AWMFH estimated nitrogen availability of 20%
- 30%. The nitrogen availability is defined as the estimated nitrogen available for irrigation as a
correlation (r = -0.21) between nitrogen availability for land application and the concentration of
nitrogen entering the lagoon without the effects of net rainfall. When the effects of net rainfall are
included in the inflow nitrogen concentrations, the correlation is nearly identical with r = -0.22.
Using the t-test, geographic location was shown to not have a significant effect on the
nitrogen availability for land application. An analysis of variance and Scheffe test was performed
to determine if nitrogen availability differed significantly between facility types. The results show
that facility type does affect the percent of nitrogen available with the B/G/F/N and Nursery,
Nursery and GM and GM and G/F being the only facility combinations that do not significantly
Nitrogen Availability from Swine Manure Following Anaerobic Treatment and Storage
By
Steffanie Kristine Metzger
A thesis submitted to the Graduate Faculty of North Carolina State University
In partial fulfillment of the Requirements for the Degree of
Master of Science
Biological and Agricultural Engineering
Raleigh 2003
APPROVED BY:
_______________________________ _____________________________
Personal Biography
Steffanie Metzger was born June 24, 1973 in Philadelphia. Following graduation in June 1991 from Council Rock High School in Newtown, Pennsylvania she moved to North Carolina to attend North Carolina State University. Originally an Agri-Business major, she began taking classes in the Biological and Agricultural Engineering Department during sophomore year and officially changed majors Fall Semester 1993. Following graduation in May 1995 with a B.S in Biological and Agricultural Engineering, Ms. Metzger began working full time for Agri-Waste Technology, Inc. in Raleigh, N.C.
Acknowledgements
I would like to thank my thesis committee for sticking with me and helping me to finally finish this thesis as the last requirement for my Masters Degree.
Table of Contents
List of Tables ...v
List of Figures ... vii
List of Equations ... viii
Definitions Page... ix
1.0 INTRODUCTION ...1
2.0 THE MANURE MODEL ...3
2.1 Nitrogen Excretion ...3
2.2 Nitrogen Release in Swine Buildings ...4
2.3 Nitrogen Transformation...6
2.4 Lagoon Design and Nitrogen Removal ...6
2.5 Factors Affecting Nitrogen Availability Following Anaerobic Storage ...8
3.0 SCOPE OF THE EVALUATION...10
4.0 PROCEDURES AND PRELIMINARY DATA COLLECTION ...13
4.1 Sample Collection and preservation Procedures ...13
4.2 Rainfall and Evaporation Data...14
5.0 DATA COLLECTION AND ANALYSIS...20
5.1 Water Usage...20
5.2 Nitrogen Excretion ...24
5.3 Lagoon Analysis ...32
5.4 Nitrogen Removal...35
5.5 Nitrogen Availability ...37
6.0 CONCLUSION ...48
8.0 LIST OF REFERENCES ...50
9.0 APPENDICES ...54
Appendix A: Population Dates...55
Appendix B: Water Consumption ...59
Appendix C: Feed Rations and Nutritional Inputs ...65
Appendix D: Lagoon Inflow Concentrations ...67
Appendix E: Lagoon Analysis...73
List of Tables
page
Table 1: Sample Collection and Preservation Details for Effluent or Water...14
Table 2: Missouri Facility Location, Facility Type and First Evaluation Year ...15
Table 3: Oklahoma Facility Location, Facility Type and First Evaluation Year ...16
Table 4: Rainfall Data (inches) for Oklahoma and Missouri ...16
Table 5: May-October PAN, May-October Lake and Annual Lake Evaporation Data (cm) for Oklahoma and Missouri ...18
Table 6: Mean Water Used, Missouri Facilities ...21
Table 7: Mean Water Used, Oklahoma Facilities- Freshwater Recharge Facilities...21
Table 8: Mean Water Used, Oklahoma Facilities- Recycle Recharge Facilities ...22
Table 9: Average Annual Nitrogen Excreted by Facility Type...26
Table 10: Average Annual Nitrogen Excreted by Facility Type (per kg LAW)...27
Table 11: Estimated Inflow Nitrogen Concentrations, Missouri Facilities: Calculated from Annual Water Use and Annual Nitrogen Excretion ...28
Table 12: Estimated Inflow Nitrogen Concentrations, Oklahoma (Freshwater) Facilities: Calculated from Annual Water Use and Annual Nitrogen Excretion ...28
Table 13: Estimated Inflow Nitrogen Concentrations, Oklahoma (Recycle) Facilities: Calculated from Annual Water Use, Annual Nitrogen Excretion and Net Rainfall ...29
Table 14: Estimated Inflow Nitrogen Concentrations, Missouri Facilities: Calculated from Annual Water Use and Annual Nitrogen Excretion ...30
Table 15: Estimated Inflow Nitrogen Concentrations, Oklahoma (Freshwater) Facilities: Calculated from Annual Water Use, Annual Nitrogen Excretion and Net Rainfall ...30
Table 16: Estimated Inflow Nitrogen Concentrations, Oklahoma (Recycle) Facilities: Calculated from Annual Water Use, Annual Nitrogen Excretion and Net Rainfall ...31
Table 17: Average Lagoon Analysis for Missouri Facilities ...32
Table 18: Average Lagoon Analysis for Oklahoma - Freshwater Facilities...32
Table 19: Average Lagoon Analysis for Oklahoma - Recycle Facilities...33
Table 20: Ammonia as a Percent of TKN ...35
Table 21: Lagoon Nitrogen (TKN) Removal (g TKN/Kg LAW-yr), Missouri Facilities ...36
Table 22: Lagoon Nitrogen (TKN) Removal (g TKN/Kg LAW-yr), Oklahoma – Freshwater Facilities ...36
Table 24: Percent of Excreted Nitrogen Removed for Land Application for the Missouri
Facilities...38 Table 25: Percent of Excreted Nitrogen Removed for Land Application for the Oklahoma
Freshwater Facilities...38 Table 26: Percent of Excreted Nitrogen Removed for Land Application for the Oklahoma
List of Figures
page
Figure 1: The Nitrogen Flow from Excretion to Land Application...3
Figure 2: Missouri Annual Rainfall and Annual Lake Evaporation ...18
Figure 3: Oklahoma Annual Rainfall and Annual Lake Evaporation ...19
Figure 4: Missouri Water Use ...22
Figure 5: Oklahoma Freshwater Facilities Water Use ...23
Figure 6: Oklahoma Recycle Facilities Water Use ...23
Figure 7: Inflow Concentrations (Determined by Nitrogen Excreted and Water Used) and Lagoon TKN Concentrations ...34
Figure 8: Scheffe Test Results to Determine if a Significant Difference Exists Between Facility Types for Percentage Nitrogen Available for Land Application...43
Figure 9: Estimated Lagoon TKN Inflow Concentrations (Determined from Nitrogen Excretion and Water Use) and % Nitrogen Available for Land Application...46
List of Equations
page
Equation 1: Urea reaction ...4
Equation 2: Dry Matter Fed (lb TS/hd-day) ...24
Equation 3: Dry Matter Consumed (lb TS/hd-day) ...24
Equation 4: Nitrogen Excretion (lb N/hd-day) ...25
Equation 5: Nitrogen from Waste Feed (lb N-day) ...25
Equation 6: Total Nitrogen Production (lb N-day) ...25
Equation 7: Pearson r Correlation Coefficient ...34
Equation 8: t-test ...39
Equation 9: Sum of Squares ...40
Equation 10: Source of Variance Equation ...41
Equation 11: Sum of Squares Total Equation ...41
Equation 12: Sum of Squares Between Equation ...41
Equation 13: MS calculation ...42
Equation 14: F Calculation ...42
Definitions Page
Ammonia nitrogen: Ammonia Nitrogen (NH3) is one of many nitrogen components of the gas release by the microbiological decay of plant and animal proteins. Ammonia Nitrogen (NH3) is a conversion product of nitrogen compounds, is very soluble in water and volatilizes whenever it comes into contact with open air.
Nitrogen Availability: The estimated nitrogen available for irrigation as a percentage of estimated nitrogen excreted.
Correlational Research: This type of research is a measure of the degree to which variables vary together or a measure of the intensity of the association.
Causal-Comparative Research: Causal-Comparative research is a type of descriptive research that attempts to establish a cause and effect relationship and group comparisons. In this type of research, the independent variable is not manipulated. Also referred to as “ex-post facto” or after the fact, many times this research is conducted after the effect has already occurred without manipulation and the research is to develop a cause.
Endogenous Nitrogen: Endogenous nitrogen is excreted by the digestive tract from the sloughing of intestinal cells and used up digestive enzymes.
Catabolism: The breaking down of complex molecules to release energy; the part of metabolism related to respiration and not contributing to growth.
Mineralization: Mineralization is the microbial conversion of an organic element from an organic to an inorganic state.
Volatilization: The process of ammonia being lost to the atmosphere. This process is not a function of bacterial activity.
Anaerobic Lagoon Storage: Anaerobic lagoons are developed for the storage and treatment of animal waste predominantly by anaerobic (without oxygen) biological action using anaerobic or facultative organisms, for the purpose of reducing organic matter in the waste.
Pan Evaporation: US Class A Pan evaporation is determined by measuring the rate of fall of the level of water in an exposed pan minus the rainfall.
Lake Evaporation: Lake evaporation is defined as the evaporation loss under identical conditions from small natural open water bodies having negligible heat storage. This value is determined based on a proportion of previously determined Pan evaporation of a given area.
Net Rainfall: The net rainfall is the annual rainfall minus the annual evaporation experienced over the surface area of the lagoon.
t-test: The t-test is an inferential statistic used for samples randomly formed without matching. This test is used to determine if the means of two sets of results are significantly different.
Analysis of Variance: The analysis of variance is an arithmetic process for partitioning a total sum of squares into components associated with recognized sources of variation.
1.0 Introduction
Manure generated from livestock facilities in the United States is increasingly being used as a nutrient source for a variety of growing crops (Muck and Steenhuis, 1982). To efficiently utilize the manure and ensure maximum crop use, manure storage is required. Typically, for swine facilities in the U.S., this storage comes in the form of anaerobic lagoons. According to Harper, et al (2000) 75% of swine production systems in North America utilize anaerobic or liquid slurry systems for waste treatment and disposal. Manure storage begins in the buildings. As the manure falls through the slatted floors, it is collected in shallow under floor pits and flushed or released via gravity to the lagoon. Significant ammonia (NH3) loss through volatilization occurs during the storage (both in the buildings and in the lagoons) of the manure, reducing the availability for use as a fertilizer (Kruse et al, 1989, Ryden et al, 1987). Nitrogen losses from anaerobic lagoons have been studied by numerous researchers (Willrich, 1966; Koelliker and Miner, 1973; Smith et al, 1971, Jones et al, 1973; Booram et al, 1975 and Safley, 1980), however, these evaluations resulted in a wide range of reported values dependant on storage designs. For example, Willrich reported that 45% to 50% of the total nitrogen added to a lagoon is lost to the atmosphere during a 30 day period, while Smith et al (1971) suggested that a nitrogen reduction of 57.5% to 65% would result from anaerobic storage with a retention time of 200 days. The results of Koelliker and Miner (1973) agreed with those of Smith in that as much as 65% of nitrogen can be lost to the atmosphere through anaerobic storage. Safley (1980), however, reporting on nitrogen lost during storage of dairy manure suggests that only
approximately 7% is lost during storage, therefore, leaving approximately 93% available for land application. These studies did reach a similar conclusion that ammonia is an extremely volatile compound that is easily lost to the atmosphere.
determining nitrogen losses during the treatment and storage of swine manure is great. Accurately predicting the loss in storage and subsequent availability of nitrogen will allow an operator to more precisely determine the amount of land required to utilize the nitrogen and decrease the risk of over application of nitrogen to the land.
2.0 The Manure Model
The general flow of nitrogen from animal excretion through land application was summarized by Oudendag and Leusink (1998) and shown in Figure 1.
N in manure after excretion.
Emission
N in manure after building storage.
Seepage Loss
Emission
Sludge Accumulation
N in manure after storage.
Emission
Figure 1: The nitrogen flow from excretion to land application.
The above figure gives an overview of the nitrogen flow indicating the locations of ammonia emissions. Ammonia is a conversion product from nitrogen components in animal excreta and volatilizes when it comes in contact with open air (Aarnink et al, 1995). Ammonia can be emitted from animal buildings, storage tanks or lagoons and from land application. The areas of concern of ammonia emission from buildings and lagoons are discussed in further detail throughout this thesis.
2.1 Nitrogen Excretion
Nitrogen excreted as an animal byproduct is typically affected by the amount of dietary nitrogen (protein) consumed by the animal, the efficiency with which the nitrogen is utilized for
BARNS ANIMAL
ANAEROBIC STORAGE
growth, and endogenous nitrogen. Feces and urine contain nitrogenous wastes. Fecal nitrogen is primarily comprised of undigested protein and intestinal secretions. Urinary nitrogen is the end product of the catabolism of amino acids fed in excess of the need of the animal for lean tissue synthesis and for the breakdown of body tissue (Cromwell et al, 1993). It has been estimated that only 30% of nitrogen in feed is retained by the animal. The remaining 70% is excreted either in the form of urine (50%) or feces (20%) (Lenis, 1991).
2.2 Nitrogen Release in Swine Buildings
The animals are housed in confinement buildings on slatted floors, allowing waste to fall through the slats into under floor pits. The volatilization process begins in the buildings. As the feces and urine falls through the slats into the under floor pits, the urine is easily hydrolyzed to form carbon dioxide and ammonia (Equation 1). This breakdown is catalyzed by the urease enzyme, which is produced by microbial organisms (Tillman and Sidue, 1969 and Bremner and Mulvaney, 1978). These microbial organisms are found only in the excreted feces, not urine (Elzing and Swierstra, 1993). While the breakdown of urea is relatively fast, the release of ammonia from feces through anaerobic digestion is a slower process (Wellinger and Kaufmann, 1982).
dioxide
carbon
ammonia
Urea
2
3 2, 2 2 2
+
→
+
→
−
−
CO
NH
NH
CO
N
H
ureaseH O(Eq. 1)
ammonia concentration at the interface between the waste and the air (Srinath and Loehr, 1974). This concentration difference is the driving force for the volatilization. Zhang et al (1993) found that increased temperatures in swine buildings increase the ammonia release from swine pits.
Ammonia emission in the buildings is also influenced by the mode and frequency of removing the accumulated feces and urine from the buildings. As found by Aarnink et al (1995) a reduction of ammonia emission by approximately 20% for a 10 hour period resulted following the removal of pit contents. This is confirmed by a 28% reduction in emissions concluded by
Hoeksma et al (1992) following slurry flushing. However, within a day following the removal, the ammonia emission had regained normal levels, confirming that storage time has only a small influence on ammonia emission (Aarnink et al, 1995). This is particularly true for swine facilities as the urine is the primary contributor to the release of ammonia. The mode of collection of the feces and urine also contributes to the ammonia emissions in the buildings. Flush gutters under slats which flush the manure pit several times a day produced 30% less ammonia emissions than a deep pit storage facility (Oosthoek et al, 1990). Oosthoek et al (1990) also concluded that using “pull plug” with recharge, or a fill and empty principal of removal decreased emissions by 70% over deep pit storage. The pull plug system entails filling the under floor pit with
approximately 12 inches of either fresh or recycled lagoon water; the manure and urine then fall through the slats into the liquid. When the plug is pulled, the slurry flows without much surface turbulence to the lagoon. The lack of turbulence also aids in the reduction of ammonia
emissions.
2.3 Nitrogen Transformation
Nitrogen is present in all animal wastes as organic nitrogen and ammonia nitrogen (inorganic nitrogen). The organic compounds can then be converted to ammonium nitrogen. The ammonium can either be lost to the atmosphere as ammonia or oxidized to nitrate nitrogen. The oxidation of ammonia to nitrate nitrogen is commonly referred to as nitrification. However, in anaerobic conditions, oxygen is void and, therefore, this conversion does not take place, although Harper et al (2001) have suggested that nitrogen gas is released from anaerobic lagoons via chemical denitrification. The primary purpose of anaerobic lagoons is to stabilize and/or destroy organic matter through decomposition. Anaerobic decomposition is the breakdown of organic matter without molecular oxygen (Loehr, 1984). The process of anaerobic decomposition produces gas emissions and a stabilized sludge layer. The production of gas contributes to the mixing of the lagoon to the degree that allows for additional organic material to be involved in the biological process allowing organic compounds to be metabolized and stabilized by
microorganisms consisting primarily of bacteria (Loehr, 1984).
2.4 Lagoon Design and Nitrogen Removal
Agricultural Waste Management Field Handbook (AWMFH) suggests that 70% - 80% (of excreted manure) of the nitrogen is lost during the anaerobic treatment and storage and studies by
McKinney (1977), estimate nitrogen loss during wastewater treatment and storage in lagoons can reach up to 80%. The recommendations of these three sources estimate that only 15% to 30% of excreted nitrogen is available for land application. However, current estimates by Harper, et al (in review) indicate that a greater percent of the nitrogen is available for land application following the anaerobic treatment and storage of manure than originally thought. The new estimates,
determined in North Carolina and the Georgia Coastal Plain region suggest that 56% to 70% of the excreted nitrogen is available for land application.
The potential mechanisms of nitrogen loss from wastewater lagoons as determined by Middlebrooks et al (1983) include:
1.) Volatilization of ammonia to the atmosphere.
2.) Assimilation by the biomass (and subsequent removal from the pond). 3.) Sedimentation (and subsequent sludge removal from the pond). 4.) Biological nitrification and denitrification.
It was originally thought that nitrification and denitrification will not occur in anaerobic conditions (Stevens et al, 1995). However, Harper, et al (in review) measured N2 loss from anaerobic lagoons in North Carolina. Therefore, it is suggested that either a chemical or microbial denitrification does take place in anaerobic lagoons contributing to the total loss of nitrogen. Jones, et al (2000) attempted to explain N2 gas emissions from anaerobic lagoons, including chemical and microbial reactions as well as nitrification and denitrification occurring in anaerobic conditions, with aerobic conditions occurring near the surface to air interface. Sedimentation (sludge accumulation) was estimated by Constable (1988) at only 6% of the total nitrogen
removal at wastewater treatment facilities. It is assumed that the primary mechanism for nitrogen removal is the volatilization of the ammonia from the exposed lagoon surface (Muck and
literature exists regarding the importance of volatilization versus biomass assimilation (Curtis and Mara, 1994), however, the results of Shilton’s (1996) study of ammonia volatilization concludes that volatilization contributes significantly to the overall nitrogen removal in swine lagoons.
2.5 Factors Affecting Nitrogen Availability Following Anaerobic
Storage
Several laboratory studies (Liang et al, 2002, Sievers et al, 2000, Hoeksma et al, McKinney, 1977; Muck and Steenhuis, 1981; Shilton, 1996; Gustafsson, 1987; and Zhang et al, 1993) have been performed over the past years to determine the nitrogen (ammonia) loss from anaerobic storage of animal waste. Although each piece of research concentrated on different aspects (slurry systems, animal type, animal weights, etc) the losses were found to increase with the increase of temperature, wind speed, loading rate and pH. The climate related to geographic locations in which the facility operates should be examined as it affects nitrogen loss. McKinney (1977) concluded that the percentage of nitrogen lost during the storage and treatment of effluent was dependent on pH, lagoon temperature and hydraulic retention time. Additional studies performed by Pano and Middlebrooks (1982) concur with the results of McKinney, siting lagoon temperature, pH and retention time as factors affecting nitrogen or ammonia loss.
Although some studies suggested that hydraulic retention time affects the amount of nitrogen lost (McKinney, 1977) other studies performed by Muck and Steenhuis (1981) conclude that the majority of the nitrogen loss occurs within the first 20 days of storage. Therefore, larger retention times would have little effect on the percentage of nitrogen lost. The retention times of all the lagoons included in the study are greater than 20 days. Muck and Steenhuis (1981) and Shilton (1996) also concluded that the ammonia loss during storage is dependent on the
ammonia concentration entering the storage unit. A higher water intake rate as well as increased rainfall entering the lagoon will result in a more diluted solution with lower ammonia
to the atmosphere in order to develop equilibrium between the waste material and the air. Liang et al (2002) have developed a mathematical model to estimate the ammonia emission based on the two film theory. This theory explains ammonia emission by concluding that the mass transfer between the two films is based on the rate of diffusion between the two films. This model
3.0 Scope of the Evaluation
As indicated previously, there has been much research performed in laboratory settings to determine the nitrogen loss during anaerobic treatment and storage, however, little research has been completed in real (independent farm) settings. The purpose of this project was to collect, analyze and summarize the nitrogen production, water use, lagoon analysis and pumping records of two swine producers to determine the percent of total nitrogen available for land application following anaerobic treatment and storage in actual farm settings. It was anticipated that certain factors contributed greatly to the percentage of excreted nitrogen that would be available for application to crops. The following factors and their potential effect on nitrogen availability were evaluated: geographic location (rainfall and evaporation effects), facility type and lagoon analysis were evaluated as the scope of this project.
The study was developed as causal-comparative research because the independent variables, state, facility type and nitrogen production were not manipulated, as would need to be done in true experimental research. Causal-comparative or ex post facto research is a type of descriptive research that attempts to describe existing conditions by relating a cause to the differences of the test subjects. This research attempted to determine a cause for the difference in the percentages of nitrogen available for land application following anaerobic treatment and storage.
The study consisted of 122 facilities in Missouri (107) and Oklahoma (15). The facility breakdown was 46 Breeding/Gestation/Farrowing and Nursery (B/G/F/N) units, 6
3, etc) or letter (i.e. F, G, H, etc) following the name. The animals at each of the facilities were housed on partially slatted floors that allow the urine and feces to fall through the slats into temporary under floor storage pits. The Missouri facilities used a recycle water flush system to clean their pits. Recycled water from the lagoon system was utilized to flush the contents of the pits several times a day. The flush water and excreta flowed via gravity to the lagoon. The facilities located in Oklahoma were managed using the “pull plug” system. This system differs from the flush system in that the pits were filled with approximately 12 inches of liquid. The urine and feces then fell through the slats into the liquid in the pits. Approximately once a week the contents of the pit were released via gravity into the lagoon. The water used to recharge the pits for the Oklahoma facilities was either recycled lagoon water (Major County and Finish #3) or fresh water (Kingfisher County). Data used in this evaluation was collected during the years of 1995, 1996 and 1997, with the majority of the data occurring in 1997. The nitrogen excreted by the animals was based on site specific rationing determined by each company’s nutritionist. Any nutritional changes throughout the evaluation occurred only as dictated by industry trends.
There were several limitations to the data and assumptions used in analyzing the records. These are stated below:
< Monthly average animal weights were provided by both companies for which an average annual live animal weight (LAW) was calculated. All Oklahoma LAW determinations are based on permitted weights and assumed to be constant.
< The 1996 female inventory for the Missouri facilities has been broken down as follows: 20% gilts, 80% sows (13.8% farrowing, 86.2% gestating).
< The 1996 population inventory included boars for the Missouri facilities. Therefore, the actual LAW and Total Kjeldahl Nitrogen (TKN) estimates include boars.
< The 1996 population inventory for the Missouri facilities included piglets. The calculation of actual LAW includes these animals. However, the TKN estimates combined the piglets with the percentage breakdown of farrowing sows (13.8%) on an average basis. For example, there is an average of 9 piglets per farrowing sow.
LAW, TKN and P estimates do not include these animals.
< The 1997 population inventory for the Missouri facilities did not include piglets. The values calculated for 1996 were used (488 pound LAW for a farrow sow with litter). < Nutritional information (moisture content, % nitrogen, % phosphorus, feed fed) was
provided by each company.
< Nutritional information provided did not include separate Gilt or Boar information. Gilt and Boar nutrition was assumed to be similar to the lactating sow values provided.
< Values for crude protein and N (dry matter basis) have been calculated from the provided percentages and moisture contents.
< Values assumed for crude protein digested, nitrogen retention and waste feed are the same for each of the years of evaluation.
< Nutritional information was converted to a weighted average for nursery and grow-finish animals due to the different growth stages in each category.
< Only sites that were at least two (2) years old at the start of each evaluation year (95,96 and 97) were included in the averages. Population dates for each site are included in Appendix A.
< Lagoon analysis is an average of all samples collected for a lagoon in the given year. < Rainfall and evaporation data were collected from government agencies (National
4.0 Procedures and Preliminary Data Collection
Field personnel employed at each of the companies collected the records and lagoon samples. Procedures for sample collection and preservation were provided to each company by Agri-Waste Technology, Inc. to ensure that the same procedures were being followed in the collection and sampling process. It was assumed all field personnel have followed these procedures. The procedures are described below.
4.1 Sample Collection and Preservation Procedures
Water use rates were collected from reading the flow meter located on the inflow piping prior to entering the building complex. These readings were measured monthly and the days between readings were recorded to determine the gallons per day entering each site.
Lagoon liquid samples were collected in one (1) quart containers marked (prior to sampling) using an indelible marker to indicate sample date and sample ID. Three (3) or four (4) samples were taken from the lagoon at a depth of 0.4 meters - 0.5 meters beneath the lagoon surface on the discharge side (opposite side from inflow pipes) of the lagoon during the
Table 1: Sample Collection and Preservation Details for Effluent or Water
Parameter Container Preservative
TKN Plastic * H2SO4;Cool NH3-N Plastic * H2SO4;Cool NO3-N Plastic * H2SO4;Cool
TS Plastic * Cool
pH Plastic * Cool
P Plastic * HNO3;Cool
K Plastic * HNO3;Cool
* Polyethylene or polypropylene plastic containers with screw top lids were used.
4.2 Rainfall and Evaporation Data
To determine if there was an effect on the nitrogen availability based on the climatic differences of Missouri and Oklahoma the rainfall and evaporation for each of the areas was obtained. These parameters were determined to be the most significant climatic factors in deciphering the differences in lagoon concentrations and the percentage of nitrogen removed from the lagoons each year.
The Oklahoma facilities were located in Kingfisher County and Major County, located NW of Oklahoma City. However, the Hennessey (Kingfisher Co) weather station was the only
facilities under evaluation are located in Mercer, Putnam and Sullivan Counties. Facilities O1, O2 and O3 are located on the border of Mercer and Sullivan Counties, therefore, average rainfall of those two counties was used for calculations for that facility. The facilities for Missouri were grouped into complexes. Each facility consisted of several barns and a lagoon system. Because several facilities were located in the same geographic location they have been given the same name (i.e. “O”, “Wa”, etc) with the facility number or letter following. The name refers to the complex, while the number or letter refers to the specific facility. Tables 2 and 3 indicate the Missouri and Oklahoma facilities found in each county, respectively. These tables also detail the type of facility and the first year evaluated.
Table 2: Missouri Facility Location, Facility Type and First Evaluation Year
County Facility
Type Mercer Putnam Sullivan Mercer/Sullivan
B/G/F/N
19951:
P (1-3), SP (1-6), Wa (1-7), Wi (1-3)
19962:
B (1, 3-7, 8), B Sow, Wo (1-4,
6-7,9)
19973:
TH (1-8, 10, 11, 13, 14)
G/F
1995:
S (L, I, H, F, E)
1996:
DM, S (P, Q, O, S, J, K, R, U, N, V,
W)
1997:
S (M), Hw (1)
1996:
GH (2-5, 7)
1997:
LR (1-3, 5-9) GH(8-11), SM
(1-6), VV (2-10, 14, 18)
B/G/F O (1-3) 1997:
AI
1997:
AI
Nursery B Nur, Sum 1997:
Facility
Total 57 12 35 3
Table 3: Oklahoma Facility Location, Facility Type and Evaluated Years
County
Evaluation Years Kingfisher Major
Genetc Multiplier 19951: GM
B/G/F
19962: Sow2
19973: Sow 1 1997: Sow 3
G/F 1996:1997: Finisher 1 ,2 Finisher 3, 4 1997:1996: Finisher 5, 7 Finisher 6
Nursery 1996:1997: Nur 1 Nur 2 1997: Nur 3, 4
Facility Total 9 6
1 Facilities with a first evaluation year of 1995 have been evaluated for 3 years. 2 Facilities with a first evaluation year of 1996 have been evaluated for 2 years. 3 Facilities with a first evaluation year of 1997 have been evaluated for 1 year.
Rainfall data for each county was obtained from the Missouri Agricultural Statistics Service-Crop and Weather Report. The average annual rainfall data for both Missouri and Oklahoma is displayed in Table 4.
Table 4: Rainfall Data (cm) for Oklahoma and Missouri
Missouri1 Oklahoma2
Year Mercer Putnam Sullivan Average
1995 87.93 111.76 104.57 101.42 98.78
1996 111.18 108.56 95.20 104.98 74.50
1997 93.29 96.06 103.84 97.74 84.25
1
Missouri county rainfall from the Missouri Agricultural Statistics Service. 2
Hennessey, Oklahoma rainfall from the National Climatic Data Center.
to Hennessey. Therefore, the evaporation from Chickasha, Oklahoma was used to complete the water balance for the Oklahoma facilities. Chickasha is located approximately 70 miles
southeast of Hennessey. Missouri evaporation data for each county evaluated is not recorded, therefore, evaporation data from weather stations located in the region (MO-01, Northwest Prairie) were used. Station ID: COOPID 236012 – New Franklin (approximately 140 miles southeast in Howard County) and Station ID: COOPID 237862 – Smithville Lake (approximately 110 miles southwest in Clay County) data, compiled from the National Climatic Data Center, were used to determine evaporation rates for the Missouri sites. The use of the NCDC was the
recommendation of Dr. F. Adnan Akyuz, Missouri State Climatologist.
Table 5: May-October PAN, May-October Lake and Annual Lake Evaporation Data (cm) for
Oklahoma and Missouri
Missouri1 Oklahoma2
Year
Pan3 (0.74 * Pan)Lake 3 Annual Lake Pan3 (0.70 * Pan)Lake 3 Annual Lake1995 84.96 62.87 81.66 129.69 90.78 129.69
1996 84.46 62.48 81.15 138.61 97.03 138.61
1997 92.30 68.30 88.72 123.62 86.54 123.62
1
Missouri MO-01 Region (Northwest Prairie) average PAN evaporation from the National Climatic Data Center.
2
Chickasha, Oklahoma PAN evaporation from the National Climatic Data Center. 3
May-October Evaporation Data.
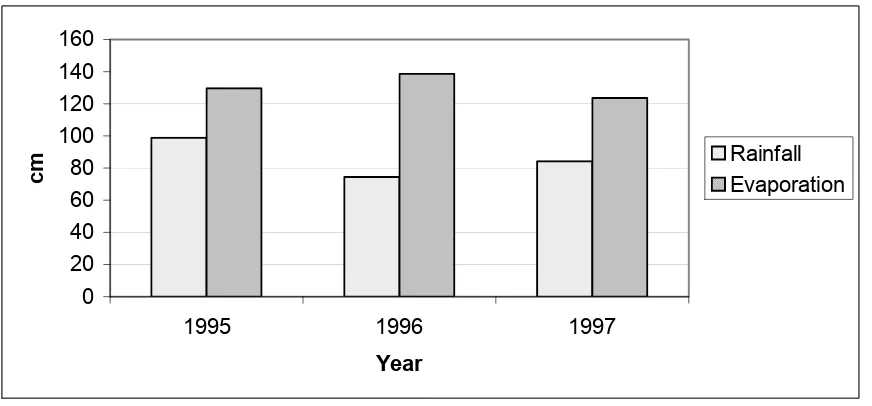
The following bar graphs (Figures 2 and 3) show the differences in annual lake evaporation and rainfall for Missouri and Oklahoma. As can be seen in Figures 2 and 3, the annual rainfall exceeded the annual lake evaporation for Missouri, however, the opposite is true of Oklahoma.
0 20 40 60 80 100 120
1995 1996 1997
Year
cm RainfallEvaporation
0 20 40 60 80 100 120 140 160
1995 1996 1997
Year
cm RainfallEvaporation
Figure 3: Oklahoma Annual Rainfall and Annual Lake Evaporation
5.0 Data Collection and Analysis
The data were collected from the facilities using the procedures presented in Chapter 3.1. Any differences or errors resulting from the collection or the records and preservation of the samples are assumed to be negligible and random.
5.1 Water Use
Flow meters were installed on the inflow pipes to the buildings in order to collect and track the water used by each of the facilities. This water was used to feed and water the animals, clean the buildings upon removal of the animals as well as pre-charge the pits for facilities located in Kingfisher County, Oklahoma (all other facilities pre-charge their pits with recycled lagoon liquid) following the release of waste to the lagoon system. It was assumed that 95% of the water used by the animals was excreted. The cleaning water comes into direct contact with the waste produced and was directed to the lagoon and, therefore, was considered wastewater and
included in the calculations for determining inflow concentrations to the lagoon. The meters were read monthly and calculated to determine the water use rates. The type of waste management system utilized by each facility played an important role in the quantity of water used. The facilities using recycle pit recharge (pull - plug) and recycle flush systems (Missouri) were expected to use less water than those using a freshwater pit recharge. As indicated previously, only facilities that were two (2) years of age or older at the start of the evaluation year were included in the averages. The water consumption rates experienced at the
Breeding/Gestation/Farrowing/Nursery (B/G/F/N), Breeding/Gestation/Farrowing (B/G/F),
Table 6: Mean Water Used, Missouri Facilities
Liter per kg Live Animal Weight per Day
Facility 1995 (std) 1996 (std) 1997 (std) Average (std)
B/G/F/N 0.073 (0.002) 0.124 (0.014) 0.121 (0.025) 0.106 (0.027)
B/G/F - 0.156 (0.019) 0.090 (0.016) 0.123 (0.040)
G/F 0.115 (0.014) 0.080 (0.020) 0.082 (0.016) 0.092 (0.019)
AI - - 0.165 (-) 0.165 (-)
Nursery - - 0.245 (0.033) 0.245 (0.033)
Std: Standard deviation of the mean water use. - : No data was available for this facility type and year.
(-) Only one facility was available for analysis, therefore, no std was calculated.
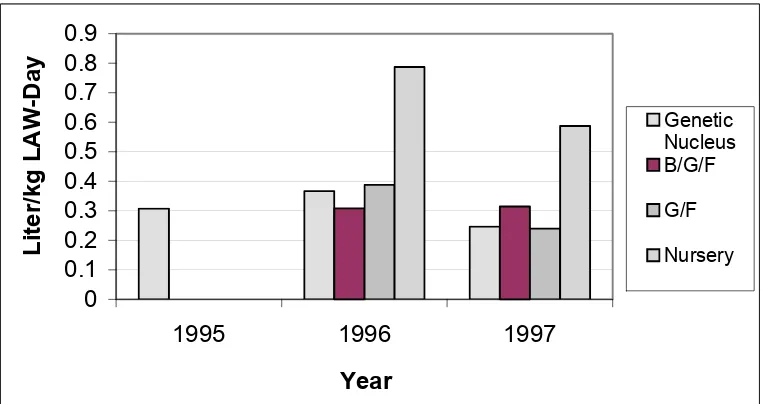
Tables 7 and 8 show the mean water consumption summary for the Oklahoma Facilities. This summary is further broken down to indicate which facilities utilized recycle recharge and which utilize freshwater recharge. The facilities located in Major county (Sow 3, Nur 3 and 4 and Finisher 3, 5 - 7) plus Finisher 3 were recycle pit recharge systems, while the facilities located in Kingfisher county (Sow 1 and 2, Nur 1 and 2, Finisher 1, 2 and 4 and the genetic multiplier) were freshwater recharge. The standard deviation (std) is also included in the summary tables.
Table 7: Mean Water Used, Oklahoma Facilities - Freshwater Recharge
Liter per kg Live Animal Weight per Day
Facility 1995 (std) 1996 (std) 1997 (std) Average (std)
Genetic Multiplier 0.307 (-) 0.367 (-) 0.246 (-) 0.307 (0.061)
B/G/F - 0.308 (-) 0.315 (0.011) 0.311 (0.005)
G/F - 0.388 (0.119) 0.240 (0.095) 0.304 (0.104)
Nursery - 0.787 (-) 0.587 (0.142) 0.612 (0.141)
Std: Standard deviation of the mean water use. - : No data was available for this facility type and year.
Table 8: Mean Water Used, Oklahoma Facilities - Recycle Recharge
Liter per kg LAW per Day
Facility 1995 (std) 1996 (std) 1997 (std) Average (std)
B/G/F - - 0.142 (-) 0.142 (-)
G/F - 0.2511 (-) 0.4979 (0.265) 0.4526 (0.255)
Nursery - - 0.720 (0.024) 0.720 (0.024)
Std: Standard deviation of the mean water use. - : No data was available for this facility type and year.
(-) Only one facility was available for analysis, therefore, no std was calculated.
Figures 4 through 6 compare water use rates for each of the years for the Missouri and Oklahoma facilities.
0
0.05
0.1
0.15
0.2
0.25
0.3
1995
1996
1997
Year
Liter/kg LAW-Day
B/G/F/N
B/G/F
G/F
AI
Nursery
0
0.1
0.2
0.3
0.4
0.5
0.6
0.7
0.8
0.9
1995
1996
1997
Year
Liter/kg LAW-Day
Genetic Nucleus B/G/F G/F NurseryFigure 5: Oklahoma - Freshwater Facilities Water Use
0
0.1
0.2
0.3
0.4
0.5
0.6
0.7
0.8
1996
1997
Year
Liter/kg LAW-Day
B/G/F G/F NurseryFigure 6: Oklahoma - Recycle Facilities Water Use
to level off to a lower rate compared to the first two years of operation.
5.2 Nitrogen Excretion
The nitrogen excreted by the facility was determined based on site-specific nutritional inputs and rations and included in Appendix C. This was chosen as a preferred method to using the waste characteristics developed by the American Society of Agricultural Engineers (ASAE).
The site-specific waste characteristics developed for these facilities were based on information obtained from the nutritionist working with each facility. The nutritionist developed the rations and determined the quantity to be fed to the animals on a daily basis through each stage of development. The crude protein and moisture content as well as the digestibility of the ration were used to determine the quantity of nitrogen expected to be excreted by the animals. An additional factor was included to account for wasted feed. This was to account for any spilled feed as well as any error. The nutrient levels entering the lagoons are dependent upon the amount of the nitrogen the animal retains. The calculations used to determine the nitrogen production are presented in Equations 2 through 6
(
)
DMfed
=
100
−
Feed Moisture Content
100
*
Feed Fed
(Eq. 2)Where:
DMfed = Dry Matter Fed (kg total solids(TS)/head-day). Feed Moisture Content = Moisture content of the feed (%).
Feed Fed = Quantity of feed fed per animal per day (kg/head-day).
(
)
DM consumed
=
100
−
WasteFeed
DMfed
100
*
(Eq. 3)DM consumed = Dry matter consumed by swine (kg TS/head-day).
Waste feed = Percentage of feed expected to be wasted (%).
Dry matter fed = DM fed from Equation 2 (kg TS/head-day).
(
) (
)
N excreted
=
CP
/
100 6 25
/ .
*
DM Consumed
*
1
−
CP digestion
100
(Eq. 4)Where:
N excreted = Nitrogen excreted in the feces and urine (kg N/head-day). CP = Crude protein content of feed (% Dry matter basis).
DM Consumed = Dry matter consumed, calculated from Equation 3 (kg TS/head-day). CP digestion = The estimated digestibility of the crude protein and nitrogen retention (%).
(
)
(
)
N from waste feed
=
CP
/
100 6 25
/ .
*
waste feed
/
100
*
DMfed
(Eq. 5)Where:
N from waste feed = Nitrogen from waste feed fed (kg N/head-day). CP = Crude protein content of feed (% Dry matter basis).
Waste feed = Percentage of feed expected to be wasted (%). Dry matter fed = DM fed from Equation 2 (kg TS/head-day).
(
)
(
)
(
)
Total N excreted
=
#
head
* (
N from waste feed
*
N excreted
)
(Eq.6)Where:
Total N excreted = Total Nitrogen production from a facility (kg N/day). # head = Number of animals (number).
N excreted = Nitrogen excreted in the feces and urine (kg N/head-day).
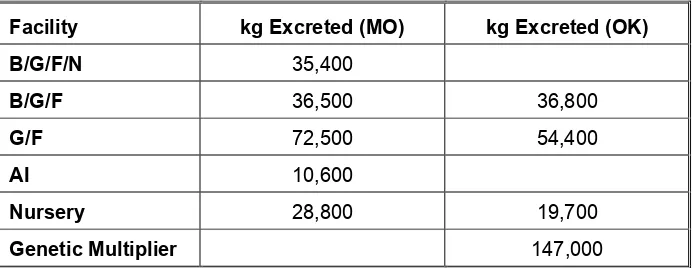
Using the above equations and information provided by the nutritionist, the quantity of nitrogen excreted for each facility was determined. The average annual production is displayed in the table below.
Table 9: Average Annual Nitrogen Excreted by Facility Type
Facility kg Excreted (MO) kg Excreted (OK)
B/G/F/N 35,400
B/G/F 36,500 36,800
G/F 72,500 54,400
AI 10,600
Nursery 28,800 19,700
Genetic Multiplier 147,000
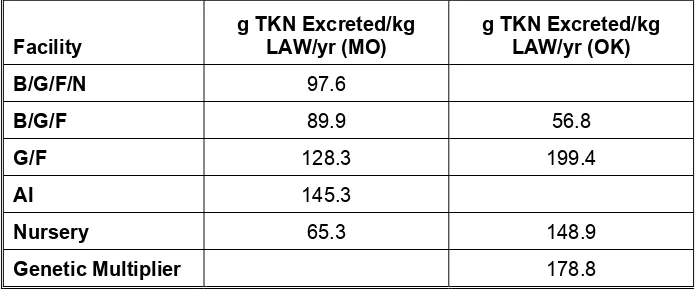
Table 10: Average Annual Nitrogen Excreted by Facility Type (g TKN/kg LAW)
Facility g TKN Excreted/kg LAW/yr (MO) g TKN Excreted/kg LAW/yr (OK)
B/G/F/N 97.6
B/G/F 89.9 56.8
G/F 128.3 199.4
AI 145.3
Nursery 65.3 148.9
Genetic Multiplier 178.8
The quantity of nitrogen excreted per kg of LAW per year is significantly different for the G/F and Nursery facilities located in Oklahoma and those located in Missouri. This can be expected based on the quantity of feed fed to the animals and the digestibility and retention anticipated for those facilities. The G/F facilities in Oklahoma are feeding on average 2.36 kg/head-day with a digestibility and retention estimated at 50%. In contrast, the Missouri facilities are feeding an average of only 2.10 kg/head-day with a digestibility and retention of
approximately 60%. Regarding the Nursery facilities, Missouri is feeding an average of 0.45 kg/head-day with a digestibility and retention of 65% while Oklahoma is feeding an average of 0.77 kg/head-day with an expected digestibility and retention of 55%.
Table 11: Estimated Inflow Nitrogen Concentrations, Missouri Facilities: Calculated from Annual Water Use and Annual Nitrogen Excretion
Facility TKN Concentration (g/m3) (Std)
1995 1996 1997
B/G/F/N 3,370 (122) 2,230 (263) 2,360 (677)
B/G/F - 1,670 (224) 2,710 (544)
G/F 3,510 (427) 5,310 (1,958) 4,660 (1,539)
A/I - - 2,410 (-)
Nur - - 1,550 (210)
Std: Standard deviation of the mean inflow nitrogen concentrations.
- : No data was available for this facility type and year.
(-) Only one facility was available for analysis, therefore, no std was calculated.
Table 12: Estimated Inflow Nitrogen Concentrations, Oklahoma (Freshwater) Facilities: Calculated from Annual Water Use and Annual Nitrogen Excretion
Facility TKN Concentration (g/m3) (Std)
1995 1996 1997
Genetic Multiplier 1,160(-) 960 (-) 1,440 (-)
B/G/F - 470 (-) 490 (35)
G/F - 1,130 (347) 2,400 (707)
Nur - 960 (-) 1,330 (323)
Std: Standard deviation of the mean inflow nitrogen concentrations.
- : No data was available for this facility type and year.
Table 13: Estimated Inflow Nitrogen Concentrations, Oklahoma (Recycle) Facilities: Calculated from Annual Water Use and Annual Nitrogen Excretion
Facility TKN Concentration (g/m3) (Std)
1995 1996 1997
B/G/F - - 1,219 (-)
G/F - 2,030 (-) 2,040 (1,328)
Nur - - 1,050 (45)
Std: Standard deviation of the mean inflow nitrogen concentrations. - : No data was available for this facility type and year.
(-) Only one facility was available for analysis, therefore, no std was calculated.
The nursery facilities utilizing freshwater pit recharge had an average 1997 inflow TKN concentration of 1,330 g TKN/m3 compared with 1,050 g TKN/m3 for the nursery facilities using recycle water for their pit recharge, this is due to the fact that the recycle nursery facilities in 1997 actually utilized more water that the freshwater facilities. The individual concentrations of the G/F facilities were more variable than the averages show. During 1997 G/F #3 (recycle) spiked to 3,990 g TKN/m3 while the remaining freshwater facilities 1997 average was 1,390 g TKN/m3 (Std. 325). The B/G/F inflow concentrations for the Oklahoma facilities showed differences between the freshwater pit recharge and recycle pit recharge facilities. This is very likely due to the fact that the water use rates for Sow #3 (recycle pit recharge) was less than half of that of Sow #1 and Sow #2 although they all have the same nominal populations.
The Missouri facility inflow concentrations were all greater, often times at least double, than the corresponding facilities in Oklahoma. Only the nursery facilities were in the same vicinity (1,550 g/m3 (MO), 1,265 g/m3 (OK average)). This could be due to their nutritional practices and the fact that they use significantly less water per kg of animal weight than the facilities in
Oklahoma.
Table 14: Estimated Inflow Nitrogen Concentrations, Missouri Facilities: Calculated from Annual Water Use, Annual Nitrogen Excretion and Net Rainfall
Facility TKN Concentration (g/m3) (Std)
1995 1996 1997
B/G/F/N 3,200 (116) 1,920 (198) 2,300 (662)
B/G/F - 1,490 (190) 2,560 (517)
G/F 3,380 (400) 4,090 (964) 4,210 (1,404)
A/I - - 2,170 (-)
Nur - - 1,520 (200)
Std: Standard deviation of the mean inflow nitrogen concentrations.
- : No data was available for this facility type and year.
(-) Only one facility was available for analysis, therefore, no std was calculated.
Table 15: Estimated Inflow Nitrogen Concentrations, Oklahoma (Freshwater) Facilities: Calculated from Annual Water Use, Annual Nitrogen Excretion and Net Rainfall
Facility TKN Concentration (g/m3) (Std)
1995 1996 1997
Genetic Multiplier 1,280(-) 1,160 (-) 1,710 (-)
B/G/F - 590 (-) 590 (78)
G/F - 1,530 (685) 3,510 (1218)
Nur - 1,140 (-) 1,570 (463)
Std: Standard deviation of the mean inflow nitrogen concentrations.
- : No data was available for this facility type and year.
Table 16: Estimated Inflow Nitrogen Concentrations, Oklahoma (Recycle) Facilities: Calculated from Annual Water Use, Annual Nitrogen Excretion and Net Rainfall
Facility TKN Concentration (g/m3) (Std)
1995 1996 1997
B/G/F - - 1,930 (-)
G/F - 2,710 (-) 3,460 (3,570)
Nur - - 1,200 (57)
Std: Standard deviation of the mean inflow nitrogen concentrations. - : No data was available for this facility type and year.
(-) Only one facility was available for analysis, therefore, no std was calculated.
5.3 Lagoon Analysis
The lagoon liquid was tested from each primary lagoon a minimum of three (3) times during each of the evaluation years. The main nutrients evaluated for this project are Total Kjeldahl Nitrogen (TKN) and Ammonia Nitrogen (NH3-N). Nitrate Nitrogen (NO3-N) was not included in the evaluation as it is present in negligible quantities in anaerobic lagoons. The lagoon analysis for each facility is detailed in Appendix E.
The average lagoon analysis for the facilities in Missouri and Oklahoma are presented below in Tables 17 through 19, respectively.
Table 17: Average Lagoon Analysis for Missouri Facilities
Nitrogen B/G/F/N B/G/F G/F AI Nur
(g/m3) 1995 1996 1997 1996 1997 1995 1996 1997 1997 1997 TKN 850.6 791.7 894.4 642.8 818.2 1098.6 1485.1 1556.1 634.3 1009.6 NH3-N 750.7 696.7 786.8 566.5 679.3 1012.0 1265.0 1489.7 564.3 877.8
As can be expected, the G/F facilities have the largest concentration of TKN and ammonia in the lagoons. As shown previously, these facilities also have the highest
concentration of nitrogen inflow into the lagoons. However, it should be noted that the nursery facilities also have a high lagoon concentration relative to the quantity of nitrogen excreted as compared to the G/F facilities.
Table 18: Average Lagoon Analysis for Oklahoma - Freshwater facilities
Nitrogen Genetic Multiplier B/G/F G/F Nur
(g/m3) 1995 1996 1997 1996 1997 1996 1997 1996 1997
Table 19: Average Lagoon Analysis for Oklahoma - Recycle facilities
Nitrogen B/G/F G/F Nur
(g/m3) 1997 1996 1997 1997
TKN 676.5 666.0 606.8 557.5
NH3-N 526.3 598.7 501.8 457.7
As with the Missouri facilities, the freshwater G/F facilities experienced the highest lagoon concentrations of TKN. However, for the recycle facilities, the B/G/F facility then showed slightly higher lagoon concentrations. The elevation in lagoon concentration for this facility could be the result of the significantly lower recorded water use. All facilities in Oklahoma experienced a decrease in average nitrogen concentrations from 1996 to 1997. Conversely, the average lagoon nitrogen concentration for all types of Missouri facilities increased from 1996 to 1997. This could be due to an increase in rainfall for the Oklahoma facilities during this period, while on average Missouri experienced a decrease in rainfall. In comparing the lagoon concentrations for Missouri and Oklahoma, it is obvious that the increased inflow concentrations found in the Missouri facilities has carried over to increased lagoon concentrations. Figure 7 details
y = 0.1657x + 552.1
R2 = 0.4691
0 500 1000 1500 2000 2500 3000
0 2000 4000 6000 8000 10000 12000 14000
Inflow Concentrations (g TKN/m3 water)
Lagoon TKN Concentrations (g/m3)
Lagoon TKN Concentratin Linear (Lagoon TKN Concentration)
Figure 7: Inflow Concentrations (Determined by Nitrogen Excreted and Water Used) and Lagoon TKN Concentrations
The Pearson correlation equation was used to determine if a correlation existed between the inflow concentration of a facility and the TKN concentrations found in the lagoon. Using this calculation, a correlation coefficient (r) is calculated to determine the degree to which these parameters are related. The coefficient will be between -1.00 and +1.00. The null hypothesis for this analysis was that no correlation exists between the inflow concentration of a facility and the nitrogen availability. The calculation used to test the null hypothesis is shown below:
(
)
( )
r
XY
X
Y
N
X
X
N
Y
Y
N
=
−
−
−
∑
∑ ∑
∑
2∑
∑
∑
2
2
2
(Eq. 7)
Where:
X and Y = Inflow concentrations and % of nitrogen available, respectively, for each facility. N = Total number of facilities (210).
The degrees of freedom (df) used to determine the tabular r value was N-2 (208). The confidence level chosen was 95%. A strong correlation (r = 0.68) indicating a positive linear relationship was determined to exist between inflow nitrogen concentrations determined using the nitrogen excreted and the water used and nitrogen concentrations found in the lagoon.
Repeating the analysis using the inflow concentrations adjusted for the effects of net rainfall, again a strong positive linear relationship was determined, this time with a slightly lower r value of r = 0.62.
In addition to larger TKN concentrations, the Missouri facilities on average contained a greater ammonia concentration in relation to TKN concentration. This is summarized in Table 20.
Table 20: Ammonia as a Percent of TKN
Missouri Oklahoma Facility Ammonia/TKN Ammonia/TKN
B/G/F/N 88% -
B/G/F 85% 80%
Nur 87% 86%
G/F 91% 85%
AI 89% -
Genetic Multiplier - 83%
5.4 Nitrogen Removal
to accumulation or loss in the lagoon. Appendix F contains the pumping records for the facilities. Table 21 presents the amount of TKN removed from the Missouri facilities. Tables 22 and 23 detail the TKN removed from the Oklahoma facilities.
Table 21: Lagoon Nitrogen (TKN) Removal (g TKN/kg LAW-yr), Missouri Facilities
Facility 1995 1996 1997 Average
B/G/F/N 47.9 36.2 37.1 40.4
B/G/F - 41.2 32.3 36.8
G/F 41.2 47.2 38.3 42.2
A/I - - 32.2 32.2
Nursery - - 55.8 56.8
Table 22:Lagoon Nitrogen (TKN) Removal (g TKN/kg LAW-yr), Oklahoma - Freshwater
Facilities
Facility 1995 1996 1997 Average
Genetic Multiplier 41.1 56.8 29.5 42.5
B/G/F - 19.8 29.2 24.5
G/F - 58.7 45.8 52.2
Nursery - 72.8 131.9 102.4
Table 23:Lagoon Nitrogen (TKN) Removal (g TKN/kg LAW-yr), Oklahoma - Recycle
Facilities
Facility 1996 1997 Average
B/G/F - 26.2 26.2
G/F 44.0 50.2 47.1
Nursery - 77.3 77.3
accumulated in the sludge layer. It was previously suggested that approximately 6% of the nitrogen can be expected to accumulate in the sludge (Constable, 1988). The nitrogen in the sludge although not immediately available for land application, should be expected to be land applied during the life of the lagoon (20 years). An additional factor for nitrogen removal is through lagoon seepage. Although this is expected to have a minimal impact, if measured it would decrease the amount of nitrogen available for land application.
The nursery facilities, regardless of location have the greatest nitrogen removal per kg LAW. Comparing the Missouri and Oklahoma facilities, the TKN removal rates appear to be similar with the exception of the nursery facilities. The Oklahoma nursery facilities on average remove more TKN per kg LAW. This is because the Oklahoma nursery facilities pump two (2) to three (3) times more effluent than the nursery facilities in Missouri. The difference in removal quantities between the freshwater and recycle systems could be the result of maturing of the lagoons rather than manure management type. The first year of evaluation the facilities had a similar average removal rate (72.8 g TKN/kg LAW-yr (freshwater) compared with 77.3 g TKN/kg LAW-yr (recycle)). No correlation was found to exist between the mass of nitrogen applied following anaerobic treatment and storage and the inflow nitrogen concentrations (r = 0.13), However a slight correlation does exist between the lagoon analysis and the mass of nitrogen applied (r = 0.31).
5.5 Nitrogen Availability
Table 24: Percent of Excreted Nitrogen Removed for Land Application for the Missouri
Facilities
(Estimated) kg
Excreted kg Removed % Nitrogen Removed
B/G/F/N 35,400 13,400 39.1
B/G/F 36,500 13,700 40.4
G/F 72,500 22,200 30.8
AI 10,600 2,400 23.0
Nursery 28,800 11,900 40.7
Table 25: Percent of Excreted Nitrogen Removed for Land Application for the Oklahoma
Freshwater Facilities
(Estimated) kg
Excreted kg Removed % Nitrogen Removed
Genetic Multiplier 147,000 48,100 32.8
B/G/F 36,800 19,300 52.4
G/F 54,400 17,600 32.4
Nursery 19,700 7,900 40.3
Table 26: Percent of Excreted Nitrogen Removed for Land Application for the Oklahoma
Recycle Facilities
(Estimated) kg
Excreted kg Removed % Nitrogen Removed
B/G/F 36,800 18,200 49.4
G/F 54,400 17,300 31.9
Table 27: Lagoon Nitrogen Removed – Summary
%Nitrogen Removed
MO Facilities OK-Freshwater Facilities OK-Recycle Facilities
Genetic Multiplier 32.8
B/G/F/N 39.1
B/G/F 40.4 52.4 49.4
G/F 30.8 32.4 31.9
Nursery 40.7 40.3 27.7
AI 23.0
To determine if the differences in the mean nitrogen availability based on geographic location of the facilities was statistically significant the t-test was used. This inferential statistic uses the mean, sums of squares (of the percentage of nitrogen available) and the number of samples to determine significance at the selected level of confidence. For this study, the selected level of confidence is 95%. The equation (Gay, 1996) for the t-test is indicated in equation 8.
t
X
X
ss
ss
n
n
n
n
=
−
+
+ −
+
1 2
1 2
1 2
2
1 21
1
*
(Eq.8)
where;
X1 and X2 are the means of the percentage of nitrogen available determine by the mass of nitrogen excreted and the mass of nitrogen removed for Missouri and Oklahoma (X1 (OK)= 35.56; X2 (MO)= 36.23).
ss1 and ss2 are the sums of squares of the percentage of nitrogen available for Missouri and Oklahoma. The equation to determine the sum of squares is shown in Equation 9.
( )
ss
x
x
n
=
∑
2−
∑
2
(Eq. 9)
The mean percentage of nitrogen available for this calculation was determined using the mass of nitrogen excreted and the mass of nitrogen removed for land application. This calculation did not account for differences such as lagoon design (surface area to volume ratio, lagoon depth, treatment volume), building type and ventilation rates. The null hypothesis for the t-test was that there was no difference in nitrogen availability following anaerobic treatment and storage between facilities located in Missouri and Oklahoma. The results of the calculation (tcal) was t equals 0.17 while the value obtained from the tables (ttable) at a confidence level of 95% is 1.96. Therefore, the null hypothesis is not rejected.
The percent nitrogen removed represents the nitrogen available for application to crop- land. The remaining nitrogen is assumed to either be lost to the atmosphere via ammonia volatilization during lagoon storage or in the buildings, accumulated in the sludge layer still remaining in the lagoon, or lost by lagoon seepage. Because the purpose is to determine the percentage of nitrogen available and not the specific mechanisms for loss, the amount of nitrogen loss through temporary storage in the buildings or through accumulation in the sludge layer is not determined. The nitrogen available for land application is similar among facilities in Oklahoma, regardless of waste management system, except for the nursery facilities. The recycle nursery facilities applied much less nitrogen. The percent available nitrogen is also comparable between the Missouri and Oklahoma facilities, although the B/G/F facilities in Oklahoma experienced greater nitrogen availability than the B/G/F facilities in Missouri.
SS
total=
SS
between+
SS
within (Eq. 10)Where:
SStotal = Total sums of squares of the nitrogen availability (6.76).
SSbetween = Sums of squares of the nitrogen availability attributed to the variable of classification (0.40).
SSwithin = Sums of squares of the nitrogen availability attributed to the values treated alike (6.36).
(
)
SS
X
X
N
total
=
∑
−
∑
2
2 2
(Eq. 11) Where:
SStotal = Total sums of squares of the nitrogen availability (6.76). X= Nitrogen availability.
N = Total number of facilities. (209).
(
) (
)
(
)
SS
X
n
X
n
X
N
between
=
∑
+
∑
+
∑
1
1
2
2
2 2 2
...
(Eq. 12)
Where;
X1, X2, etc = Percentage of nitrogen availability for each facility within a specific facility type. N = Total number of facilities.
n1, n2, etc = Number of facilities within each facility type.
ANOVA and determine the calculated F value. Mean Squares (MS) were calculated for each of the sources of variation (between, within and total).
MS
SS
df
=
(Eq. 13)
F
MS
MS
betweenwithin
=
(Eq. 14)The F value was calculated using the MSbetween (0.10) and the MSwithin (0.03) values. This F value was then compared to the F value obtained from the tables. The F value calculated is 3.24 while the table value using a 95% confidence level was found to be 2.37, therefore we reject the null hypothesis that the facility type does not have an effect on the nitrogen availability following anaerobic treatment and storage. A summary of the ANOVA calculations is shown as Table 28.
Table 28: Completed ANOVA Table for Facility Type
Source of
Variation SS df MS F
between 0.40 4 0.10 3.24
within 6.36 204 0.03
total 6.76 208 0.03
Because the null hypothesis, that facility type does not have an effect on the nitrogen availability following anaerobic treatment and storage, was rejected it is concluded that a variance does exist between facility type. This conclusion only suggests that a difference between facility nitrogen availability does exist. It does not indicate which facilities differ significantly from the others. Therefore a multiple comparison was needed in the form of the Scheffe Test.