Application of Key performance Indicators
(KPI) in a Spring Manufacturing Industry for
leanness Analysis using MCDM Methods
P.Venkateswarlu1, Dr.Dattatraya Sarma2
Research Scholar, Register number :PPE:001, Sub: Production Engineering, Rayalaseema University, Kurnool,
A.P., India1
Principal, Sree Venkateswara College of Engineering, North Rajupalem, Nellore, A.P., India2
ABSTRACT: The proposed works focus on concept of Key Performance Indicators (KPI’s). The aim of this study is
to identify and to give ranking of key indicators of success for the implement of lean manufacturing techniques. The
use of Key Performance Indicators (KPIs) to provide effectiveness of business processes for just in time manufacturing is suggested. These indicators help to guarantee appropriate degree of product quality, execution time and costs of orders. KPI’s allow the re-planning of objectives and the decision-making process to be improved. This paper is an issue for development manufacturing evaluation KPIs relevant to spring manufacturing industry. It suggest to integrate the performance dimension in to a KPI concept. The COPRAS & SAW methods are adopted to investigate alternatives to a system of attributes
KEYWORDS: Lean production, Key Performance Indicators ,COPRAS,SAW.
1.INTRODUCTION
The major business challenges of today’s manufacturing enterprises focus on the management of change. Active management of change is the most significant future requirement for enterprise operation. It means businesses must be ready for change and be adaptable and flexible, striving for continuous improvements.
The key to achieve these goals is the lean manufacturing, which implies to continuously monitor market demand, quickly respond by providing new products, services and information, quickly introduce new technologies and quickly modify business strategies and methods.
Lean Manufacturing has endeavoured to rationalize production by completely eliminating waste in the production process to build quality into the process, reduce costs, create and develop integrated techniques etc., which causes several benefits such as reduction of waste, production cost, manufacturing cycle times, labour, inventory and quality.
The use of key performance indicators (KPI’s) to assess effectiveness of business processes for make-to-order manufacturing. These indicators help to guarantee appropriate degree of product quality, execution time and costs of orders. KPI’s allow the re-planning of objectives and the decision-making process to be improved. The COPRAS & SAW methods have been taken into study, applied for various situations and implemented to investigate alternatives to a system of attributes.
The main characteristics and properties of COPRAS have not been clearly defined and even demonstrated. However, the awareness of these properties allows showing the benefits of the method’s application, to predict the influence of minimizing criteria values on the final result.
II. KEY PERFORMANCE INDICATORS
Neely et. al. [1] regard performance measurement as the quantification of the effectiveness and/or efficiency of an activity over a given time period whereas the essence of performance could be determined as the creation of value with certain provided assets including human, physical and capital resources.
According to Hannula [2] useful measures in industry are always compromises between validity (ability of a measure to measure what it is intended to measure), reliability (consistency of measurement results), relevance (value and usefulness for the users of the measure) and practicality (cost-effectiveness, i.e. is the effort to generate the measures justifiable). In this paper, practicality is seen from the point of view of the constraint of limited resources in a SME as one of the most important criteria for any performance measure during an implementation process of Lean methodologies.
Shinkle et. al. [3] suggest the following Key Lean Manufacturing metrics: delivery performance percent, customer returns (in PPM), first time quality (FTQ) percent, scrap percent, total product cycle time (dock to dock), total product cycle time improvement percent, parts per labour hour, attendance rate, continuous improvement participation percent, etc.
Maskell [4] presents for the value stream performance a collection of measures categorised into strategic, value stream and cell or process measures.
III. METHODOLOGY
A. COMPLEX PROPORTIONAL ASSESSMENT (COPRAS) METHODOLOGY
COPRAS method presumes direct and proportional dependence of significance and priority of investigating alternatives to a system of attributes. The significance of the comparative alternatives is determined on the basis of describing positive and negative characteristics of the alternatives. The COPRAS method is a six stage procedure Stage 1:
Selecting the set of the criteria, describing the alternatives and constructing the decision making matrix Stage 2:
Normalizing criteria
= ∑
Stage 3:
Formulation of weighted normalization table
= ∗
Where i=1,…,͞n and j=1,…,͞m
Qj is significance weight of jth attribute. Stage 4:
Calculation of sum of weighted normalization (S) Sj+ = Ʃ benefit values
Sj- = Ʃ non-benefit values Stage 5:
Calculation of relative weights (Zi)
Zi = Sj+ + [Ʃ Sj- / Sj- Ʃ(1/ Sj-)] (3.1) Stage 6:
Determining the priority order of the alternatives
B. SAW METHOD
which means that the relative order of magnitude of the standardized scores remains equal. Process of consist these steps:
Step 1:
Find the weights of each criteria. Step 2:
Construct a decision matrix (m x n) that includes m process lines and n criteria. Step3:
Calculate the normalized decision matrix.
For positive criteria, = ∗ = 1, … , , = 1, … , (3.2)
And for negative criteria, = = 1, … , = 1, … , (3.3)
r* is a maximum number of r in the column of j Step 4:
Evaluate each alternative, Ai by the following formula
Ai = wj xij
Here xij is the score of the ith alternatives with respect to the jth criteria, wj is the weighted criteria.
IV. CASE STUDY
The case study company is a spring manufacturing unit located in Ananthapur.Now the management wants to implement lean principles to their process line. For find the intial leanness of the process and select the better lean process line two MCDA methods are used. In this study the following five KPIs is considered as criteria and four process lines as alternatives.
1.Manufacturing cycle time(MCT) 2.Ideal time(IT)
3Yield(Yd)
4.Rework/Rejection(Re) 5.Amount of scraps(AS)
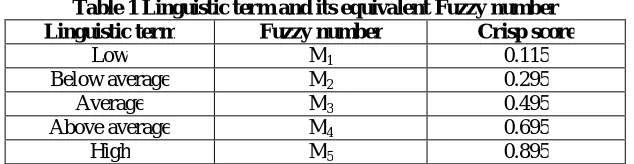
The methods uses a fuzzy scoring approach that is a modification of the fuzzy ranking approaches proposed by jain and chen to find the weights of the criteria.The crisp score of fuzzy number ‘M’is obtained are tabulated in table1.In table 2 the weights of each criteria derived from the plant managers linguistic term.
Table 1 Linguistic term and its equivalent Fuzzy number Linguistic term Fuzzy number Crisp score
Low M1 0.115
Below average M2 0.295
Average M3 0.495
Above average M4 0.695
Table 2 Weight Calculation of Key Performance Indicators Criteria M1 M2 M3
MCT H H H
IT AA A AA
PPL A A BA
Re H H AA
AS A AA A
As mentioned above the 5KPIs are kept as criteria. In this MCT,IT,Re,AS are negative indicating minimum is best and ppl is positive.
Units
MCT Minutes
IT Minutes
PPL No unit
Re Number of units
AS Kg
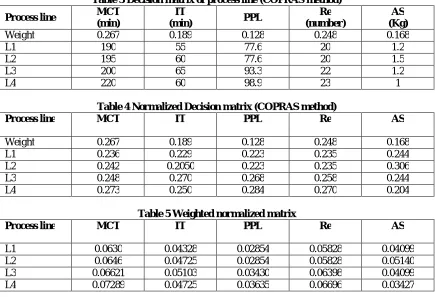
Table 3 to 7, illustrate steps involved in COPRAS method. Utility degree of process lines is ranked in Table 8 and the Ranking of Process line by COPRAS method is shown in Fig. 1.
Table 3 Decision matrix of process line (COPRAS method) Process line MCT
(min)
IT
(min) PPL
Re (number)
AS (Kg)
Weight 0.267 0.189 0.128 0.248 0.168
L1 190 55 77.6 20 1.2
L2 195 60 77.6 20 1.5
L3 200 65 93.3 22 1.2
L4 220 60 98.9 23 1
Table 4 Normalized Decision matrix (COPRAS method)
Process line MCT IT PPL Re AS
Weight 0.267 0.189 0.128 0.248 0.168
L1 0.236 0.229 0.223 0.235 0.244
L2 0.242 0.2050 0.223 0.235 0.306
L3 0.248 0.270 0.268 0.258 0.244
L4 0.273 0.250 0.284 0.270 0.204
Table 5 Weighted normalized matrix
Process line MCT IT PPL Re AS
L1 0.0630 0.04328 0.02854 0.05828 0.04099
L2 0.0646 0.04725 0.02854 0.05828 0.05140
L3 0.06621 0.05103 0.03430 0.06398 0.04099
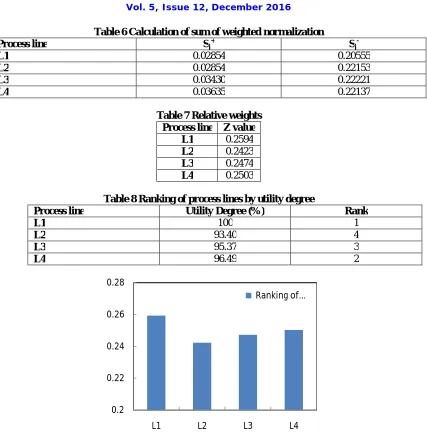
Table 6 Calculation of sum of weighted normalization Process line Sj+ Sj
-L1 0.02854 0.20555
L2 0.02854 0.22153
L3 0.03430 0.22221
L4 0.03635 0.22137
Table 7 Relative weights Process line Z value
L1 0.2594
L2 0.2423
L3 0.2474
L4 0.2503
Table 8 Ranking of process lines by utility degree
Process line Utility Degree (%) Rank
L1 100 1
L2 93.40 4
L3 95.37 3
L4 96.49 2
Fig.1 RANKINGOF PROCESS LINE BY COPRAS METHOD
Table9 and table10 explains the SAW method
Table 9 Weighted normalized matrix (SAW method)
Process line MCT IT PPL Re AS
Weight 0.32 0.16 0.19 0.16 0.14
L1 0.32 0.16 0.1490 0.16 0.1162
L2 0.3117 0.1466 0.1490 0.16 0.09338
L3 0.304 0.1353 0.1792 0.14544 0.11666
L4 0.376 0.1547 0.1900 0.13912 0.14
0.2 0.22 0.24 0.26 0.28
L1 L2 L3 L4
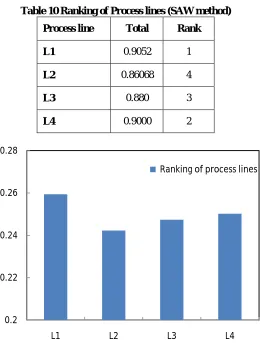
Table 10 Ranking of Process lines (SAW method) Process line Total Rank
L1 0.9052 1
L2 0.86068 4
L3 0.880 3
L4 0.9000 2
FIG. 2 RANKING OF PROCESS LINE BY SAW METHOD
SAW and COPRAS method are compared and ranked as shown in Table 7.11.
Table 11Comparison table for SAW and COPRAS Process Line Rank by SAW Rank by COPRAS
L1 1 1
L2 4 4
L3 3 3
L4 2 2
V. RESULT &CONCLUSIONS
Measuring performance of leanness is difficult, because it has many characteristics and tools. This paper has attempted to benchmarking frame work .From the both SAW ,COPRAS method the out put indicates that the process lineL1 has leaner than other lines.
Practitioners and academics have emphasized the advantage of lean manufacturing .In order to increase the competitive
0.2 0.22 0.24 0.26 0.28
L1 L2 L3 L4
manufacturing industry. Four process lines are considered to illustrate the application capability of this method. This work may be extended by using the other MCDA methods like TOPSIS,VIKOR .
REFERENCES
1. NEELY, A., MILLS, J. PLATTS, K. GREGORY, M. AND RICHARDS, H. “Mapping measures and activities : A practical tool for assessing measurement association systems”. First international conference of the European operations management association. Cambridge .1994.
2.. HANNULA Grewal, S. And Sareen, K. “Development of Model for Lean improvement : A Case Study of Automobile Industry”, Industrial Engineering J0urnal, pp. 24- 27, 2004.
3.SHINKLE,G.GOODING,R&SMITH.M”transforming strategy into success:How to implement lean management system” ,New -york productivity press.2004.