Performance Evaluation of Experimental Digital
Optical Fiber Communication Link
Dr.Shehab A. Kadhim1, Dr.Zeyad A. Saleh2, Asmaa M. Raoof3
Ministry of Science and Technology, Iraq1
Dept. of Physics, Al-Mustansiriya University, Iraq2,3
ABSTRACT:This paper deals with the Basic communication model and the types of fibers for the optical fiber communication system. Some basic concepts have been clarified that will determine the efficiency of the system. In order to evaluate the performance of the digital fiber optic communication system, a number of parameters have been studied by employing two wavelengths (1310,1550) nm: the resulting attenuation from increase the length of fiber for single mode (SM) and multimode (MM) fibers, the bending losses, splices losses and the analysis of Q-factor and bit error rate (BER). Finally, a comparison has been made between three types of transmission channels: copper wires, radio frequency (RF) and optical fibers. Optical fiber was the faster channel to transfer the information.
KEYWORDS:Digital optical fiber link, Micro and macro bending, Splices in optical fiber, BER and Q-factor.
I. INTRODUCTION
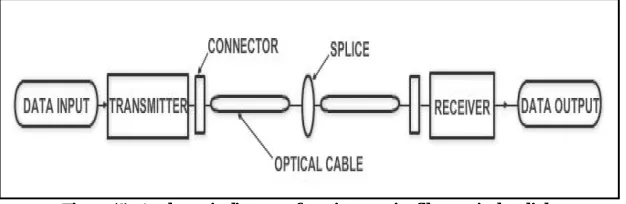
The motivation for developing optical fiber communication systems started with the invention of the laser in the early 1960s, the use of and demand for optical fiber have grown tremendously. The uses of optical fiber today are quite numerous. With the explosion of information traffic due to the Internet, electronic commerce, computer networks, multimedia, voice, data, and video, the need for a transmission medium with the bandwidth capabilities for handling such vast amounts of information is paramount. Fiber optics, with its comparatively infinite bandwidth, has proven to be the solution.[1].A fiber-optic data link consists of three parts: transmitter, optical fiber, and receiver.In addition, it includes any splices or connectors used to join individual optical fiber sections to each other and to the transmitter and receiver.Figure (1) is an illustration of a fiber-optic data-link connection. The transmitter, opticalfiber, and receiver perform the basic functions of the fiber-optic data link. Each part ofthe data link is responsible for the successful transfer of the data signal.
Figure (1): A schematic diagram of a point-to-point fiber-optic data link.
ISSN(Online): 2319-8753 ISSN (Print) : 2347-6710
I
nternational
J
ournal of
I
nnovative
R
esearch in
S
cience,
E
ngineering and
T
echnology
(A High Impact Factor, Monthly, Peer Reviewed Journal) Visit: www.ijirset.com
Vol. 6, Issue 10, October 2017
II. FIBEROPTICCOMMUNICATIONPERFORMANCE
Fiber losses represent limiting factor because they reduce the signal power reaching the receiver . As optical receivers need a certain minimum amount of power for recovering the signal accurately, the transmission distance is inherently limited by fiber losses. However, low-loss fibers are still required since spacing among amplifiers is set by fiber losses [2].
III.OPTICALFIBERATTENUATION
Attenuation represent the one most important characteristics of an optical fiber that determine the information-carrying capacity of a fiber optic communication system [3].The fiber loss is referred to as signal attenuation or simply attenuation, which is an important property of an optical fiber because, together with signal distortion mechanisms, it determines the maximum transmission distance possible between a transmitter and a receiver (or an amplifier) before the signal power needs to be boosted to an appropriate level above the signal noise for high-fidelity reception. The degree of the attenuation depends on the wavelength of the light and on the fiber material [4]. Loss in a system can be expressed as the following [1]:
( ) =− ( )
Where Pin is the input power to the fiber and Pout is the power available at the output of the fiber. Oftentimes, loss in
optical fiber is also expressed in terms of decibels per kilometer (dB/km) [2]:
( / ) =− ( )
Where α is the attenuation coefficient.
The optical fiber can either be a single mode fiber (SM) or a multimode fiber(MM). A multimode fiber is used for short distance purposes; these fibers have high capacity and reliability. The main difference between a single mode fiber and a multimode fiber is that, the multimode fiber has a larger core diameter and also the value of its numerical aperture is large. Hence, the light gathering capacity of the fiber is high. In a multimode fiber the bandwidth distance product is much lower than that of a single mode fiber as the former supports more than one propagation mode. As well as, the
attenuation coefficient (α) for single mode (SM) fiber is lower than multimode fiber (MM) [6].
IV.BENDING LOSS IN OPTICAL FIBER
Scattering and absorptionloss due to the intrinsic characteristics of the optical fiber. As soon as the optical fiber is made, we can face these losses. In addition to these losses when any optical fiber is established inside the system, some losses take place due to environment and improper handling of the optical fiber [7]. Bend loss is a phenomenon which occurs when the optical fiber is bent above the critical bend radius. The bend radius varies for different optical fiber. Reasons for these bend loss are poor cable design, microscopic fiber deformation and tight bends. The bend loss can be of two types. They are: macro-bending loss and micro-bending loss, as illustrated in Figure (2). Macro bend loss occurs when the critical angle is exceeded at high order mode and the light is refracted out of the core into the cladding region. The macro bend loss can be seen with the naked eye and these bends can be rectified up to a certain extent. Micro bend loss is just opposite to the macro bend. Micro bend loss occurs when the pressure is applied on the surface of the fiber and due to the distortion of core cladding interface. The micro bend loss is too small to be seen with the naked eye [8].
(1)
Figure (2): Losses by a- macro-bending, b- micro-bending
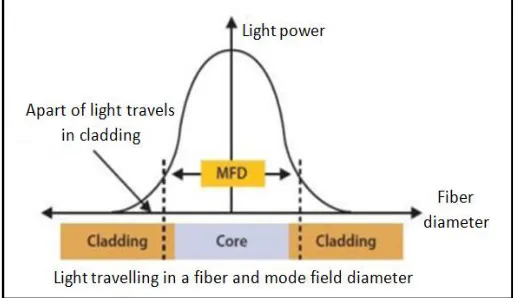
The single most important factor that determines the susceptibility of a fiber to bending that induces loss is the Mode Field Diameter (MFD). MFD represents the area in which the light goes through and includes the core and a part of the cladding. A smaller mode field diameter indicates that light is more tightly confined to the fibercenter and, therefore is less prone to leakage when the fiber is looped. Figure (3) shows the relationship of light power, MFD where diameter of core and the wavelengths are the important parameters in determining the sensitivity of bend loss [9].
Figure (3): The relationship between light and MFD
V. SPLICESLOSS
ISSN(Online): 2319-8753 ISSN (Print) : 2347-6710
I
nternational
J
ournal of
I
nnovative
R
esearch in
S
cience,
E
ngineering and
T
echnology
(A High Impact Factor, Monthly, Peer Reviewed Journal) Visit: www.ijirset.com
Vol. 6, Issue 10, October 2017
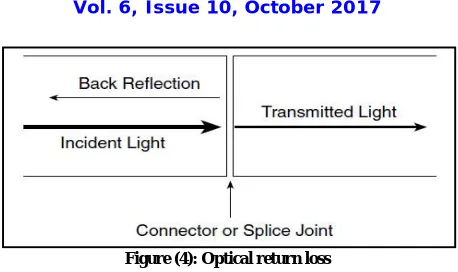
Figure (4): Optical return loss
VI.BITERRORRATEANDQ-FACTOR
In any an optical transmission system, the main purpose is to transfer data from one place to another with the least probability of inaccuracy. One of the main parameters describing the quality of the data link is a bit error rate BER (Bit Error Rate), with BER is possible to compare the quality of different systems for data transmission. But Q-factor characterizes the quality of a digital signal from an analog point. Q-factor and BER are the most important factors that limiting the transmission distance in optical communication systems. In order to transmit signals over long distances, it is necessary to have a low BER and high Q-factor within the fiber. The Q-factor can be used to give an approximate value for the BER, the relationship between Q-factor and the error rate can be expressed as follows[10,11]:
= (
√ )≈ √ (− )
Where erfc is the complementary error function. The Q-factor can be expressed in terms of the electrical signal-to-noise ratio (SNR) by the formula:
= √
Where T is the bit period and Bopt is the bandwidth of the rectangular optical filter, and SNR is a measure used in
science and engineering to quantify how much a signal has been corrupted by noise. It is defined as the ratio of signal power to the noise power corrupting the signal, as the following equation:
SNR= ( I1-I0 )/ I0 (5)
Here I0 and I1 are the means of the low-pass filtered electrical current at the sampling time for the spaces and marks
[12].
VII. RUSTLESANDDISCUSSIONS
The channel is basically a medium which electrically connects the transmitter to the receiver. It may be a pair of wires, a coaxial cable, free space, optical fiber or even a laser beam. The properties of the channel can strongly influence the performance of a communication system. In this research, optical fiber is responsible for data transfer. During the process of transmission and reception, the signal gets distorted due to (i) distortion in the system and (ii) noise introduced in the system. The noise introduced is an unwanted energy, usually of a random character and may be caused by various sources.
The increase in transmission distance caused an increase optical power loss passer through optical fiber in communication system. When employment the wavelength (850nm) to transfer the data from one point to another. The losses was larger than the use of wavelengths 1310nm and 1550nm for the two types of fiber SM and MM, as illustrated in Figure (5). As well as the loss in SM fiber was smaller than the use of MM fiber.
(3)
Figure (5): The losses for three wavelengths versus different link ranges for (a) SM and (b) MM
The following table illustrate that the use of the wavelength (1550) achieved better results for with SM and MM fibers. As well as the employment of SM fiber to transfer the information for long distances is better than the use of MM fiber for the three wavelengths.
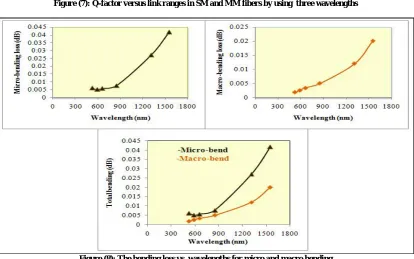
There are two important criteria for evaluating link performance BER, Q-factor. The figures (6) and (7) explain the change in BER and Q-factor values as link ranges change. The following figures showed that the use of the wavelength (1550) achieved better results for with SM and MM fibers. As well as the employment of SM fiber to transfer the information for long distances is better than the use of MM fiber for the three wavelengths.
When we place the fiber inside the system, due to the improper placement of optical fiber, the fiber may deform in the micro scale region. This phenomenon called micro bending loss. Another type of loss takes place inside the optical fiber known the phenomenon of macro-bending loss. Bending losses change with wavelength for the two types of bending, it was observed that with increasing wavelength the bending losses increased. As shown in the Figure (8).
ISSN(Online): 2319-8753 ISSN (Print) : 2347-6710
I
nternational
J
ournal of
I
nnovative
R
esearch in
S
cience,
E
ngineering and
T
echnology
(A High Impact Factor, Monthly, Peer Reviewed Journal) Visit: www.ijirset.com
Vol. 6, Issue 10, October 2017
Figure (7): Q-factor versus link ranges in SM and MM fibers by using three wavelengths
Figure (8): The bending loss vs. wavelengths for micro and macro bending
Figure (9): Change bending loss with increasing number of defects for two wavelengths (1310nm) and (1550nm) in SM and MM fibers
Table (1) and (3) show SNR, Q-factor and BER results for two wavelengths (1310, 1550) nm at using SM and MM fibers.
Table (1): SNR, Q-factor and BER due to micro-bending over SM and MM fibers at using the wavelengths (1310, 1550)nm
SM
λ=1310nm λ=1550nm
No. of defects
SNR Q - factor BER E-16
No. of defects
SNR Q -factor BER E-16
1 63.56 7.9731 7.89 1 65.507 8.094 2.94
2 63.545 7.9715 7.96 2 65.479 8.092 2.98
3 63.525 7.9703 8.04 3 65.471 8.0915 2.99
4 63.5 7.9687 8.18 4 65.463 8.09 3
5 63.41 7.963 8.52 5 65.377 8.085 3.14
MM
λ=1310nm λ=1550nm
No. of defects
SNR Q - factor BER E-17
No. of defects
SNR Q -factor BER E-17
1 69.988 8.366 3.02 1 69.329 8.3263 4.23
2 69.974 8.365 3.046 2 69.219 8.32 4.47
3 69.958 8.364 3.073 3 69.209 8.3189 4.49
4 69.936 8.3627 3.11 4 69.193 8.3181 4.53
ISSN(Online): 2319-8753 ISSN (Print) : 2347-6710
I
nternational
J
ournal of
I
nnovative
R
esearch in
S
cience,
E
ngineering and
T
echnology
(A High Impact Factor, Monthly, Peer Reviewed Journal) Visit: www.ijirset.com
Vol. 6, Issue 10, October 2017
Table (2): SNR, Q-factor and BER due to macro-bending over SM and MM fibers at using the wavelengths (1310, 1550)nm
SM
λ=1310nm λ=1550nm
No. of defects
SNR Q -factor BER E-16
No. of defects
SNR Q - factor BER E-16
1 63.701 7.9994 7.35 1 65.62 8.101 2.77
2 63.681 7.985 7.43 2 65.615 8.1 2.78
3 63.671 7.98 7.46 3 65.601 8.09937 2.803
4 63.651 7.9783 7.54 4 65.591 8.0985 2.82
5 63.621 7.9762 7.66 5 65.577 8.0976 2.84
MM
λ=1310nm λ=1550nm
No. of defects
SNR Q -factor BER E-17
No. of defects
SNR Q - factor BER E-17
1 70.819 8.4156 1.99 1 69.988 8.366 3.02
2 70.809 8.4143 2 2 69.965 8.3645 3.06
3 70.785 8.414 2.02 3 69.937 8.3628 3.11
4 70.775 8.413 2.03 4 69.898 8.3605 3.17
5 70.752 8.4114 2.05 5 69.889 8.36 3.18
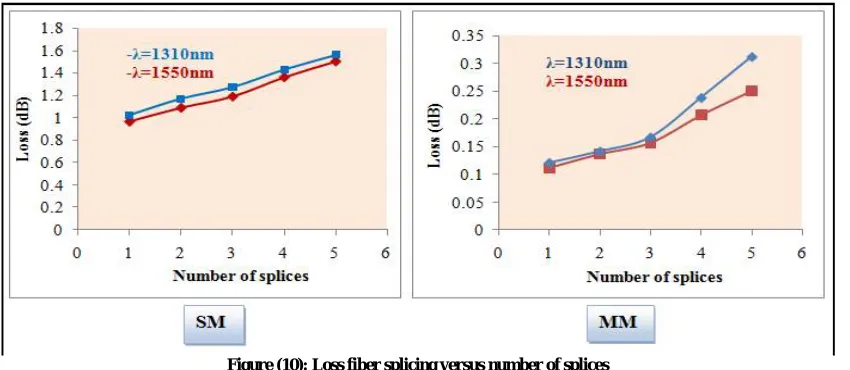
Low-loss fiber splicing results from proper fiber end preparation and alignment.In order to know the impact of the splices between the fiber optic and losses caused by them, a study was conducted by employing two wavelengths (1310nm) and (1550nm) in single mode and multimode fibers. As illustrated in the Figure (10).
Figure (10): Loss fiber splicing versus number of splices
Table (3): SNR, Q-factor and BER due to the splicing in SM and MM fibers at using the wavelengths (1310, 1550) nm.
SM
λ=1310nm λ=1550nm
No. of Splices
SNR Q - factor BER E-16
No. of defects
SNR Q - factor BER E-16
1 63.5 7.9678 8.179 1 64.7835 8.049 4.244
2 63.32 7.9643 8.432 2 64.6535 8.041 4.533
3 63.3 7.959 8.81 3 64.63 8.0394 4.589
4 63.1 7.95 9.5 4 64.51 8.032 4.877
5 63.0414 7.94 10.3 5 64.431 8.027 5.07
MM
λ=1310nm λ=1550nm
No. of Splices
SNR Q - factor BER E-17
No. of defects
SNR Q -
factor
BER E-17
1 71.2414 8.441 1.6 1 70.3 8.382 2.64
2 71.21 8.4385 1.63 2 70.22 8.3798 2.69
3 71.183 8.437 1.65 3 70.198 8.3785 2.72
4 71.1 8.435 1.72 4 70.146 8.3771 2.79
5 71.023 8.427 1.79 5 70.103 8.373 2.85
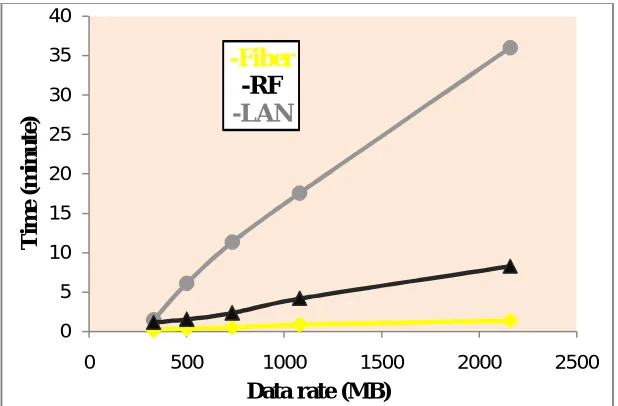
All previous studies have shown that fiber optic faster than copper wires (LAN) and RF to transfer the format from point to another point. This is consistent with the practical results that have been reached, as illustrated in Figure (11).
Figure (11): The velocity of data rate for Fiber, RF and LAN.
REFERENCES
[1] Nick Massa, '' Fiber Optic Telecommunication '', (2000).
[2] Govind P. Agrawal, '' Fiber-Optic Communications Systems '', Third Edition, (2002). [3] Gerd Keiser, '' Optical Communications Essentials '', McGraw-Hill NETWORK, (2004). [4] AjoyGhatak and K. Thyagarajan, '' Optical Waveguides and Fibers '', (2000). [5] Bahaa E. A. Saleh, Malvin Carl Teich, '' Fundamentals of Photonics, (1991).
0 5 10 15 20 25 30 35 40
0 500 1000 1500 2000 2500
T im e (m in u te )
Data rate (MB)
-Fiber
-RF
ISSN(Online): 2319-8753 ISSN (Print) : 2347-6710
I
nternational
J
ournal of
I
nnovative
R
esearch in
S
cience,
E
ngineering and
T
echnology
(A High Impact Factor, Monthly, Peer Reviewed Journal) Visit: www.ijirset.com
Vol. 6, Issue 10, October 2017
[6] Prof.N.Sangeetha , Santhiya.J, Sofia.M, '' Bend loss in large core multimode optical fiber beam delivery system '', International Journal of Advanced Research in Computer and Communication Engineering Vol. 4, Issue 5, (2015).
[7] S.K. Raghuwanshi ,VikramPalodiya , Ajay Kumar and Santosh Kumar, '' EXPERIMENTAL CHARACTERIZATION OF FIBER OPTIC COMMUNICATION LINK FOR DIGITAL TRANSMISSION SYSTEM '', ICTACT JOURNAL ON COMMUNICATION TECHNOLOGY, Vol.: 05, Issue: 01, (2014).
[8] Pierre Lecoy, '' Fiber-Optic Communications '', (2008).
[9] M. F. M. Salleh, and Z. Zakaria, '' EFFECT OF BENDING OPTICAL FIBRE ON BEND LOSS OVER A LONG PERIOD OF TIME '', ARPN Journal of Engineering and Applied Sciences, VOL. 10, NO.16, (2015).
[10] S. M. Jahangir Alam, M. RabiulAlam, Guoqing Hu, and Md. ZakirulMehrab, ''Bit Error Rate Optimization in Fiber Optic Communications'', International Journal of Machine Learning and Computing, Vol. 1, No. 5, December ( 2011).
[11] TomášIvaniga ,PetrIvaniga, '' Evaluation of the bit error rate and Q-factor in optical networks'', IOSR Journal of Electronics and Communication Engineering (IOSR-JECE), .Vol. 9, Issue 6, P.P 01-03,(2014).
[12] Goff Hill, '' The Cable and Telecommunications Professionals’ Reference Transport Network '', (Volume 2), 3rd Edition, (2008).