ABSTRACT
HAIGH, CASEY DOUGLAS. Modeling, Optimization and Experimental Validation of Shape Memory Alloy Bending Actuators. (Under the direction of Dr.Gregory Buckner).
This thesis details the development of a computational model to investigate and optimize the performance of shape memory alloy (SMA) bending actuators. These actuators
(approximately 11mm in length) consist of curved SMA wires embedded within elastic sleeves and are intended for positioning and anchoring robotic catheters inside blood vessels during clinical treatments. Each SMA wire is shape-set to an initial curvature and inserted along the neutral axis of a straight elastic member (cast PDMS with a specific flexural rigidity). The elastic member preloads the SMA (or produces a stress-induced phase
transformation), reducing the equilibrium curvature of the composite actuator. Temperature-induced phase transformations in the SMA (via Joule heating) enable strain recovery and increased bending (increased curvature) in the actuator. The homogenized energy framework with optimized parameters is utilized to model the behavior of this actuator, and the effects of two critical design parameters (initial SMA curvature and flexural rigidity of the elastic sleeve) on the deactivated and activated curvatures are investigated. To optimize the actuator performance, a multi-objective genetic algorithm is utilized which generates a Pareto
Modeling, Optimization and Experimental Validation of Shape Memory Alloy Bending Actuators
by
Casey Douglas Haigh
A thesis submitted to the Graduate Faculty of North Carolina State University
in partial fulfillment of the requirements for the degree of
Master of Science
Mechanical Engineering
Raleigh, North Carolina 2013
APPROVED BY:
_______________________________ ______________________________ Gregory D. Buckner Scott M. Ferguson
Committee Chair
DEDICATION
BIOGRAPHY
Casey Haigh was born and raised in Cary, NC and graduated from Apex High School in 2007. He attended North Carolina State University to pursue a B.S. in Mechanical
ACKNOWLEDGMENTS
I would like to thank Dr. Gregory Buckner for all of his guidance and support in shaping me as a researcher. I am grateful he pushed me to my limits and gave me the support and opportunity to succeed. I will always be grateful for his efforts in helping me learn to communicate effectively.
I would like to thank the members of my committee: Dr. Scott Ferguson, Dr. Andrew DiMeo. Each has shaped my graduate experience significantly by changing the way I think about problems and giving me tools to solve them. They are outstanding teachers and their classes heavily influenced my research and career.
I want to thank John Crews for his help with the homogenized energy model. Without his contribution, this project may not have happened. Additionally, I am very grateful for the advice and guidance he gave to me which helped shape me as a researcher.
I thank all members of the Electromechanics Research Lab: J.R. Archer, Jennifer Hannen, Shaphan Jernigan and Andy Richards. Each one of these individuals sacrificed time and energy to help me think through ideas and experimental issues. I am deeply indebted to them for their help and am thankful for them as friends.
I thank Skip Richardson for helping with the fabrication of the shape setting rig.
I am grateful to North Carolina State University College of Engineering for supporting my research with Dean’s Fellowship.
the best siblings I could have ever asked for; Teri and Doug Haigh, who love and support me unconditionally; Meredith Haigh, my beloved wife who supported and encouraged me throughout this process.
TABLE OF CONTENTS
LIST OF TABLES ... vii
LIST OF FIGURES ... viii
1 INTRODUCTION ... 1
2 SYSTEM MODEL ... 5
2.1 Homogenized Energy Model of SMA Bending Actuators ... 7
2.2 Equilibrium Equations ... 8
3 EXPERIMENTAL SETUP ... 12
3.1 Actuator Prototyping ... 12
3.2 Image Processing ... 16
4 DESIGN OPTIMIZATION ... 18
4.1 Model Parameter Identification ... 20
4.2 Multi-Objective Optimization ... 20
5 RESULTS ... 22
5.1 Model Parameter Identification ... 22
5.2 Multi-Objective Optimization ... 26
5.3 Experimental validation of Pareto Frontier ... 30
6 CONCLUSION ... 32
LIST OF TABLES
Table 1. Single-objective design variables and bounds ... 21
Table 2. Upper and lower MOGA parameter bounds for initial population (UBi and LBi, respectively) and subsequent populations (UB and LB) ... 21
Table 3. Comparison of initial and optimized HEM parameters ... 23
Table 4. Sum of squared errors (SEE) for initial (non-optimized) and optimized models ... 26
LIST OF FIGURES
Figure 1. CFD simulation results: microparticle trajectories in the CHA are dependent on release location [7] ... 2 Figure 2. Catheter positioning inside hepatic artery ... 3 Figure 3. (a) Shape-set SMA tendon (b) elastic sleeve (c) composite tendon and sleeve bending
actuator ... 6 Figure 4. Composite actuator in its deactivated (yd) and activated (ya) states ... 7 Figure 5. Stress distribution across the cross section of a (a) linear elastic sleeve and (b)
non-linear SMA tendon ... 9 Figure 6. Discretized SMA cross-sectional area ... 10 Figure 7. Dependence of simulated actuator curvature on discretization number (N): (a) as a
function of initial tendon curvature
κ
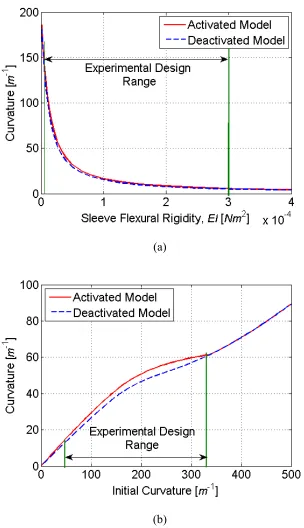
0, (b) as a function of sleeve flexural rigidity EI ... 11 Figure 8. Custom fixture used for shape-setting SMA specimens: Top - dimensioned drawing;Bottom – photograph of machined fixture ... 13 Figure 9. Detail of bolts and washers used to secure SMA specimens during shape-setting ... 13 Figure 10. Simulation results used to determine parametric range of (a) EI and (b)
0
κ
... 15 Figure 11. (a) Rectangular PDMS sleeves (edges highlighted in black for image contrast) with(b) molds used for fabrication ... 16 Figure 12. Processed image of activated actuator with the optimization parameters labeled... 17 Figure 13. Comparison between initial and optimized (a) relative stress density and (b)
interaction stress density ... 23 Figure 14. Predicted vs. Experimentally measured actuator curvatures for initial
(non-optimized) model: (a) as a function of sleeve flexural rigidity EI, (b) as a function of initial curvature
κ
0 ... 24 Figure 15. Predicted vs. Experimentally measured actuator curvatures for optimized model: (a)as a function of sleeve flexural rigidity EI, (b) as a function of initial curvature 0
κ
. 25 Figure 16. Comparison of Pareto-optimal designs’ activated and deactivated displacement,yaand yd ... 27
Figure 17. Effects of Pareto-optimal design parameters’ effect on activated (ya) and
deactivated (yd) displacement: (a) flexural rigidity, EI, (b) initial curvature, 0
κ
.... 28 Figure 18. Interaction of Pareto-optimal design variables (initial curvature,κ
0, and flexuralrigidity, EI) as a function of actuation range
(
)
a d
y − y ... 29
Figure 19. Actuator performance trade-off: actuation ratio
(
ya yd)
and actuation range(
ya − yd)
verses activated displacementya ... 30 Figure 20. Pareto frontier: comparing selected Pareto-optimal designs to their experimental1 INTRODUCTION
Hepatocellular carcinoma and metastatic colorectal cancers are responsible for more than one million deaths every year [1, 2]. Despite the large number of patients affected by these diseases, current treatment options are less than ideal, as 80-90% of patients are not good candidates for surgery [2], 50% of patients with solid tumors have full resistance to
chemotherapy [2], and liver tissue is more sensitive to external radiation than the tumor itself [3]. Fortunately, embolization therapies have shown promise.
Radioembolization (RE) is an emerging embolization technique which permanently embeds radioactive microspheres into liver tumors. The microspheres contain radioactive isotope Yttrium-90 (90Y) which delivers high energy, low penetrating radiation that destroys tumor tissue while limiting adverse effects on normal liver tissue [4]. Currently, RE uses a single-lumen catheter and a manually operated syringe to deliver the 90
Y microspheres into the hepatic artery. However, the arterial anatomy limits the direct targeting of tumors,
causing damage to normal liver tissue and other organs via ischemia or radiation [5]. Despite the documented successes of RE therapy, the inability to directly target tumor sites has limited its widespread adoption.
Basciano et al. used computational fluid dynamic (CFD) modeling to show that the downstream microsphere distribution can be regulated by controlling the release location within the cross-section of the hepatic artery [6], as shown in Fig. 1. Richards et al.
mm)[6]. Therefore, to position a catheter anywhere within the cross section of the CHA, an innovative micro-actuator needs to be developed that can produce a stroke of at least 7mm with minimal disruption to the blood flow around the catheter.
Figure 1. CFD simulation results: microparticle trajectories in the CHA are dependent on release location [7]
offsetting the SMA from the neutral axis, this offset increases the diameter of the actuator, making it less suitable for size-critical applications.
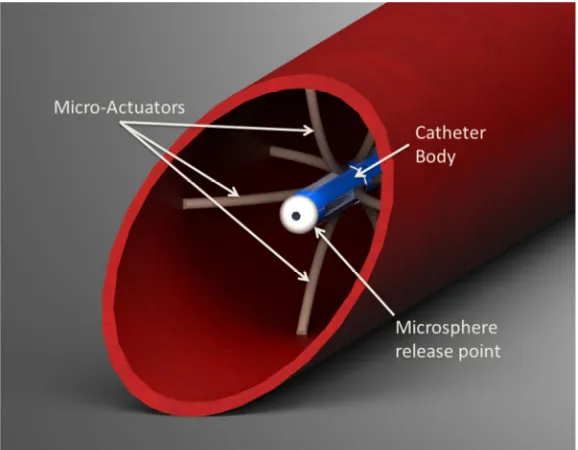
The proposed catheter design, shown in Fig. 2, uses eight shape-set bending actuators arranged radially. With this configuration, the catheter’s release point can be accurately positioned within the cross section of the HA while keeping the catheter parallel to the arterial wall.
Figure 2. Catheter positioning inside hepatic artery
embedded off-neutral axis SMA fiber [11]. Wang et al. presented numerical simulations and experimental validation of a similar actuator composed of a flexible inner cylindrical beam, an SMA tendon, and an outer elastic cylindrical beam [12]. These designs, however, are difficult to miniaturize because the offset SMA increases the diameter of the actuator and introduces complexity into the manufacturing process.
Baz et al. modeled shape-set SMA strips embedded on the neutral plane in a fiberglass beam [13]. The model showed good correlation with experimental data, proving that shape-setting SMA is a viable way to control the shape of a bending actuator. However, the model did not take into account stress non-linearities across the cross-section of the SMA. Ryu et al. [14] investigated the relationship between composite beam stiffness and bending
performance.
The remainder of this paper is organized as follows. The bending actuator system model is presented first. Next, the experimental setup is presented. The SMA model parameters are then estimated using a single-objective genetic algorithm. A multi-objective genetic
2 SYSTEM MODEL
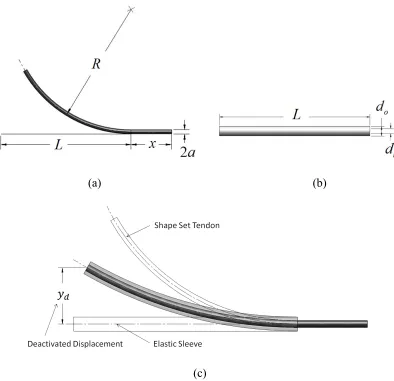
Each bending actuator design consists of two components: a curved SMA tendon embedded within a straight elastic sleeve. The SMA tendon (diameter a, straight length L, and connection length x as in Fig. 3a) is shape-set (or thermally trained) to a particular curvature κ0 where
0 1 R
κ = (1)
and R is the radius of curvature shown in Fig. 3a. The SMA tendon is embedded within an elastic sleeve (inner diameter di, outer diameter do, and length L as in Fig. 3b) which produces a strain-induced phase transition to detwinned martinsite, resulting in a reduced deactivated equilibrium curvature
κ
d (Fig. 3c). As the tendon is heated to temperatures above the austenitic finish temperature Af, the material undergoes a phase transformation to austenite and recovers some of this strain, establishing a larger activated equilibriumcurvature
κ
a, such thatκ
d <κ
a <κ
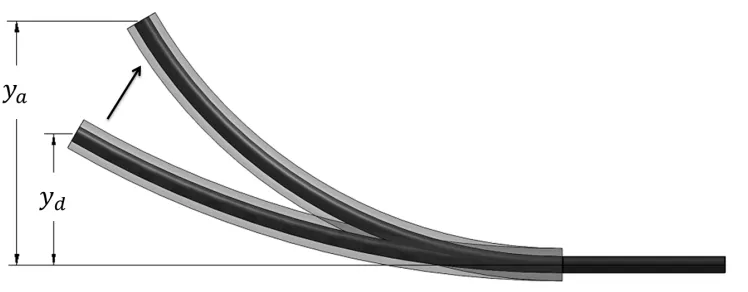
0.To accurately model the deactivated and activated displacements, the equilibrium curvature must be found for each SMA state. Curvature is related to tip displacement by
( )
1 1
cos
y κL
κ κ
= − . (2)
(a) (b)
(c)
Figure 4. Composite actuator in its deactivated (yd) and activated (ya) states
2.1 Homogenized Energy Model of SMA Bending Actuators
The homogenized energy model (HEM) is used to describe the nonlinear, hysteretic relationships between stress, strain, and temperature [10]. The HEM is a macroscopic model that incorporates material inhomogeneities and interaction effects. In [10], the macroscopic strain is modeled as a function of applied stress. Here, we invert the relationship to obtain the macroscopic stress
0
( , )T R( R) (I I) ( , )T d Rd I
σ ε
∞ ∞ν σ ν σ σ ε
σ σ
−∞
=
∫ ∫
, (3)where the local stress
(
)
( , ) T M M
A M M
A M
x x
T
x x x
E E
ε ε
σ ε
+ − + − − − = + + (4)depends on the SMA phase fractions: austenite xA, martensite plus xM+, and martensite minus xM−. The relative stress
σ
R and interaction stressσ
I are assumed to beA
E is the austenitic elastic modulus, EM is the martensitic elastic modulus, and
ε
T is the maximum recoverable strain.2.2 Equilibrium Equations
At equilibrium, the composite actuator’s internal forces and moments must sum to zero. Neglecting gravity and external forces, the actuator’s equilibrium position is solely
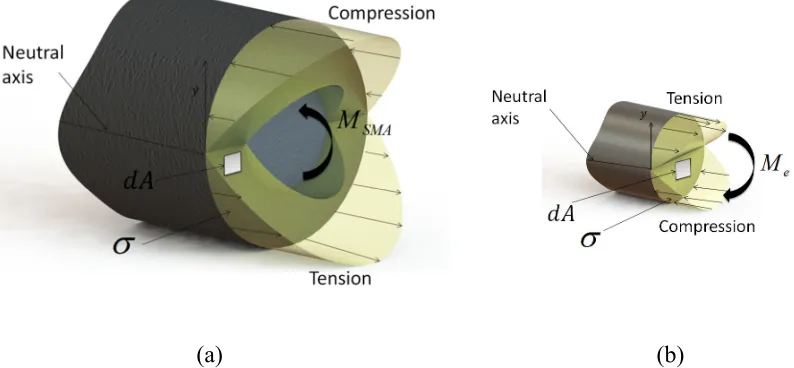
determined by the moment balance between the SMA tendon and the elastic sleeve (Fig. 5a). The elastic moment is given by
( )
eM κ =EIκ , (5)
where E is the sleeve’s elastic (Young’s) modulus, I is its area moment of inertia, and κ is its curvature. The SMA moment is given by
(
,)
( , )sma
M κ T =
∫ ∫
yσ ε T dA, (6)(a) (b)
Figure 5. Stress distribution across the cross section of a (a) linear elastic sleeve and (b) non-linear SMA tendon
We assume that strain varies linearly over the cross-sectional area according to
(
0)
yε = κ −κ . (7)
Therefore, at the initial (shape-set) curvature
κ
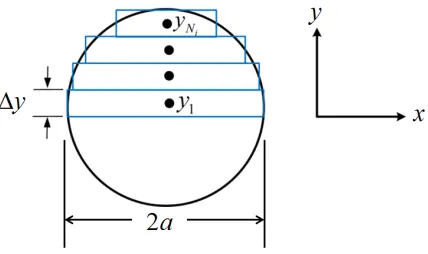
0, the SMA has zero strain over its cross-sectional area.The moment integral (6) is discretized using rectangular elements [15], as shown in Fig. 6. Assuming the stress distribution is symmetric about the neutral axis, this discretization yields
(
)
2 2
1
2 2 ,
i
N
sma i i
i
M a y
σ ε
T y y=
=
∑
− ∆ , (8)where a is the SMA tendon radius, yi is the midpoint of the th
Figure 6. Discretized SMA cross-sectional area
The equilibrium deactivated curvature minimizes
(
)
2arg min e( ) s a( , )
d M M m T
κ
κ = κ − κ ∞ , (9)
where T∞ is the ambient temperature. Equation (9) can be solved using the golden section search method [16]. After finding the deactivated curvature (and associated equilibrium phase fractions), the equilibrium activated curvature minimizes
(
)
2arg min e( ) sma( , )
a M M Tss
κ
κ = κ − κ , (10)
where Tss is the SMA’s activated steady-state temperature.
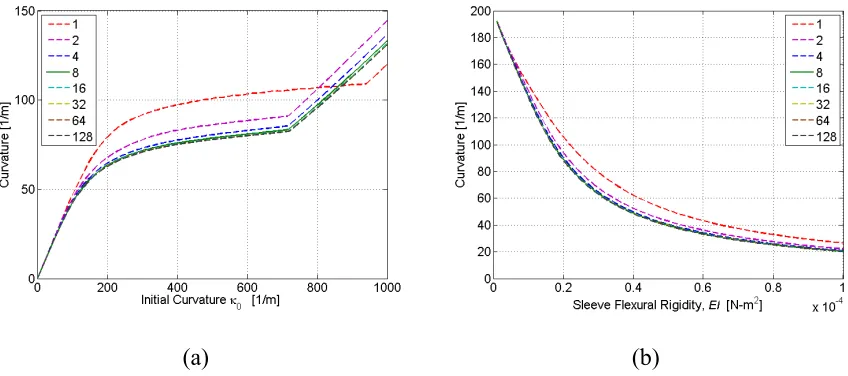
To determine the ideal number of discretization layers, simulations were conducted for varying initial curvature
κ
0 and sleeve flexural rigidity EI. As shown in Fig. 7, the prediction of computed actuator curvature improves with the number of discretization layers (N).adequately balance this tradeoff, as it provides modeling accuracies in excess of 98% when compared to N=128 with only 6.25% of the computational burden.
(a) (b)
3 EXPERIMENTAL SETUP
3.1 Actuator Prototyping
To constrain the SMA tendons during the shape setting process, a custom fixture (Fig. 8) was designed and fabricated from a 304 stainless steel plate (0.305x0.102x0.013m). This fixture features eight precisely machined curvature profiles ranging from 50 to 333 ( 1
m− ), with bolts and washers used to secure the SMA tendon during shape setting (Fig. 9). This range of initial curvatures was determined from simulations to provide the largest difference in activated and deactivated curvature (Fig. 10b). To standardize the electrical resistance of each 3.048e-4m diameter tendon (Dynalloy Inc., Tustin, CA), each curvature profile was machined to provide the same arc length and straight length. Constant tendon tension was maintained by suspending a 400g mass vertically from each SMA tendon during the fixture tightening process.
To shape-set the SMA tendons, a computer-controlled furnace (Thermolyne 1500) was preheated to 500 °C, and the loaded fixture was placed inside for twenty minutes [17]. Immediately following heating, the fixture was quenched in room-temperature water. After cooling, each SMA tendon was removed from the fixture, resulting in stress-induced
Figure 8. Custom fixture used for shape-setting SMA specimens: Top - dimensioned drawing; Bottom – photograph of machined fixture
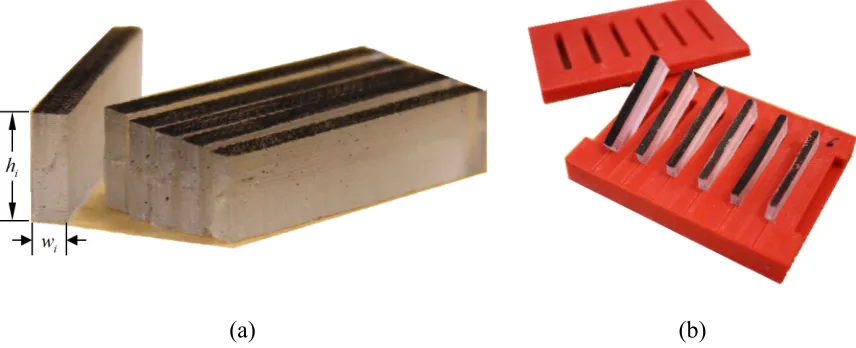
To fabricate elastic sleeves with specific flexural rigidities (EI) in the bending plane, molds were designed with rectangular sections (Fig. 11). By specifying the cross-sectional height to be three times the width, the sleeve is 27 times more compliant in the bending plane than out-of-plane; effects of self-weight are thus minimized during experimental testing. The range of flexural ridigities (6e-6 to 3e-4 2
Nm ) was determined from simulations to provide the largest change in activated and deactivated curvature (Fig. 10). The molds were fabricated using rapid prototyping in ABSplus material (Dimension Elite, Stratasys, Eden Prairie, MN). Nylon monofilament (3.048e-4m diameter) was tensioned along the neutral axis of each rectangular mold to provide space for SMA tendon insertion. Each mold was cast with Polydimethylsiloxane (PDMS, Dow Corning SYLGARD 184) and allowed to cure for two days.
Each actuator was assembled by inserting a shape-set SMA tendon into a molded elastic sleeve. The experimental set up consisted of a cantilevered actuator connected to a
(a)
(b)
(a) (b)
Figure 11. (a) Rectangular PDMS sleeves (edges highlighted in black for image contrast) with (b) molds used for fabrication
3.2 Image Processing
To compute
κ
a andκ
d, image processing code was developed using MATLAB’s Image Processing toolbox (Mathworks, Inc., Natick MA). The code applied golden sectionoptimization to find the bending radius R (Fig. 12) that minimizes the difference between predicted (Lpred) and actual bending length (Lact) according to
pred
L =θR, (11)
2 2 1 2 2 cos 2 act R C L R R − − =
, (12)
computation was repeated for 110 consecutive actuations, averaging the last 10 cycles to eliminate variance and drift associated with low cycle fatigue [18].
4 DESIGN OPTIMIZATION
Genetic algorithms (GAs) are a class of optimization methods based on principles of natural selection. These algorithms minimize (or maximize) one or more objective functions, and are reliable and efficient in optimizing complex systems. GAs utilize techniques
associated with biological reproduction such as crossover, mutation and selection to generate new individuals (designs). An individual’s fitness is evaluated by one or more objective functions. The GA simultaneously evaluates multiple individuals and converges toward optimal solutions by creating new individuals from the fittest ones. GAs are reliable in the optimization of non-linear, multi-modal and complex systems because they are a zero order method and do not require penalty methods to enforce constraints. An excellent overview of GAs can be found [19] and [20].
are performed to create new individuals based on the information from the parents. For example, in a heuristic crossover for real value encoding, the crossover returns a child close to the parent with the higher fitness value but further from the parent with the worse fitness value,
2 ( 1 2)
child= parent +R parent −parent , (13)
whereparent2has a lower fitness evaluation than parent1and R is recommended to be 1.2. The new children then go through mutation. The rate of mutation is generally low and helps to insure that the optimization does not converge to local minima by randomly changing either a part or all of an individual’s design. The process of evaluation, selection, crossover, and mutation is repeated until one of the convergence criteria are met.
To evaluate more than one objective function, a multi-objective genetic algorithm (MOGA) is used. Although the multi-objective and single-objective genetic algorithms use the same aforementioned steps to evaluate, the MOGA may have more than one optimal design. If simultaneous reductions occur in every objective function during optimization, there will only be one optimal design. However, in most MOGAs, there are complex interactions between the multiple objective functions. These interactions yield a Pareto frontier of non-dominated solutions [19, 21]. The Pareto frontier helps the designer
4.1 Model Parameter Identification
To experimentally identify bending equilibrium model parameters, a single-objective genetic algorithm was utilized to minimize the sum of squared errors (SSE) between
predicted and experimentally measured actuator curvatures. Eighteen HEM parameters were chosen as design variables. The design variables and their associated bounds are listed in Table 1. Experimental data was obtained for actuators with a fixed flexural rigidity (EI of 3e-5 2
Nm ) and six different initial curvatures (
κ
0=100, 125, 167, 200, 250, and 333 1m− ). Additional data was obtained for a fixed initial curvature (
κ
0of 200 m−1) and four differentvalues of flexural rigidity (EI=6e-6, 1.5e-5, 3e-5, 6e-5 2
Nm ). The ga function in the
MATLAB optimization toolbox was employed for single-objective design optimization. The design variables were real value encoded and 36 individuals were systematically populated within initial design variable bounds. The bounds were chosen from knowledge of the design space to speed convergence. Heuristic crossover was utilized with a crossover fraction of 1.2. The convergence criteria consisted of a minimum objective function gradient (1e-6) and a generation limit (200). The initial parameters were taken from [10].
4.2 Multi-Objective Optimization
displacement when the actuator is θ =90(Fig. 12). To improve numerical conditioning, log10(EI) was used to normalize the individuals for reproduction. The gamultiobj function in
MATLAB was employed for the MOGA. Most of the GA settings were identical to the single-objective optimization case, with the exceptions of population (50) and minimum objective function gradient (1e-4). The two sets of upper and lower parameter bounds shown in Table 2 were utilized for population initialization (UBi and LBi, respectively) and
subsequent populations (UB and LB).
Table 1. Single-objective design variables and bounds
Variable Description
Lower Bound
Upper
Bound Units
, k m
α Relative stress density coefficients 0 3.0 -
k
β
Interaction stress density coefficients 0 3.0 -A
E Austenitic elastic modulus 10 100 GPa
M
E Martensitic elastic modulus 10 100 GPa
L
σ
Martensitic transition stress at 348 K 100 400 MPaT
σ
∆ Hysteresis loop’s temperature dependence 1.0 15.0 MPa K
T
ε
Maximum recoverable strain 1.0 7.0 %h
Convection Coefficient 0.01 1.6 W m K2max
T Maximum SMA Temperature 353 403 K
Table 2. Upper and lower MOGA parameter bounds for initial population (UBi and LBi, respectively) and subsequent populations (UB and LB)
0
κ
EIUBi 600 1.00E-05
LBi 0 1.00E-02
UB 600 1.00E+00
5 RESULTS
5.1 Model Parameter Identification
To investigate optimality of the solution, GA convergence was monitored for five
Table 3. Comparison of initial and optimized HEM parameters
Variable Initial Value Optimized Value Units
A
E 30.7 59.0 GPa
M
E 26.0 16.8 GPa
L
σ
295 204 MPaT
σ
∆ 9.2 9.96 MPa K
T
ε
4.4 7.0 %h
0.8 0.43 W m K2max
T 380 381 K
(a) (b)
(a)
(b)
Figure 14. Predicted vs. Experimentally measured actuator curvatures for initial (non-optimized) model: (a) as a function of sleeve flexural rigidity EI, (b) as a function of initial
(a)
(b)
Figure 15. Predicted vs. Experimentally measured actuator curvatures for optimized model: (a) as a function of sleeve flexural rigidity EI, (b) as a function of initial curvature
Table 4. Sum of squared errors (SEE) for initial (non-optimized) and optimized models
SSE Deactivated SSE Activated SSE Sum
Initial Model 4.79E+03 2.48E+03 7.26E+03
Optimized Model 4.78E+02 3.67E+01 5.15E+02
Percent Improvement 90% 99% 93%
Comparing the optimized HEM parameters to the imposed parameter bounds reveals that the maximum recoverable strain lies on the upper bound. This indicates that the equilibrium model may need to take into account additional variables to more accurately predict
equilibrium curvature: internal friction, non-linear elastic modulus of PDMS at high strains or the effect contact has on temperature distribution across the tendon. Despite these modeling limitations, the optimized model can still be used for design optimization.
5.2 Multi-Objective Optimization
The MOGA converged based on the minimum objective function gradient and generated the Pareto Frontier shown in Fig. 16. This Pareto frontier shows the non-dominated designs from the optimization, and clearly reveals the inherent design tradeoff between yd and ya: no design combination of EI and
κ
0 perfectly minimizes yd (yd =0 )m whileclear from Fig. 17 that the change in activated displacement occurs predominantly over initial curvatures ranging from 50 to 375 ( 1
m− ) and flexural rigidities, EI, ranging from 5e-4 to 1e-5
2
Nm .
Figure 16. Comparison of Pareto-optimal designs’ activated and deactivated displacement,ya
(a)
(b)
Figure 18. Interaction of Pareto-optimal design variables (initial curvature,
κ
0, and flexuralrigidity, EI) as a function of actuation range
(
)
a d
y − y
The interaction of Pareto-optimal EI and
κ
0 in Fig. 18 illustrates how these designvariables relate to actuation range: generally this range is proportional to initial curvature and inversely proportional to flexural rigidity. An additional performance metric, the actuation ratio
(
ya yd)
, helps illustrate the design tradeoff between ya and yd, as shown in Fig. 19. Arguably, the “best” design balances both performance metrics, the design (ya=0.004 m,d
Figure 19. Actuator performance trade-off: actuation ratio
(
ya yd)
and actuation range(
ya −yd)
verses activated displacementya5.3 Experimental validation of Pareto Frontier
representative designs out-perform the Pareto frontier: because
κ
d ∝ yd, the experimental evaluations of ydat lowκ
0 (100, 125 m−1) were higher than predicted and high0
κ
(200,250, 333 1
m− ) were less than predicted.
Table 5. Selected Pareto-optimal designs for experimental validation
Initial
Curvature Sleeve EI
Deactivated Displacement (m)
Activated Displacement (m)
1 100 3.05E-05 0.0010 0.0025
2 125 2.23E-05 0.0016 0.0036
3 167 1.76E-05 0.0025 0.0049
4 200 1.58E-05 0.0031 0.0057
5 250 1.47E-05 0.0037 0.0065
6 333 1.16E-05 0.0049 0.0075
6 CONCLUSION
This paper demonstrates a method for optimizing the design of shape-set SMA bending actuators. Optimized HEM and bending equilibrium models reveal non-linear dependencies of actuator bending curvature on flexural rigidity and initial curvature. Experimental results validate the accuracy of these models as predictors of activated and deactivated curvature. A Pareto frontier based on these models reveals inherent design tradeoffs between activated and deactivated displacement. While the goal here is optimizing the performance of an SMA bending actuator, the methods and results can easily be extended to other smart materials and actuator topologies. Future work will focus on weighting functions and “strength of
7 REFERENCES
[1] Befeler, A. S., and Di Bisceglie, A. M., 2002, "Hepatocellular Carcinoma: Diagnosis and Treatment," Gastroenterology, 122(6) pp. 1609-1619.
[2] Welsh, J. S., and Kennedy, A. S., 2006, "Selective Internal Radiation Therapy (SIRT) for Liver Metastases Secondary to Colorectal Adenocarcinoma," International Journal of Radiation Oncology Biology Physics, 66(2) pp. S62-S73.
[3] Kennedy, A. S., Nutting, C., Coldwell, D., 2004, "Pathologic Response and Microdosimetry of 90Y Microspheres in Man: Review of Four Explanted Whole Livers," International Journal of Radiation Oncology*Biology*Physics, 60(5) pp. 1552-1563.
[4] Ibrahim, S. M., Nikolaidis, P., Miller, F. H., 2009, "Radiologic Findings Following Y90 Radioembolization for Primary Liver Malignancies," Abdominal Imaging, 34(5) pp. 566-581.
[5] Richards, A. L., Kleinstreuer, C., Kennedy, A. S., 2012, "Experimental Microsphere Targeting in a Representative Hepatic Artery System," IEEE Transactions on Biomedical Engineering, 59(1) pp. 198-204.
[6] Ishigami, K., Zhang, Y., Rayhill, S., 2004, "Does Variant Hepatic Artery Anatomy in a Liver Transplant Recipient Increase the Risk of Hepatic Artery Complications After Transplantation?" American Journal of Roentgenology, 183(6) pp. 1577-1584. [7] Basciano, C. A., Kleinstreuer, C., Kennedy, A. S., 2010, "Computer Modeling of
Controlled Microsphere Release and Targeting in a Representative Hepatic Artery System," Annals of Biomedical Engineering, 38(5) pp. 1862-1879.
[8] Nespoli, A., Besseghini, S., Pittaccio, S., 2010, "The High Potential of Shape Memory Alloys in Developing Miniature Mechanical Devices: A Review on Shape Memory Alloy Mini-Actuators," Sensors and Actuators A:Physical, 158(1) pp. 149-160.
[9] Smith, R.C., 2005, "Smart material systems : model development," Society for Industrial and Applied Mathematics, Philadelphia, .
[10] Crews, J. H., Smith, R. C., Pender, K. M., To appear in 2012, "Data-Driven Techniques to Estimate Parameters in the Homogenized Energy Model for Shape Memory Alloys," Journal of Intelligent Material Systems and Structures, .
[12] Wang, G., and Shahinpoor, M., 1997, "Design, Prototyping and Computer Simulations of a Novel Large Bending Actuator made with a Shape Memory Alloy Contractile Wire," Smart Materials & Structures, 6(2) pp. 214-221.
[13] Baz, A., Chen, T., and Ro, J., 2000, "Shape Control of NITINOL-Reinforced Composite Beams," Composites Part B-Engineering, 31(8) pp. 631-642.
[14] Ryu, J., Jung, B., Kim, M., 2011, "Numerical Simulation of Hybrid Composite Shape-Memory Alloy Wire-Embedded Structures," Journal of Intelligent Material Systems and Structures, 22(17) pp. 1941-1948.
[15] Li, Q., 2006, "Modeling and Finite Element Analysis of Smart Materials," North Carolina State University, Raleigh, .
[16] Press, W., Teukolsky, S., Vetterling, W., and Flannery, B., 2007, "Numerical recipes : the art of scientific computing," Cambridge University Press, Cambridge, UK ; New York, .
[17] Morgan, N. B., Mar 2004, "Taking the Art out of Smart! - Forming Processes and Durability Issues for the Application of Niti Shape Memory Alloys in Medical Devices," Medical Device Materials: Proceedings of the Materials & Processes for Medical
Devices Conference 2003, S. Shrivastava, ed. ASM International, Materials Park, OH, pp. 247.
[18] Lagoudas, D., 2008, "Shape Memory Alloys: Modeling and Engineering Applications," .
[19] Goldberg, D.E.(.E., 1953-, 1989, "Genetic algorithms in search, optimization, and machine learning," Addison-Wesley Pub. Co, Reading, Mass., .
[20] Srinivas, M., and Patnaik, L. M., 1994, "Genetic Algorithms: A Survey," Computer, 27(6) pp. 17-26.
[21] Deb, K., Pratap, A., Agarwal, S., 2002, "A Fast and Elitist Multiobjective Genetic Algorithm: NSGA-II," Evolutionary Computation, IEEE Transactions On, 6(2) pp. 182-197.
![Figure 1. CFD simulation results: microparticle trajectories in the CHA are dependent on release location [7]](https://thumb-us.123doks.com/thumbv2/123dok_us/1586097.1195404/12.612.183.448.191.422/figure-simulation-results-microparticle-trajectories-dependent-release-location.webp)