ABSTRACT
ARRIAGADA, RODRIGO ANTONIO. Private Provision of Public Goods: Applying Matching Methods to Evaluate Payments for Ecosystem Services in Costa Rica. (Under the direction of Erin O. Sills.)
Payments for environmental services (PES) is a recent policy innovation attracting attention in both developed and developing countries. In developing countries, PES remain poorly tested. Costa Rica was among the first to implement a national PES scheme in which substantial amounts of money have conditionally changed hands, thus representing an excellent laboratory for evaluating the causes and consequences of PES participation.
In this dissertation, I estimate the causal impact of the Costa Rican Program of Payments for Environmental Services (PSA) on forest cover at two scales, using state-of-the-art matching methods. First, I estimate the impact of a PSA forest conservation contract on an individual parcel, during the initial years of PSA in the case study region of Sarapiquí. Second, I estimate the impact of PSA contracting at the census tract level for the entire nation of Costa Rica, considering both binary and continuous measures of contracts signed between 1998 and 2004.
The parcel level analysis is based on a household survey of participants and non-participants in PSA, with the sample drawn from administrative records of PSA and the national land registry, combined with GIS data on biophysical land characteristics and land cover information from aerial photographs and satellite images. The national analysis is based on a combination of administrative data on PSA, census data on socio-economic characteristics, GIS data on biophysical land characteristics from several sources, and various measures of change in forest cover derived from classified satellite images, all organized at the census tract level.
While this dissertation is motivated by the broad policy debate over the effectiveness of PES as a conservation policy tool, it aims to answer a relatively narrow empirical
this research are that (1) only landowners whose opportunity cost of participation is low have enrolled in PSA, and (2) enrollment in PSA has generated a net increase in the area of forest.
The parcel level analysis suggests that farms that do not have good alternative uses on their land (because of steep slopes or poor soil quality) tend to be enrolled in the program. Matching results provide evidence that during the initial phase of PSA, the program did have a significant but small effect on forest cover, both reducing loss of existing mature forest (gross deforestation as reported by landowners) and increasing total forest cover (net
deforestation as determined by remote sensing) on parcels with contracts signed early in the program.
Private Provision of Public Goods: Applying Matching Methods to Evaluate Payments for Ecosystem Services in Costa Rica
by
Rodrigo Antonio Arriagada
A dissertation submitted to the Graduate Faculty of North Carolina State University
In partial fulfillment of the Requirements for the degree of
Doctor of Philosophy
Forestry
Raleigh, North Carolina 2008
APPROVED BY:
______________________________ ______________________________
Dr. Erin O. Sills Dr. Frederick W. Cubbage Chair of Advisory Committee Co-Chair of Advisory Committee
______________________________ ______________________________
Dr. Subhrendu K. Pattanayak Dr. Mitch Renkow
ii
DEDICATION
iii BIOGRAPHY
Rodrigo Arriagada was born in Santiago in 1972. After finishing high school, he earned a bachelor in forest engineering at the University of Chile. Having completed his bachelor, he founded FORESMAN Consulting Inc., a private consulting firm, devoted to promote sustainable development through Integrated Development Conservation Projects. He also worked for two years as a project analyst for the Chilean Ministry of Education (Improvement of Quality and Equity of Higher Education Program). Prior to join the doctoral program in the Department of Forestry and Environmental Resources at North Carolina State University in 2004, he received a Master of Science in natural resources from North Carolina State University, where he investigated fertilizer demand for rice production around the Palo Verde national park in Guanacaste, Costa Rica. During the doctoral program, he has been part of the National Science Foundation and the Latin American and The Caribbean Environmental Economics Program supported research in Costa Rica. Rodrigo was awarded both a Doctoral Dissertation Improvement Grant by the National Science Foundation and a Latin American and The Caribbean Environmental Economics Program Research Grant in 2007. He has been selected as a Postdoctoral Research Associate at the ecoSERVICES research group in Arizona State University that he begins from August 15, 2008.
iv
ACKNOWLEDGMENTS
It would be impossible to thank in this short space to all who have helped me in this long journey. For those who I mention, words will fail to capture my feeling of gratitude, admiration and affection. For those I forget, I hope you will forgive.
I want to start thank you to my mentor, Dr. Erin Sills who have showed me during all these years her incredible energy capacity and her ability to solve complex problems in simple ways. My involvement in this research started in 2005 when I was given the opportunity to participate with her and with Dr. Subhrendu Pattanayak and Dr. Paul Ferraro (Georgia State University) in a NSF-funded project. Dr. Pattanayak has been a role-model for me showing me how to do scientific research that can have a meaning in real life. Dr. Ferraro gave me many suggestions on how to conduct research in the field and introduced me to the fascinating world of counterfactual analysis. I thank Dr. Frederick Cubbage for being the responsible of bringing me to the US, and I won’t forget my meeting with him in Santiago that changed my life. I am indebted to Dr. Lori Bennear for introducing me in the field of program evaluation. I also thank Dr. Mitch Renkow for showing me beautiful ways on how to connect economics with human development. Edgar Ortiz, professor at Instituto
Tecnológico de Costa Rica, has also been fundamental to the research from the beginning, making possible to obtain the necessary data to implement my research.
This journey would have been very tough, perhaps impossible without friends, who have been through similar challenges, have been great sources of comfort and support. Finally, I owe everything to Ana Maria, my lovely wife; she believed in me and gave me the support necessary to accomplish this.
v
TABLE OF CONTENTS
LIST OF TABLES ... viii
LIST OF FIGURES ... x
INTRODUCTION TO PAYMENTS FOR ENVIRONMENTAL SERVICES AND CONCEPTUAL FRAMEWORK ... 1
1.1 PAYMENTS FOR ECOSYSTEM SERVICES ... 4
1.1.1 Concepts ... 4
1.1.2 The Costa Rican case ... 6
1.1.3 Previous evaluations of PSA and key challenges for future evaluations ... 7
1.2 OBJECTIVES ... 11
1.3 DISSERTATION OVERVIEW ... 12
1.4 CONCEPTUAL FRAMEWORK ... 13
1.5 BIBLIOGRAPHY ... 21
COMBINING QUALITATIVE AND QUANTITATIVE METHODS TO EVALUATE PARTICIPATION IN COSTA RICA'S PROGRAM OF PAYMENTS FOR ENVIRONMENTAL SERVICES ... 26
2.1 INTRODUCTION ... 25
2.2 METHODS ... 29
2.2.1 Integrating Qualitative and Quantitative Methods in Program Evaluation ... 29
2.2.2 Case Studies ... 30
2.2.3 Landowner Survey ... 34
2.3 UNDERSTANDING MOTIVATIONS TO PARTICIPATE IN PSA ... 36
2.3.1 Determinants of Participation in PSA ... 36
2.3.2 Statistical Results ... 42
2.4 CONCLUSIONS ... 45
2.5 BIBLIOGRAPHY ... 47
Appendix 1: PSA properties and regions of proximity (buffer) sampling ... 57
Appendix 2: application process to enroll in the Costa Rican Program of Payments for Environmental Services during 1997-1998 ... 58
ECONOMETRIC ANALYSIS OF THE COSTA RICAN PROGRAM OF PAYMENTS FOR ENVIRONMENTAL SERVICES USING HOUSEHOLD DATA FROM THE SARAPIQUI REGION ... 59
3.1 INTRODUCTION ... 59
3.2 IMPLEMENTATION OF PSA ... 62
3.3 DEFORESTATION IN COSTA RICA ... 67
3.4 ISOLATING PSA CAUSAL EFFECT ... 69
3.5 RESEARCH METHODS... 72
vi
3.5.2 Multivariate matching ... 77
3.5.3 Matching on the propensity score ... 79
3.6 DATA ... 82
3.6.1 Study Region ... 82
3.6.2 Household Survey ... 83
3.6.3 Case studies ... 84
3.6.4 Self-reports vs. aerial photographs ... 85
3.7 EMPIRICAL STRATEGY ... 86
3.7.1 Ordinary least squares... 86
3.7.2 Multivariate matching ... 87
3.7.3 Matching on the propensity score ... 90
3.8 RESULTS ... 92
3.8.1 Program participants vs. non-participants... 92
3.8.2 Land use changes from self-reports and from aerial photos ... 94
3.8.3 Estimates of program impact ... 96
3.8.3.1 OLS regression estimates ... 96
3.8.3.2 Multivariate matching ... 98
3.8.3.3 Propensity score matching ... 101
3.8.4 Assessing spillover effects and unconfoundedness ... 107
3.9 CONCLUSIONS ... 109
3.10 BIBLIOGRAPHY ... 111
Appendix 1: Correlations between differences in area of mature native forest in Sarapiquí in 2005 as reported by landowners and obtained from aerial photos, and selected variables ... 146
Appendix 1: Correlations between self-reported biophysical controls and the ones obtained from remote sensing imagey... ... 147
MATCHING ANALYSIS USING BINARY AND CONTINUOUS TREATMENT PAYMENTS FOR ENVIRONMENTAL SERVICES AND THEIR IMPACT ON FOREST TRANSITION IN COSTA RICA USING VARIUOS DEFINITIONS OF PROGRAM OUTCOME ... 148
4.1 INTRODUCTION ... 148
4.2 COSTA RICAN SETTING AND CONSERVATION POLICIES ... 152
4.2.1 Historical background of Costa Rican deforestation ... 152
4.2.2 Causes and underlying driving forces of deforestation in Costa Rica ... 154
4.2.3 Payments for ecosystem services ... 158
4.2.4 Inputs, outputs and outcomes of PSA ... 163
4.3 RESEARCH METHODOLOGY ... 168
4.3.1 Roy-Rubin model of causal effect ... 168
vii
4.3.2.1 Matching on the propensity score ... 175
4.3.2.2 Blocking on the propensity score ... 176
4.3.3 Mixed methods ... 177
4.3.3.1 Weighting and regression ... 178
4.3.3.2 Matching and Regression ... 178
4.3.4 Estimates of PSA causal effect with a continuous treatment ... 181
4.3.4.1 The generalized propensity score and the dose-response function ... 181
4.4 DATA ... 184
4.4.1 Unit of observation ... 184
4.4.2 Treatment ... 186
4.4.3 Confounders ... 188
4.5 EMPIRICAL STRATEGY ... 192
4.5.1 Propensity score methods ... 192
4.5.2 Implementation of the GPS methodology ... 194
4.6 RESULTS ... 195
4.6.1 Program participants vs. non-participants... 195
4.6.2 Estimates of program impact using a binary definition of treatment ... 196
4.6.3 Estimates of program impact using a continuous definition of treatment ... 201
4.6.3.1 Estimates of the GPS ... 201
4.6.3.2 Balancing properties of the GPS ... 202
4.6.3.3 Assessing the support overlap condition ... 204
4.6.3.4 Estimates and plots of the dose response function ... 205
4.7 CONCLUSIONS ... 206
4.8 BIBLIOGRAPHY ... 210
Appendix 1: Hectares enrolled in different forest programs created in Costa Rica before PSA ... 243
Appendix 2: Geographical datasets employed in the Costa Rica LULC analysis ... 244
Appendix 3: Deforestation tren between PSA and non-PSA census tracts ... 245
CONCLUSIONS ... 247
viii
LIST OF TABLES
Table 2.1: Costa Rica: designated functions of forest and other wooded land ... 52
Table 2.2: Distribution of hectares and payments among PSA modalities between 1997 and 2006* ... 52
Table 2.3: Type of landowners included in qualitative interview case studies ... 53
Table 2.4: Land use as reported by landowners in detailed interviews ... 54
Table 2.5: Alternative land use if not under contract ... 55
Table 2.6: Reasons for enrolling/not enrolling land in PSA ... 55
Table 2.7: Use of PSA payments, as reported by landowners) ... 55
Table 3.1: Description of PSA modalities during initial years (1997-2000) ... 125
Table 3.2: Hectares protected by PSA contracts signed between 1998 and 2007 in the study region ... 125
Table 3.3: Comparison of pre-matched samples of PSA and non-PSA landowners in Sarapiquí ... 125
Table 3.4: Self-reported land uses vs. land uses from aerial photos ... 127
Table 3.5: Change in land use as reported by landowners and obtained from aerial photos ... 128
Table 3.6: Effect of PSA on self-reported mature native forest cover change using OLS regression ... 129
Table 3.7: Effect of PSA on total native forest cover change from aerial photos using OLS regression ... 130
Table 3.8: Robustness checks ... 131
Table 3.9: PSA effect estimates using multivariate matching ... 132
Table 3.10: Balance-checking criteria for multivariate matching using self-reported household data ... 133
Table 3.11: Balance-checking criteria for multivariate matching using data from aerial photos ... 134
Table 3.12: Marginal effects on the propensity of a parcel to have a PSA contract using self-reported area with natural forest in 1996 land use (dependent variable = 1 if parcel has a PSA contract) ... 135
Table 3.13: Marginal effects on the propensity of a parcel to have a PSA contract using area with native forest in 1992 and other controls from aerial photos (dependent variable = 1 if parcel has a PSA contract) ... 136
Table 3.14: Treatment effect estimates ... 137
Table 3.15: Balance-checking criteria for propensity score matching using self-reported household data ... 138
Table 3.16: Balance-checking criteria for propensity score matching using data from aerial photos ... 139
Table 3.17: Robustness checks with additional constraints on counterfactual selection and using imputation for missing data ... 140
Table 3.18: Spatial spillover effect of PSA on deforestation using matching ... 141
Table 3.19: Spatial spillover effect of PSA on deforestation using OLS ... 142
Table 3.20: Unconfoundedness test I ... 143
Table 3.21: Unconfoundedness test II ... 144
Table 4.1: Description of PSA modalities during initial years (1997-2008) ... 228
Table 4.2: PSA forest conservation distribution among Costa Rican conservation areas ... 229
Table 4.3: Grouping of conservation areas following five criteria ... 229
ix
Table 4.5: Descriptive statistics of census tracts included in the PSA analysis ... 230
Table 4.6: Comparison of pre-matched non-treated and continuously treated census tracts ... 231
Table 4.7: Marginal effects on the propensity of a census tract to have PSA contract (dependent variable = 1 if tracts has at least one PSA contract) ... 233
Table 4.8: Treatment effect estimates ... 234
Table 4.9: Balance-checking criteria for matching on the propensity score ... 235
Table 4.10: Treatment effect estimates by conservation area groups ... 237
Table 4.11: Estimated GPS: loglinear regression of PSA intensity on covariates ... 239
Table 4.12: Balance in covariates with and without adjustment based on PSA conservation intensity ... 240
Table 4.13: Estimated parameters of the conditional distribution of program outcomes given percent of tract area under PSA and the GPS ... 241
x
LIST OF FIGURES
Figure 2.1: Study area of household survey ... 51
Figure 2.2: Description of the process involved in participation in the Costa Rica PES program ... 51
Figure 3.1: Study area ... 121
Figure 3.2: PSA Parcels and Non-PSA Sampling Using Buffers ... 121
Figure 3.3: Distribution of matched controls for changes in mature native forest cover 1996-2005 from self-reports using nearest neighbor inverse-variance and Mahalanobis multivariate matching ... 122
Figure 3.4: Distribution of matched controls for changes in mature native forest cover 1996-2005 from self-reports using nearest neighbor propensity score matching and full logit specification ... 122
Figure 3.5: Distribution of matched controls for changes in total native forest cover 1992-2005 from aerial photos using nearest neighbor inverse-variance and Mahalanobis multivariate matching ... 123
Figure 3.6: Distribution of matched controls for changes in total native forest cover 1992-2005 from aerial photos using nearest neighbor propensity score matching and full logit specification using self-reported and remote sensing imagery biophysical controls ... 123
Figure 3.7: Common support graph of propensity scores for PSA participants (treated) and non-participants (untreated) ... 124
Figure 3.7: Deforestation trend between participants and non-participants in PSA ... 124
Figure 4.1: Costa Rican rural census tracts classified by size ... 221
Figure 4.2: Distribution of PSA protection contracts 1998-2004 ... 221
Figure 4.3: Distribution of the area protected by PSA protection 1998-2004 per census tract ... 222
Figure 4.4: Distribution of the percent of census tract area protected by PSA Protection 1998-2004 ... 222
Figure 4.5: Kernel density estimates of the percent of census tract area protected by PSA 1998-2004 ... 223
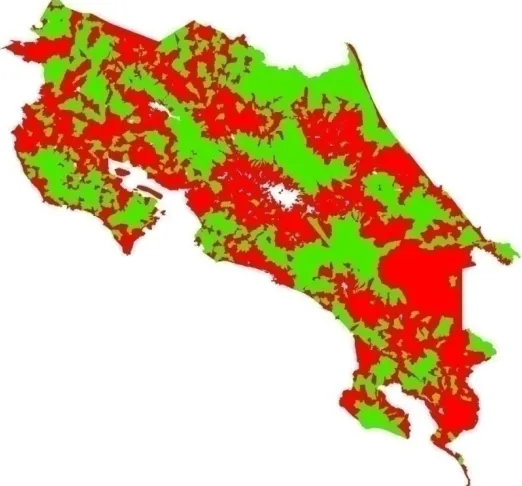
Figure 4.6: Areas containing tracts with PSA protection contracts (green areas) and without PSA protection contracts (red areas) ... 223
Figure 4.7: Propensity score distribution between PSA and non-PSA tracts ... 224
Figure 4.8: Common support graph of propensity scores ... 224
Figure 4.9: GPS common support condition for group 1 ... 225
Figure 4.10: GPS common support condition for group 2 ... 225
Figure 4.11: GPS common support condition for group 3 ... 226
Figure 4.12: Dose response function forest gain 1997-2005 ... 226
Figure 4.13: Dose response function forest loss 1997-2005 ... 227
1
Chapter 1
INTRODUCTION TO PAYMENTS FOR ENVIRONMENTAL
SERVICES AND CONCEPTUAL FRAMEWORK
Ecosystem services are the benefits that people derive from the biophysical environment. Following the Millennium Ecosystem Assessment (2005) these are characterized as provisioning services (foods, fuels, fibers, genetic materials, chemical compounds and the like), cultural services (aesthetic, spiritual, moral, recreational, educational, scientific uses) and regulating services (the role of ecosystems in regulating flows of provisioning and cultural services including, for example, water quality regulation, soil erosion reduction, storm damage protection and so on). In particular, forests provide an array of ecosystem services by sequestering carbon, maintaining habitat and biodiversity, stabilizing hydrological flows, mitigating soil erosion, and improving microclimates (Pattanayak and Butry 2005).
2
deforestation and forest degradation) can irreversibly and substantively impair the provision of ecosystem services.
Paying for the provision of environmental services is a recent policy innovation attracting much attention in both developed and developing countries. This policy mechanism, referred to as Payments for Ecosystem Services (PES), aims to harness market forces to obtain more efficient environmental outcomes (Bulte et al. 2008). The concept of PES has emerged in recent years as a potential tool for achieving ecosystem conservation and improving the livelihoods of environmental-service providers and consumers. The emergence of these direct economic incentives for the conservation of environmental services indicates a shift away from the predominant use of command-and-control mechanisms (such as park establishment or logging bans) and a search for more flexible and efficient ecosystem protection (Landell-Mills and Porras 2002).
PES schemes incorporate different services generated from different ecosystems. Important attention has been focused on services produced by forests. First, this is because forests collectively provide innumerable valuable services to humans. Second, high deforestation rates have persisted in the tropics despite many different conservation initiatives over the past couple of decades, thereby focusing attention on the need for innovative tools to preserve environmental services of forest ecosystems. Third, the increased focus on reducing deforestation in developing countries in wake of the agreement on deforestation incorporated into the Bali Action Plan.1 The markets for ecosystem services seem to fall into categories in a couple of ways. First, ecological commodities follow the popular grouping of: carbon, water, biodiversity, and bundled services. Carbon markets are generally those that reward the stewardship of an ecosystem’s atmospheric regulation
1 After the 2007 United Nations Climate Change Conference on the Bali Island in Indonesia, the participating
3
services. Water markets provide payments for nature’s hydrological services. Biodiversity markets create an incentive to pay for the management and preservation of biological processes as well as habitat and species. Bundled payments are ones in which a payment secures all or a combination of carbon, water, and biodiversity services. Bundled payments also include those in which the ecosystem service payment is built into the price of the product, such as certified timber or certified produce (Forest Trends and the Ecosystem Marketplace 2008).
Pagiola and Platais (2002) point to several advantages of PES, including more efficient, sustainable and mutually beneficial arrangements between environmental-service providers and users. Similarly, Landell-Mills and Porras (2002) show that, under the right conditions, PES systems can results in both more conservation and improved livelihoods for poor people. However, considerably uncertainty still remains as to what exactly environmental services are, what policies and programs qualify as PES, to what extent they are currently being implemented, and what their prospects for success are (Robertson and Wunder 2005; Bulte et al. 2008; Engel et al. 2008; Pagiola 2008; Zilberman et al. 2008).
In developing countries, PES systems remain poorly tested.2 There are many incipient PES initiatives (Landell-Mills and Porras 2002; Pagiola and Platais 2002), but for PES schemes with some experience and with money conditionally changing hands, the literature and policy documents typically refer only to Costa Rica and a couple of dozen other pioneer experiences, mostly in Latin America.
2 Industrialized nations have used conservation payments for decades to conserve agricultural soil, improve
4
This dissertation comprises three essays analyzing the Costa Rican Program of Payments for Environmental Services (Programa de Pago por Servicios Ambientales, PSA) in terms of factors that drive program participation and causal impacts associated with PSA. This introductory chapter describes the concept of payments for environmental services with special attention to PSA. Previous evaluations of the program are reviewed, identifying key challenges for future evaluations (e.g. causation analysis under selection bias). This introduction also includes a conceptual framework that draws on the real options literature to identify factors expected to drive participation and to support basic hypothesis about the expected impact of the program on forest cover. The second chapter profiles participants and non-participants landowners in a selected case study region of Costa Rica, describes the process and determinants of enrolling in PSA, and characterizes landowners’ experience with the program qualitatively and with descriptive statistics derived from case studies and a survey conducted in 2005-2006. The third chapter analyzes the causal impact of PSA on forest cover at the individual farm level in the selected case study region, comparing results from propensity score matching with simple t-tests and OLS regressions. The fourth chapter analyzes the causal effect of PSA nationally applying binary and continuous matching to administrative data on the program, census data on socioeconomic characteristics, biophysical data from various sources, and various measures of change in forest cover derived from satellite images, all organized and analyzed at the level of census tracts.
1.1
PAYMENTS FOR ECOSYSTEM SERVICES
1.1.1 Concepts
5
and non-timber products, and (4) information functions that provide opportunities for cognitive development.3
Although forest goods and services benefit both local and global communities not all forest uses generate financial returns commensurate with their “true” economic value. This is because several forest benefits, notably environmental services, are not traded in markets and have no observable price (Landell-Mills and Porras 2002). The lack of payments for these services results in under-investment in the protection, management and establishment of forests. This under-investment results in the depletion of natural vegetation cover and soils, damaged watersheds and species extinction. These effects frequently result in substantial economic and social losses to society (Robertson and Wunder 2005).
As wilderness and natural habitats shrink, environmental services previously provided for free by nature are becoming increasingly threatened. This emerging scarcity makes them potentially subject to trade (Wunder 2005). In an effort to prevent such threat, some analysts and practitioners have called for the incorporation of environmental-service provision into standard economic valuations and, conversely, the use of direct incentives in conservation (Daily and Ellison 2002; Pagiola and Platais 2002). The logic of the argument underlying PES is as follows: when ‘free’ environmental services are made scarce by human exploitation, they obtain an economic value. External service users might want to compensate local resource managers to ensure that the services they need are provided in the future. Consequently, if such compensation is made, the local service providers receive an income for their additional protection efforts (Robertson and Wunder 2005). According to one view, the basic principle of PES is that those who provide environmental services should be compensated for the cost of doing so, whether these are direct costs of specific land use practices or more indirect opportunity costs of avoiding certain activities or types of land use (Grieg-Gran and Bann 2003). Others believe that PES should be a first-best direct-payment
3 Ecosystem functions refer variously to the habitat, biological or system properties or processes of ecosystems.
6
approach, and an incentive mechanism, used to purchase environmental services from local resource managers who otherwise would not provide the services (Ferraro and Simpson 2002; Wunder 2005). Mayrand and Paquin (2004) say that PES are relatively new schemes seeking to support positive environmental externalities through the transfer of financial resources from beneficiaries of certain environmental services to those who provide these services or are fiduciaries of environmental resources.
We can consider payment schemes for environmental services as flexible mechanisms, which can be adapted to different conditions. A number of PES schemes are currently operating around the world involving governments, business, government aid agencies, and non-governmental organizations. Landell-Mills and Porras (2002) review found almost 300 examples of PES schemes worldwide. These schemes involve governments, business, government aid agencies, and non-governmental organizations and most are still in their infancy (WWF 2006).4 To date, the four main environmental services that have been addressed by PES are watershed services, carbon sequestration, landscape beauty, and biodiversity conservation. These approaches have emerged largely by what is driving the scheme: conservation goals, social goals, market goals, or government goals.
1.1.2 The Costa Rican case
PSA was established in 1996 by Forestry Law No. 7575. This program grew out of an existing institutional structure of payments for reforestation and forest management, but contains several notable changes: (1) most payments are now for conservation of existing mature tropical forest with no harvesting allowed, (2) payments are justified and targeted to produce ecosystem services rather than to support the timber industry per se, and (3) funds come from both earmarked taxes and international donations (Sánchez-Azofeifa et al. 2007). Since its inception, PSA has contracted a cumulative total of nearly 600,000 hectares, of which nearly 90% is natural forest that landowners are paid to conserve (with the rest in reforestation, sustainable forest management, agroforestry contracts, among other
7
components).5 To receive a forest conservation contract, landowners must present a sustainable forest management plan. Once their plans have been approved, they begin to receive the annual payments. Currently conservation contracts pay US$320/ha/year over the five year lifetime of the contract which is renewable for another five years by mutual agreement. The minimum area to be included must be at least 2 hectares and no more than 300 hectares per year.
To implement PSA, several functions need to be fulfilled. The main functions are funding, making land available through farmers’ participation, generating awareness and knowledge about land conversion, and compliance control (Miranda et al. 2006). The 1996 Forestry Law assigned to the National Fund of Forest Financing (Fondo Nacional de Financiamiento Forestal, FONAFIFO), which is a subsidiary organization of the Ministry of the Environment (Ministerio del Ambiente y Energía, MINAE).6 The main objective of FONAFIFO is to get funds for PSA and other necessary activities to develop the natural resources sector (Forestry Law No 7575). FONAFIFO gets funding from different sources. So far, the fossil fuel tax is the main source of funding. According to Law No 8114 from 2001, FONAFIFO annually receives 3.5% of the fossil fuel tax raised by the Costa Rican government. FONAFIFO also receives funds from the sale of carbon bonds by the Costa Rican Office for Joint Implementation (OCIC), another subsidiary body of MINAE on the international market (for instance to Norway, see Miranda et al. 2003). Moreover, FONAFIFO has received funding from the GEF to protect territories included in the Mesoamerican Biological Corridor and from private hydropower companies and a beverage company (Florida Ice & Farm), which want to prevent erosion in the catchments in which they are located. These contributions are transferred through PSA to landowners in the watersheds.
5 According with the Global Forest Resources Assessment published by FAO, in 2005 46.8% of the total land
area of Costa Rica was covered by forest which corresponds to 2,391,000 ha.
6 Since its inception, PSA has passed throughout different administration phases. Between 1997 and 2002, the
8
1.1.3 Previous evaluations of PSA and key challenges for future evaluations
Reactions to PES in conservation and rural-development circles have been mixed. Advocates of PES stress that innovation in conservation is urgently needed because current approaches provide too little value for money, that PES can provide (especially private sector) conservation funding, and that poor service selling communities can improve their livelihoods (Wunder 2007).
Evaluation of PES causal effect must face several challenges. When buying an environmental service, it is not completely evident what is being paid for. Because the environmental services are provided over time, one always needs to have an idea about what would hypothetically happen without the PES scheme (i.e. construct some counterfactual service baseline). Unfortunately, PES programs usually do not include clear, explicit frameworks for monitoring and evaluation the degree of their own success−a regrettable feature they share with other conservation interventions (Ferraro and Pattanayak 2006; Wunder 2007). Rigorous, empirical evaluation methods are required to establish whether PES schemes have been effective with the key challenge of establishing the counterfactual: what would have happened without the payments?
In the context of the Costa Rican program, estimating the PSA counterfactual is complicated because landowners volunteer to participate in PSA and program administrators often actively target the contracts. When the characteristics that affect who receives a contract (e.g. land use profitability and landowner preferences) also affect land use decisions, any direct comparison of program participants and non-participants would suffer from “selection bias” which can either over-state or under-state the impact of the program (Sills et al. forthcoming).
9
(iii) paying for adoption of practices that would have been adopted anyway. The type and size of payments provided by a PES program affect the likelihood of these problems arising. PSA offers a relatively low, undifferentiated, and mostly un-targeted payment. Thus it will only tend to attract participants whose opportunity cost of participation is low. Such a program is very likely to experience the first type of problem, in which socially-desirable land use practices are not adopted because the payment offered is insufficient. Being undifferentiated and untargeted, the program will also attract many land users who would have adopted the desired practices anyway (third problem). The relatively low payments mean, however, that the program is unlikely to induce the adoption of socially inefficient land uses on a significant scale (second problem) (Pagiola 2008).
Counterfactual estimation is also complicated in the context of PSA because when the program was created Costa Rica already had in place a system of payments for reforestation and forest management, and the institutions to manage it. The Forest Law was built on this base, with two major changes. First, it changed the justification for payments from support for the timber industry to the provision of environmental services. Second, it changed the source of financing from the government budget to an earmarked tax and payments from beneficiaries (Pagiola 2008). In other respects, the PSA program was very similar to previous forest sector incentives. Until 2000, the activities financed under the PSA program closely paralleled those financed by previous instruments: timber plantations, sustainable forest management, and forest conservation. Many details of implementation, such as payment amounts and scheduling, were also carried over from earlier programs. Indeed, at first CAF certificates were used to pay PSA program participants (Pagiola 2008).7 Evaluations of program impact must be able to isolate the causal effect of PSA from the effect of these previous forestry programs.
In an expert evaluation of PSA, Hartshorn et al. (2005) identified important accomplishments of the program including maintenance of privately-owned forests in areas of conservation significance; facilitation of private transfers of funds to rural landowners who
10
agree to protect their forests; encouragement of female landowner and indigenous community participation; direct payments to a relatively greater number of small rural landowners; and, most importantly, broad public recognition that intact forests and their environmental services have value. However, they also noted that it is difficult to determine whether and to what degree the program has contributed to the conservation and expansion of forest cover in Costa Rica, its primary objective. In fact, PSA implementation coincides with an extremely low national rate of gross deforestation (Castro 1998; Sánchez-Azofeifa et al. 2001; Kerr et al. 2002; Kleinn 2002). Sánchez-Azofeifa et al. (2007) conclude that PSA in its initial years (1997-2000) payments were distributed broadly across ecological and socio-economic gradients, but the 1997-2000 deforestation rate was not significantly lower in areas that received payments. These authors also conclude that other successful Costa Rican conservation policies, including those prior to PSA, may explain the current reduction in deforestation rates. Pfaff et al. (2008) find a very small impact on deforestation from payments for environmental services in Costa Rica. They also conclude that most PSA participants had negative returns to deforestation, i.e. were not going to clear their land anyway given all of the factors in clearing decisions other than PSA. Sierra and Russman (2006) report that conservation impacts are indirect and realized with considerable lag because they are mostly achieved through land use decisions affecting non-forest land cover. Tattenbach et al. (2006) concludes that PSA reduces deforestation.
11
characteristics that affect program participation and outcome without including socio-economic controls and explanatory variables of program targeting.
Measuring avoided deforestation is one way to evaluate the effectiveness of PSA in providing environmental services (assuming that more forest cover implies more provision of services). However, I have explained that measurement is complicated because “avoided deforestation” is a counterfactual event and cannot be observed. The analyst must construct the counterfactual - the deforestation that would have occurred if an area of forest were not protected by PSA - from observations or theory. In this dissertation, I design and interpret rigorous program evaluation of PSA at the property and census tract level using different matching techniques to construct the counterfactual (as advocated by Ferraro and Pattanayak 2006). I apply these methods to data from a survey of landowners in a case study region in order to estimate the impact of participation in the first phase of the PSA program (1997 – 1998) controlling for socio-economic and biophysical observable characteristics that influence program participation, but also may potentially affect program outcome (e.g. deforestation). Then, the impact analysis is extended to the whole country and including forest conservation contracts signed between 1998 and 2004. In this national analysis, biophysical and socio-economic controls are combined with determinants of program targeting using census tracts as the unit of observation.
1.2
OBJECTIVES
This dissertation is motivated by the policy debate over the effectiveness of direct payments for environmental services. This dissertation contributes to that debate by analyzing the causal impact of the Costa Rican Program of Payments for Environmental Services on forest cover, considering different dimensions and different ways of measuring change in forest cover. The two primary objectives are:
12
2) Estimate the causal effect of PSA contracts on forest cover – as determined from satellite images – at the level of the census tract, for the entire nation of Costa Rica. Three supporting objectives are:
3) Develop a conceptual framework of how land use decisions are affected by the availability of a direct conservation payment, incorporating issues of irreversibility, uncertainty and ability to delay associated with the program participation decision. 4) Describe the process and determinants of participation in PSA, in detail for the case
study region of Sarapiquí, and in terms of broad spatial and temporal variation in implementation across different regions of Costa Rica.
5) Demonstrate the feasibility of the application of rigorous program evaluation to payments for ecosystem services, including different methods for sampling, defining treatment and matching.
1.3
DISSERTATION
OVERVIEW
13
derived from satellite images. Both chapters 3 and 4 describe, apply, and compare results from various matching methods to each other and to multivariate OLS. In both cases, participation is defined based on administrative records from the program, and covariates are drawn from various sources including the Costa Rican Atlas, a survey of landowners in Sarapiquí, and the national census.
1.4
CONCEPTUAL
FRAMEWORK
For centuries societies have debated the appropriate balance of public and private interest in property in general, and more recently the debate has also addressed the issue of environmental protection, and the extent of the public interest in restricting the conversion of land (Tegene et al. 1999).
Forest conservation is an investment in natural capital that yields environmental benefits (e.g. biodiversity protection and tourism benefits), as well as net revenues from the sustainable harvests of non-timber forest products. Governments and land trust secure environmental service flows using several methods, including land use regulation, fee simple ownership, and conservation easements or contracts (Fackler et al. 2007). PSA gives us an example of the use of conservation contracts that promote forest conservation through direct payments to forest owners.
14
price is also uncertain. Bulte et al. (2002) model uncertainty associated with conservation benefits as a geometric Brownian motion, and provided a numerical application of quasi-option value to the management of tropical forests. Behan et al. (2006) explore the dynamics of agricultural producers’ decisions in switching land from traditional agriculture to forestry using a real options model and found that increasing the present value of a stream of profits from forestry relative to that of traditional agriculture reduces the optimal transition period to forestry.
When the conditions of irreversibility, uncertainty, and ability to delay are met, a decision is said to entail an implicit option for the value of waiting (Dixit and Pindick 1994). The conceptual framework in this section will explore the forest conservation impact of two scenarios: with and without the introduction of a policy instrument (e.g. PSA) that pays forest landowners to conserve their forest. Time trends, uncertainty about forest conservation and development benefits, and the value of waiting will be included in the analysis. The final objective is to develop a stochastic model that can be used to analyze the impact of PSA on tropical deforestation including uncertainties concerning the benefits of different land use options (e.g. forest conservation vs. agriculture) using a real options framework where it is incorporated the uncertainty about future benefits and benefits of delaying land development.
In order to determine the effect that a conservation contract (i.e. a PSA contract) will have on a landowner that voluntarily agree to keep a parcel of land in less intensive use (e.g. forest conservation) in exchange for a direct payment, we need to understand the decision faced by the owner of land on which multiple uses are possible. Consider a parcel of land with forest in different stage of its transition to become a mature natural forest.8 The owner of this parcel faces three basic alternatives:
8 This assumption makes the conceptual framework suitable to be adapted to explain PSA impact on Costa
15
1. He/she could keep the land forested without conveying a conservation contract, thereby retaining the option to develop the land or convey a conservation contract at some point in the future.
2. He/she could convey a conservation contract and foreclose the option of developing the land during the length of the PSA contract.
3. He/she could develop his/her land (i.e. switch from forest land use to another alternative use) or sell the land for development, making it likely (but not certain) that the land would be developed in the future.
The third alternative represents an irreversible investment decision, at least in the short run in the context of tropical deforestation, since conversion of forest to other land uses constitutes in some respects an irreversible event.
In this analysis, the farmer is a firm facing an investment decision (e.g. deforestation), a firm that has assets (mainly labor and land) and chooses the best use of these assets given its knowledge of product markets and related costs. I will assume that landowners dynamically maximize utility over development9 and conservation land uses, and that converting to one use precludes use of the other. Landowners are uncertain about future returns to development, and are not obligated to act. For a choice (i.e. develop or conserve) to be optimal, the landowner must receive at least the opportunity cost of the decision, i.e., the minimum willingness to accept a conservation contract. This opportunity cost includes the option values that account for uncertainty (i.e. quasi-option value) and the value of waiting irrespective of uncertainty.
The landowner who decides to enroll in PSA must enter into a -year contract. This nature of PSA characterizes the irreversibility effect of the program participation decision which is not in this a case a perpetual effect as it is normally the case with conservation
9 Development will refer to any other alternative land use beside forest conservation (e.g. agricultural
16
easements. Land development, which involves conversion of forest to other land uses, also represents in some respects an irreversible decision since deforestation can be considered an irreversible event at least in the short run. In this particular case, irreversibility means that converting today entails not only forfeiting the conservation use of the parcel and reception of a direct conservation payment, but also giving up possible new information in the future- such as changes in government policies, food prices, uncertainty about forest conservation benefits - that might influence the timing and profitability of converting. Hence, in addition to the cost of conversion and the loss of conservation value, there is an additional opportunity cost of converting today instead of waiting and keeping the conversion option alive for future possibilities (Tegene et al. 1999).10
In sum, the decision to participate in PSA involves uncertainty because the economic and environmental conditions underlying future net returns to conservation and development uses are unknown today. PSA participation decisions are also not a now-or-never proposition and participation decisions can be delayed to take advantage of new information about changing initial conditions.
Following Tegene et al. (1999) and Behan et al. (2006), let’s consider a landowner that owns a piece of land and derives at time t a profit stream worth F (i.e. private net returns obtained from forest). Let net returns to development use be N per acre. For simplicity, I assume that profits from development grow at constant rate μ. The landowner’s discount rate is r (r > μ by assumption).
I assume that the landowner is interested in maximizing net returns in a competitive setting, but the landowner has now the option to sign a -year PSA contract now or at some point in the future. First, I consider the value of forest land which cannot be converted to agriculture. The value of this land per acre at time t = 0, Vf(0), is as follows:
17
0 (1.1)
The landowner has the option to switch to development. In this case, the value of land in development use per acre at time t=0, Vd(0), is as follows:
0 (1.2)
I assume that the landowner owns natural forest, and then this land could or could not be converted to development at some arbitrary future time T. The value of this convertible land per acre at time t = 0, Vc(0), is as follows:
0
1 ,
(1.3)
where C represents land conversion cost.
The first term on the right-hand side (RHS) of (1.3) is the present value of the stream of forest profits until the date of conversion (i.e. T). The second term is the present value of the stream of development profits from the date of conversion onward. The last term is the present value of the cost of conversion, C, at time T. Results of equation (1.3) can be re-written as:
0 (1.4)
The first term on the RHS of (1.4) represent the present value of perpetual forest profits. The second term shows the value of landowner’s option to convert the land to development. In this case the value of convertible land is the sum of the present value of perpetual forest value (i.e. private profits) plus an option value. In the context of a direct conservation payment initiative like PSA, the option value, VC(0) − F/r, is the payment that a
18
his land. In the context of PSA, the option value would represent the payment that would be necessary to make the landowner to give up his right to deforest.11
Given the equations (3) and (4), the landowner will choose the optimal date of conversion T in order to maximize the discounted net returns. If I differentiate (1.3) or (1.4) with respect to T, setting the result equal to 0, and solving for the optimal conversion date (i.e. T*), gives:
1 , 0 (1.5)
As one might expect, high forest profits and high conversion costs delay deforestation while high development returns or faster growth of N speed up the conversion process by bringing forward the date of deforestation.
In the scenario with PSA, the landowner has now the option to sign a -year PSA contract now or at some point in the future. In this case, the value of land in PSA per acre at time t = 0, Vp(0), is as follows:
0 , (1.6)
where P is the payment established in the PSA contract. I consider that the land use restrictions imposed in the PSA contract makes the program participation an irreversible decision for the duration of the contract. In the context of PSA, irreversibility means forfeiting the right to receive returns from forest management or to convert the land and receive returns from alternative uses, as well as giving up potentially valuable new information in the future about conservation and development benefits.
Let’s consider now the value of convertible land when facing the alternative of signing a -year PSA contract. The value of this land per acre at time t = 0, Vcp(0) is:
19
0 (1.7)
Equation (1.7) tells that the landowner decides to sign a -year PSA contract in year T, and then he decides to convert his land after participation at year T+ .12 Solving the integration in (8) gives:
0 1
(1.8)
The first term in the RHS of equation (1.8) is the present value of perpetual net forest returns (which is the payoff in the no-PSA and no-deforestation scenario). The second term represents the payoff that a landowner will receive if he decides to sign a -year PSA contract at t = T. The last term represents again the value of the landowner’s option to convert the land to another alternative use. In this case, the option value is equal to 0
which represents the compensation value a well-informed landowner would
require if the landowner was to give up his right to develop the land (see Tegene et al. 1999).
Facing the alternative of participating in PSA, the landowner chooses the optimal date of conversion T+ to maximize the value of land given by equation (1.8). Differentiating equation (1.8) with respect to T+ , setting the results equal to 0, and solving for the optimum conversion date (denoted Tpsa in this case), gives:
1 , 0 (1.9)
12 T can depend on what stage of the forest transition the forest is. If we start with bare land, more years will be
20
The optimum conversion date shown in (1.9) does depend on PSA payments (i.e. P). As one might expect, higher PSA payments and higher conversion costs delay deforestation while higher development returns or faster growth of N speed up the conversion process by bringing forward the deforestation date. In the language of real options, Towe et al. (2008) find that the mere existence of an option to preserve farmland delays decisions to convert farmland to developed uses. They conclude that such delays allow local governments to improve infrastructure or implement stricter growth control measures, benefits of a preservation option may be even more long term. This is certainly the case of the introduction of a direct conservation payment. Interpretation of this conceptual framework suggests that one should observe more forest cover in land protected by the program.13
The introduction of a direct conservation payment affects the optimum conversion date. The landowner will convert immediately (i.e. Tpsa = 0) only if development returns (N)
are equal or exceed N*psa, where:
(1.10)
In sum, landowners facing a decision to convert land use in a scenario with a policy instrument that pays directly forest owners to protect their forest will be affected by the level of these direct conservation payments and also by factors that influence conversion costs, and development returns.
In the analysis of causal effects of PSA, estimation of the missing counterfactual is key to obtain estimates of program impact. However, counterfactual estimation needs to address selection bias especially in cases like PSA where characteristics that affect program
13 Extensions of this conceptual framework could also include the stochasticity in implementation of PSA
21
participation also can affect program outcome. In that sense, the conceptual framework developed in this section gives important information that can feed the selection of appropriate controls during the estimation of what would have happened had land not protected by PSA. These results will be considered in the rest of this dissertation.
1.5
BIBLIOGRAPHY
Behan, J. McQuinn, K. and M. Roche. (2006). Rural land use: traditional agriculture or forestry? Land Economics 82(1): 112-123.
Bulte, E. Lipper, L. Stringer, R. and D. Zilberman. (2008). Payments for ecosystem services and poverty reduction: concepts, issues, and empirical perspectives. Environment and Development Economics 13: 245-254.
Bulte, E. van Soest, D. van Kooten, C. and R. Schipper. (2002). Forest conservation in Costa Rica when nonuse benefits are uncertain but rising. American Journal of Agricultural Economics 84(1): 150-160.
Castro, R. Tattenbach, F. Gámez, L. and N. Olson. (1998). The Costa Rican experience with market instruments to mitigate climate change and conserve biodiversity.
FUNDECOR, San José, Costa Rica.
Claassen, R. Cattaneo, A. and R. Johansson. (2008). Cost-effective design of
agri-environmental payment programs: U.S. experience in theory and practice. Ecological Economics 65: 737-752.
Conrad, J. (2000). Wilderness: options to preserve, extract, or develop. Resource and Energy Economics 22: 205-219.
Costanza, R. d’Arge, R. de Groot, R. Farber, S. Grasso, M. Hannon, B. Limburg, K. Naeem, S. O’Neill, R. Paruelo, J. Raskin, R. Sutton, P and M. van den Belt. (1997). The Value of the World’s Ecosystem Services and Natural Capital. Nature 387:253-260. Daily, G. and Ellison, K. (2002). The new economy of nature: the quest to make conservation
22
De Groot, R. Wilson, M. and R. Boumans. (2002). A typology for the classification, description and valuation of ecosystem functions, goods and services. Ecological Economics 41: 393-408.
Dixit, A. and R. Pindyck. (1994). Investment under uncertainty. Princeton University Press, Princeton, NJ, USA. 468p.
Engel, S. Pagiola, S. and S. Wunder. (2008). Designing payments for environmental services in theory and practice: An overview of the issues. Ecological Economics 65(4): 663-674.
Fackler, P. Brimlow, J. and E. Mercer. (2007). Real options approaches to conservation easements. Department of Agricultural and Resource Economics, North Carolina State University, Raleigh, NC. Working paper. 38p.
FAO. (2006). Global forest resources assessment. FAO Forestry Paper No 147. Rome, Italy. Feather, P. Hellerstein, D. and L. Hansen. (1999). Economic valuation of environmental,
benefits and the targeting of conservation programs: the case of the CRP. Agricultural Economic Report, vol. 778. U.S. Department of Agriculture, Economic Research Service, Washington, DC. 56 p.
Ferraro, P. and S.K. Pattanayak. (2006). Money for nothing? A call for empirical evaluation of biodiversity conservation investments. PLoS Biol 4(4): 482-488.
Ferraro, P. and Simpson, D. (2002). The cost-effectiveness of conservation payments. Land Economics 78(3): 339-353.
Forest Trends and the Ecosystem Marketplace. (2008). Payments for ecosystem services: market profiles. In:
http://ecosystemmarketplace.com/documents/acrobat/PES_Matrix_Profiles_PROFOR .pdf
Goodwin, B. and Smith, V. (2003). An ex post evaluation of the conservation reserve, federal crop insurance, and other government programs: program participation and soil erosion. Journal of Agricultural and Resource Economics 28(2): 201-216. Grieg-Gran, M., and Bann, C. (2003). A closer look at payments and markets for
23
Environmental Services, a survey of financing options for sustainable natural
resource management in developing countries. WWF Macroeconomics for Sustainable Development Programme Office. Pages: 27-40.
Hartshorn, G. Ferraro, P. and B. Spergel. (2005). Evaluation of the World Bank – GEF Ecomarkets Project in Costa Rica. North Carolina State University. Raleigh, NC. Kerr, S. Pfaff, A. and G.A. Sánchez–Azofeifa. (2002). The dynamics of deforestation:
evidence from Costa Rica. Motu Economic and Public Policy Research Manuscript. Wellington, New Zealand. 31p.
Kleinn, C. Corrales, L. and D. Morales. (2002). Forest area in Costa Rica: a comparative study of tropical forest cover estimates over time. Environmental Monitoring and Assessment 73:17-40.
Kluender, R., Walkingstick, T., and Pickett, J. (1999). The use of forestry incentives by nonindustrial forest landowner groups: is it time for a reassessment of where we spend our tax dollars? Natural Resources Journal 39: 799-818.
Landell-Mills, N. and I. Porras. (2002). Silver Bullet or Fools' Gold? A Global Review of Markets for Forest Environmental Services and Their Impact on the Poor. Institute for Sustainable Private Sector Forestry. London. 254p.
Mainka, S. McNeely, J. and W. Jackson. (2008). Depending on nature: ecosystem services for human livelihoods. Environment 50(2): 42-55.
Mayrand, K. and M. Paquin. (2004). Payments for Environmental Services: A Survey and Assessment of Current Schemes. Unisféra International Centre for the Commission for Environmental Cooperation of North America.
Millennium Ecosystem Assessment. (2005). Ecosystems and human well-being: current state and trends: findings of the condition and trends working group. Island Press. 160p. Miranda, M., Porras, I. and Moreno, M. (2003). The social impacts of payments for
24
Miranda, M., Dieperink, C. and Glasbergen, P. (2006). Costa Rican environmental service payments: the Use of a financial instrument in participatory forest management. Environmental Management 38: 562-571.
Pagiola, S. (2008). Payments for environmental services in Costa Rica. Ecological Economics 65(4): 712-724.
Pagiola, S. (Forthcoming). Assessing the efficiency of payments for environmental services programs. The World Bank, Washington, DC.
Pagiola, S. and G. Platais. (2002). Payments for environmental services. Environment Strategy Notes No 3. The World Bank Environment Department, Washington DC, USA.
Pattanayak, S.K. and D.T. Butry. (2005). Spatial complementary of forests and farms: accounting for ecosystem services. American Journal of Agricultural Economics 87(4): 995-1008.
Pindyck, R. (1984). Uncertainty in the theory of renewable resource markets. Review of Economic Studies 51(2): 289-303.
Pfaff, A. Robalino, J. and G.A. Sánchez-Azofeifa, G. (2008). Payments for environmental services: empirical analysis for Costa Rica. Working Paper Series SAN08-05. Terry Sanford Institute of Public Policy. Duke University, Durham, NC. 25p.
Reichelderfer, K. and W.G. Boggess. (1988). Government decision making and program performance: the case of the Conservation Reserve Program. American Journal of Agricultural Economics 70: 1–11.
Robertson, N. and S. Wunder. (2005). Fresh tracks in the forest: assessing incipient payments for environmental services initiatives in Bolivia. CIFOR, Bogor, Indonesia. 137p. Sánchez-Azofeifa, G.A. Harris, R.C. and D.L. Skole. (2001). Deforestation in Costa Rica: a
quantitative analysis using remote sensing imagery. Biotropica 33(3): 378-384. Sánchez-Azofeifa, G.A. Pfaff, A. Robalino, J. and J. Boomhowerb. (2007). Costa Rica’s
25
Sierra, R. and E. Russman. (2006). On the efficiency of environmental service payments: a forest conservation assessment in the Osa Peninsula, Costa Rica. Ecological
Economics 59:131-141.
Sills, E. Arriagada, R. Ferraro, P. Pattanayak, S. Carrasco, L. Ortiz, E. Cordero, S. and K. Andam. (Forthcoming). Impact of the PSA Program on Land Use. In G. Platais and S. Pagiola (eds.) Ecomarkets: Costa Rica’s Experience with Payments for
Environmental Services. The World Bank, Washington, DC.
Smith, K. and M. Weinberg. (2004). Measuring the success of conservation programs. Amber News 2(4): 14-21. Economic Research Service, USDA.
Tattenbach, F. Obando, G. and J. Rodríguez. (2006). Mejora del excedente nacional del pago de servicios ambientales. FONAFIFO, San José.
Tegene, A. Wiebe, K. and B. Kuhn. (1999). Irreversible investment under uncertainty: conservation easements and the option to develop agricultural land. Journal of Agricultural Economics 50(2): 203-219.
Towe, C. Nickerson, J. and N. Bockstael. (2008). An empirical examination of the timing of land conversions in the presence of farmland preservation programs. American Journal of Agricultural Economics 90(3): 613-626.
Wu, J. (2000). Slippage effects of the Conservation Reserve Program. American Journal of Agricultural Economics 82(4): 979-992.
Wu, J. Adams, R. Kling, C. and K. Tanaka. (2004). From microlevel decisions to landscape changes: an assessment of agricultural conservation policies. American Journal of Agricultural Economics 86(1): 26-41.
Wunder, S. (2005). Payments for environmental services: some nuts and bolts. CIFOR Occasional Paper 42. Bogor, Indonesia.
Wunder, S. (2007). The efficiency of payments for environmental services in tropical conservation. Conservation Biology 21(1): 48-58.
26
Chapter 2
COMBINING QUALITATIVE AND QUANTITATIVE METHODS TO
EVALUATE PARTICIPATION IN COSTA RICA'S PROGRAM OF
PAYMENTS FOR ENVIRONMENTAL SERVICES
2.1
INTRODUCTION
Forests provide multiple services, including conservation of biological diversity, soil and water; supply of wood and non-wood products; provision of recreation opportunities; and storage and sequestration of carbon. Deforestation and forest degradation can irreversibly and substantively impair the ecosystem functions of forests. Examples from situations where this natural degradation has occurred raises the question of why society and governments would allow rapid or excessive deforestation (Pattanayak and Butry 2005). In fact, deforestation, mainly conversion of forests to agricultural land, continues at an alarmingly high rate – about 13 million hectares per year (FAO 2005) despite billions of dollars having been invested in conservation worldwide (James et al. 2001; Hardner and Rice 2002).
27
ecosystem management involves externalities, and ecosystems are often the only capital of the poor who have no money or political voice (Pattanayak and Wendland 2007).
In response to the degradation of forest ecosystems, the global area of forest designated principally for the conservation of biological diversity has increased by an estimated 96 million hectares since 1990 and now accounts for 11% of the total world’s forest area (FAO, 2005). These forests are mainly, but not exclusively, located inside protected areas. Costa Rica shows the same positive trend in forested area devoted to biodiversity conservation. As shown in Table 2.1, the area designated for biodiversity conservation grew 66% between 1990 and 2005.
According to Table 2.1, 58% of the total forest area in 1990 was of multiple purposes compared with 74% for 2005. Much of these forests under “multiple use” in Costa Rica are privately owned. These lands have the potential to provide services such as biodiversity and watershed protection, landscape beauty, and carbon sequestration if they are managed accordingly. In response, the forestry laws were revised through a long-term process that enabled the establishment of an institutional framework for forest policy with a solid legal, organizational, and social base (Miranda et al., 2003; Miranda et al., 2006). Within this new legal framework, it was formally recognized the potential of private lands to provide environmental services and launched a system of payments for environmental services called Costa Rican Program of Payments for Environmental Services (Program de Pagos por Servicios Ambientales, PSA) which is a formal economic recognition of the owners of natural forests and plantations for the environmental services that their natural areas provide to society (Rodríguez 2001).
28
concept of a "subsidy" or "incentive" for the forestry sector, replacing it with the idea of "economic compensation" for the environmental services provided by forests, thereby recognizing their ecological, social, and economic value. Table 2.2 shows the amount of land and payments assigned to the different components of PSA.
In order to assess the program’s impact on some outcome of interest (e.g. forest cover), it is critical to understand landowner motivations for participating in the program, together with a detailed description of the enrollment process. In fact, the key elements that are critical to the success of incentive-based programs include ensuring effective demand and a thorough understanding of participants’ motivations to enroll. Information with regards to these issues can help to ensure the future sustainability of PSA.
29
PSA, we first need to understand how landowners come to participate in the program, so that we can control for differences between participants and non-participants (Sills et al. 2007).
In this paper, I describe the first nation-wide and long-term program of payments for environmental services from tropical forests and describe the factors that drive landowner participation in this program, based on an integrated qualitative and quantitative field research in Costa Rica. Specifically, I describe the main driving forces of enrollment in PSA using an iterative qualitative approach. I consider case studies of landowners in the Sarapiquí Region of Costa Rica combined with semi-structured interviews of forest officials and local professionals in order to gain an understanding of the enrollment process, program administration, and motivations for participation. This qualitative component was then combined with a quantitative survey that interviewed 50 program participants and 150 non-participants in the Sarapiquí Region.
2.2
METHODS
2.2.1 Integrating Qualitative and Quantitative Methods in Program Evaluation
30
factors that influence the enrollment decision. Ultimately, this mixed method approach can generate a contextualized understanding of PSA participation in Costa Rica.
The approach analysis in this study parallels recent calls for participatory econometrics (Rao and Woolcock 2003; Swann 2006), in which the investigator returns to the field to clarify questions and resolve anomalies. Data collection is combined with detailed observation and conversation to elicit knowledge about participant motivations. By using visits to PSA participants and non-PSA participants, we also seek to clarify aspects of the quantitative data (e.g. motivation to participate) to better define the economic environment and to collect complementary data (e.g. data on land characteristics and georeferenced data of property boundaries). Collectively, these lead to better answers to a key research question:
what factors motivate participation in PSA?
As Rao and Ibáñez (2005) emphasize in their study of the social fund program in Jamaica, in-depth data on participation is traded off with the size and representativeness of the sample. Thus, our findings should not be read as a comprehensive evaluation of PSA that can be applied to the rest of the country.
2.2.2 Case Studies
31
Qualitative interviewing techniques such as the prototypical case-study approach draw on the results of small-sample surveys (Miranda et al. 2003; Ortiz et al. 2003; Miranda et al. 2006) and explore key elements of program participation. In general, case studies are designed to bring out details from the viewpoint of the participants by using multiple sources of data (Tellis 1997). Thomas (2004) suggests that there are three main purposes in conducting a case study: exploratory, explanatory, and theory-testing. Our case studies are exploratory. We use the exploratory case when we know little or nothing about the phenomenon of interest which is the case in explaining driving forces in PSA participation decision. The explanatory case produces grounded theory that can carry more conviction than a theory developed in the abstraction of what happened in the field. Finally, the theory-testing case is used to test a prior theory. In a situation where we have little understanding of the phenomenon of interest, the numbers of mechanisms for research are limited (Swann 2006).
During the summer of 2005 and spring of 2007, a series of in-depth interviews were carried out in the northeast part of Costa Rica. Interviews and field observations were developed with participants and non-participants in PSA with the main purpose of trying to understand the main motivations behind enrollment within the program. I also interviewed government officials, forest professionals, and local authorities and carried out a review of documentation (e.g. titling documents and PSA contracts), observation of properties, which included the collection of GPS points throughout property boundaries in order to follow recommendations from Yin (1994), Rao and Woolcock (2003), Udry (2003), and Berg (2004).