DOI: 10.1534/genetics.104.027532
Genetics Software
Genome Image Programs: Visualization and Interpretation of
Escherichia coli
Microarray Experiments
Daniel P. Zimmer,*
,1Oleg Paliy,*
,2Brian Thomas,
†Prasad Gyaneshwar* and Sydney Kustu*
,3*Department of Plant and Microbial Biology, University of California, Berkeley, California 94720 and †College of Natural Resources, University of California, Berkeley, California 94720
Manuscript received February 11, 2004 Accepted for publication April 21, 2004
ABSTRACT
We have developed programs to facilitate analysis of microarray data inEscherichia coli. They fall into two categories: manipulation of microarray images and identification of known biological relationships among lists of genes. A program in the first category arranges spots from glass-slide DNA microarrays according to their position in the E. coligenome and displays them compactly in genome order. The resulting genome image is presented in a web browser with an image map that allows the user to identify genes in the reordered image. Another program in the first category aligns genome images from two or more experiments. These images assist in visualizing regions of the genome with common transcriptional control. Such regions include multigene operons and clusters of operons, which are easily identified as strings of adjacent, similarly colored spots. The images are also useful for assessing the overall quality of experiments. The second category of programs includes a database and a number of tools for displaying biological information about manyE. coli genes simultaneously rather than one gene at a time, which facilitates identifying relationships among them. These programs have accelerated and enhanced our interpretation of results fromE. coliDNA microarray experiments. Examples are given.
D
URING the past decade research in the field of 2000). To complement the tools available, we have de-molecular biology has gradually shifted from the veloped simple programs for visualizing gene expres-analysis of single genes to the expres-analysis of whole genomes, sion patterns inE. coliin their genomic context and for transcriptomes, and proteomes. The availability of full identifying known biological relationships among lists genome sequences for many organisms together with of genes (Zimmer et al. 2000; Wendisch et al. 2001; the development of microarray technology has allowed Soupeneet al.2003). These are particularly helpful to researchers to compare simultaneously mRNA levels for biologists who wish to interpret relatively small numbers each gene in an organism under different conditions of experiments.or in different cell types or strains. Given that even a single experiment generates thousands of spots and
numerical values (e.g.,ⵑ4400 for the genes ofEscherichia MATERIALS AND METHODS
coli), analysis of the data has necessitated the
develop-Experimental methods, data acquisition, and storage of data
ment of a variety of tools. More than 50 different
com-in AMAD:Growth ofE. colicultures, isolation of total RNA,
mercial, shareware, and free software products are cur- cDNA synthesis and labeling with Cy3 (green fluorescence) rently available (for a brief summary, see Goodman or Cy5 (red fluorescence), hybridization to glass-slide DNA
2002), most of which focus on statistical normalization microarrays, and scanning of the data were carried out as described (Zimmeret al.2000). TIFF images (ⵑ7 MB each,
and analysis of numerical data. Powerful statistical
clus-10-m resolution) representing fluorescence intensities for
tering algorithms have been developed for interpreting
the Cy3- and Cy5-labeled cDNAs hybridized to slides were
data from many experiments (reviewed in Sherlock generated using a GenePix scanner (Axon Instruments, Union
City, CA). These images were overlaid and analyzed in Scana-lyze 2.x (http://rana.lbl.gov/EisenSoftware.htm) or GenePix 3.0. Global intensity normalization was used to calculate a
1Present address:Microbia, Cambridge, MA 02139.
normalization factor for each pair of images (Schenaet al.
2Present address:Department of Biochemistry and Molecular Biology,
1995) and the image intensities were normalized accordingly Wright State University, Dayton, OH 45435.
in Scanalyze. The normalized overlaid image was then saved
3Corresponding author:Plant and Microbial Biology, 111 Koshland
as a bitmap image, which was converted to an 8-bit color GIF Hall, University of California, Berkeley, CA 94720-3102.
E-mail: [email protected] image and then to a portable network graphic file (PNG)
using standard image manipulation software. At this point, corresponding rows from each of the genome images to gener-ate a new larger image of the data with rows of spot images some of the quantitative information is lost.
Glass-slide DNA microarray data were stored in AMAD (An- aligned. A generalized version of the genome image alignment other MicroArray Database; http://www.microarrays.org/AMAD program works as follows: (1) The user is first prompted for Faq.html). AMAD, developed by Joe DeRisi, is a flat file data- the number of genome images he would like to align, and base written in Perl and JavaScript that allows storage and then (2) on a second page the user must upload all of the retrieval of raw scanned slide images and extraction of numeri- images to be aligned, preferably in PNG format, and must cal data. upload the ORDER file described above. Currently a maxi-Generation of genome images:Genome images were built mum of 12 images can be aligned, but this can be reconfigured on AMAD as a core component. All image-manipulating at local installations. The generalized version of the genome scripts were written in Perl programming language (Wallet image alignment program can be run or downloaded from al.2000), with the CGI.pm and the GD.pm modules of Lincoln http://coli.berkeley.edu/genomeimages/.
Stein (http://stein.cshl.org/WWW/software/) installed. The AMAD core database of DeRisi (accessible through a From the PNG files described above, the program that gen- web-based interface) allows the user to extract from multiple erates genome images extracts rectangles containing the spots experiments lists of genes corresponding to spots that fulfill and arranges them according to theirE. colib number (Blatt- specified criteria,e.g., have a normalized median red-to-green
neret al.1997). ForE. colimicroarrays, the resulting genome (R/G) ratio higher than a specified cutoff value. Outputs can images contain 45 rows of 100 spots/row, with each spot in a be saved directly to the local computer.
10-pixel square (the original size of the scanned spot). The The E. coli Entry Point database:The E. coliEntry Point output of the program is a PNG “genome image” file and an programs are written in Perl using the CGI.pm module. Data HTML document containing an image map of the b numbers, are stored in a MySQL database (http://www.mysql.com/) and gene names, gene descriptions, and links to the raw data. The accessed using the DBI.pm and DBD::MySQL Perl modules image is stored in a local database along with raw data files, (DescartesandBunce2000; http://www.cpan.org/modules/ and both can be easily accessed through a web-based interface by-module/DBI/; http://www.cpan.org/modules/by-module/ that is provided. By clicking on a spot in a genome image, DBD/). TheE. coliEntry Point is composed of a main script the user is transferred to theE. coliEntry Point (see below), and several subsidiary scripts. Their functions, features, and which allows quick access to biological information on the data resources, which can be accessed at http://coli.berkeley. gene corresponding to this spot. edu/genomeimages/, are outlined below, along with those On a separate page the user can display a list of genes of the additional databases to which the Entry Point has links. corresponding to spots that fulfill certain criteria (see below). The main page allows the user to display annotation infor-The spots can then be outlined in blue boxes on the genome mation for lists ofE. coli genes. The primary source of data image and can also be transferred directly to theE. coliEntry that was used is the ecoli.ptt file (NC_000913.ptt), which was Point (see below), from which other biological information compiled as part of theE. colisequencing effort and down-can be accessed. loaded from the National Center for Biotechnology Infor-A generalized version of the program for generating ge- mation (NCBI) (ftp://ftp.ncbi.nih.gov/genomes/Bacteria/ nome (and other sorts of) images uses as input: (1) a tab- Escherichia_coli_K12/). The user begins by entering or select-delimited “ORDER” text file containing the headings (OR- ing a list of genes using any one of several nomenclatures. DER, TOP, LEFT, RIGHT, BOTTOM, NAME, DESC, LINK), The heading “Display standard fields” allows the user to display where the TOP, LEFT, RIGHT, and BOTTOM parameters basic annotation information on these genes, including b refer to the corresponding pixel positions of each spot in the number, gene name, gene position on chromosome (left and original microarray image, and (2) a PNG image file. The right), strand orientation, protein length, GenBank ID, func-program aligns the spots according to the order specified in tional description (called gene description), and operon ID. the ORDER file, yielding an HTML page and an image. An We have updated some of the gene names on the basis of image map identifies each spot and includes a user-specified evidence in the primary literature. The heading “Sorting” hyperlink. The generalized genome image program is written allows the user to sort and group the genes being displayed in Perl and requires that all of the appropriate Perl modules by genome position or functional category (see below). When (GD, CGI) be installed. It can be accessed at http://coli.berkeley. genes are sorted by position, the background color of the row edu/genomeimages/ and the stand-alone version can be (alternating between yellow and white) is used to indicate downloaded from the same site. different operons. Similarly, when genes are sorted by cate-A GenePix-specific version of the program for generating gory, genes belonging to the same category are indicated with genome images was written to accommodate the large number the same color. Additional fields that can be displayed are: of users of the Axon GenePix software. This program uses as
input: (1) a GenePix results file (GPR), (2) a PNG or JPEG 1. “Show functional category” (Riley-Labedan). Gives the super-heading, super-heading, and category as defined byRileyand image file, and (3) an ORDER file. For the tab-delimited
ORDER file, the ORDER and ID fields are required, and the Labedan(1996).
2. “Show Blattner groups.” Gives the category as defined by NAME, DESC, and LINK fields are optional but
recom-mended. The TOP, LEFT, RIGHT, and BOTTOM fields are Blattneret al.(1997).
3. Operon [A Systematic Annotation Package for Community not used by the GenePix version of this program because they
are calculated from fields that are present in the GPR file. Analysis of Genomes (ASAP)]. Gives the name of the operon and whether it is documented or predicted according to The program joins the ORDER table to the GPR table by the
ID field present in both files. ForE. coli, we have used the b Glasner et al. (2003); http://asap.ahabs.wisc.edu/annota tion/php/ASAP1.htm).
number as the ID in both the GPR file and the ORDER file.
The GenePix-specific program can also be accessed at http:// 4. “Show COG (NCBI).” Gives the COG (clusters of ortholo-gous groups) description ofTatusovet al. (2000), with a coli.berkeley.edu/genomeimages.
Alignment of genome images:The program that aligns ge- link to the NCBI web site (http://www.ncbi.nlm.nih.gov/ COG/).
nome images takes as input a list of genome images in PNG
mation on the particular gene in each external database. for the first gene in the documented or predicted operon. The output is a table in which regulatory proteins are in The databases are: EcoGene (http://bmb.med.miami.edu/
EcoGene/EcoWeb/;Rudd 2000); SwissProt (http://www. rows and gene names in columns. The source of the protein binding data is the ASAP database (Glasneret al.2003; expasy.ch/;BairochandApweiler2000); EcoCyc (http://
biocyc.org/ecocyc/;Karpet al.2000); the NCBIE. coli ge- http://asap.ahabs.wisc.edu/annotation/php/ASAP1.htm). 6. SelfBLAST. At the top of the page, this tool displays the nome page (http://www.ncbi.nlm.nih.gov/cgi-bin/Entrez/
framik?db⫽Genome&gi⫽115); GenProtEC (http://genpro results of sequence comparisons between each gene in the selected list (pink background, separate row) and all other tec.mbl.edu/;RileyandSpace1996); Colibri (http://geno
list.pasteur.fr/Colibri/;Medigueet al.1993); RegulonDB E. coligenes. The names of proteins with BLAST homology to the gene of interest (E-value⬍0.001) are listed in the (http://www.cifn.unam.mx/Computational_Genomics/reg
ulondb/; Salgado et al. 2001); and the E. coli Genetic same row. At the bottom of the page the tool displays BLAST homology scores for comparisons between all mem-Stock Center (http://cgsc.biology.yale.edu/; Berlynand
Letovsky1992). bers (n) of the selected list in ann⫻nmatrix.
7. Features. This tool allows the user to search the nucleotide 6. Ecogene bibliography. Provides a hyperlink to the
gene-specific bibliographies in EcoGene (Rudd2000). sequence upstream of each gene in a list for binding sites for selected -factors and/or selected protein 7. Protein binding sites (ASAP). Gives the names of
transcrip-tional regulatory proteins that have documented or pre- tional regulators. The left and right ends of the binding site for each -factor or regulatory protein are specified, dicted binding sites within 2000 nt of each gene according
toGlasneret al.(2003; http://asap.ahabs.wisc.edu/anno- along with the status of the site (documented or predicted). The distance to the starting ATG of the gene and the tation/php/ASAP1.htm).
8. Promoters (ASAP). Gives the names of-factors that have position of the transcriptional start are also indicated (Glasneret al.2003).
documented or predicted binding sites within 2000 nt of
each gene according toGlasneret al.(2003; http://asap. 8. Gene sequences. This tool displays the primary nucleotide sequences for all genes in a list.
ahabs.wisc.edu/annotation/php/ASAP1.htm).
9. E. coliBLAST neighbors. Gives the number of genes in the E. coligenome with BLAST homology to each gene in the
list, with a hyperlink to the b numbers (seqid), names, RESULTS expect scores (E-values), and percent identities. The only
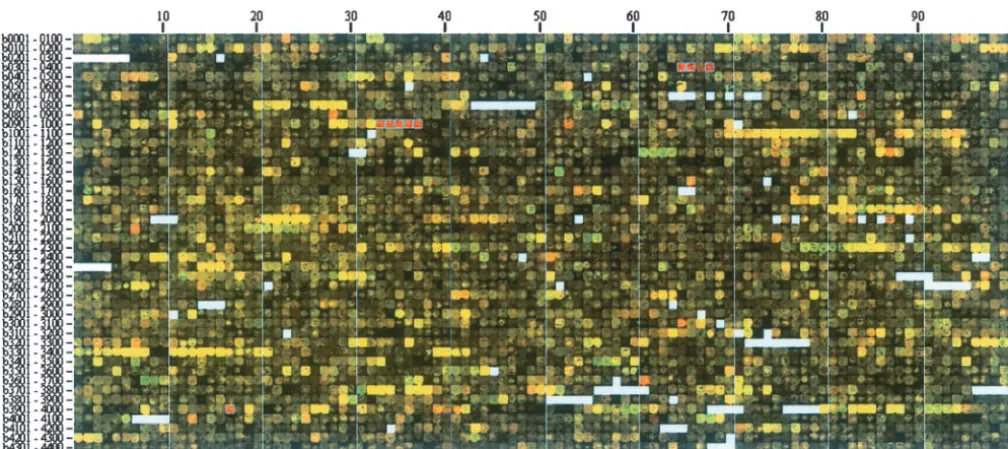
Genome images—visualization of microarray data:E.
BLAST hits stored in the database and reported are those
with anE-value⬍0.001 in a blastp search against ORFs of coligenome images are generated by arranging the spots
theE. coliannotated genome (NC-000913.ptt). in the original image of a glass-slide DNA microarray
in genome order (seematerials and methods). The
After a list of genes has been generated, a set of clickable
spots are ordered in a grid that is 100 columns wide by
buttons at the bottom of the mainE. coliEntry Point page
allows access to information from the subsidiary programs and 45 rows tall and are read from left to right and then
to supplementary data taken from external sources. The fields from top to bottom, as one would read words on a available are (in order of presentation): chromosome position, page (Figure 1). AnE. coligenome image, which carries operons, functional category, COG description, protein
bind-primary expression data for all the genes of the
organ-ing sites, selfBLAST, features, gene sequences, and AMAD
ism, can be viewed on a single page or computer screen.
(takes the user to Genome Images/AMAD database). A brief
description of each follows. When the user holds a cursor over a particular spot, the corresponding gene name and description are
dis-1. Chromosome position. For a list of genes selected on the
played in a web browser. Blank areas represent genes/
E. coli Entry Point page, the program generates a PNG
image of the circular chromosome of E. coli with gene PCR products that were not printed on the slides, which
names marked at the appropriate positions on the circle. in our case are stable RNAs.
2. Operons. For a list of genes selected on theE. coliEntry Figure 1 shows an example of a genome image for a Point page, this tool displays diagrammatically all of the
wild-typeE. coli K12 strain grown with taurine
(2-amino-genes that are members of the corresponding operons
ethanesulfonate) as the sole sulfur source (Cy5; red
(predicted and documented). Each operon is on a separate
line. Genes that were part of the original list are shown on fluorescent label) or with sulfate, an optimal sulfur
a pink background. The user then has the option to return source (Cy3; green). Spots with anR/Gmedian ratio of to theE. coliEntry Point with a new list that includes all ⱖ3 are boxed in blue (see below). The strain grows genes in the operons. The operons are annotated largely
slightly less rapidly on taurine than on sulfate and
ap-as defined at ASAP (Glasneret al.2003; http://asap.ahabs.
pears to perceive some degree of sulfur limitation. As
wisc.edu/annotation/php/ASAP1.htm).
3. Functional category. This option overlaps with the addi- expected from previous work (van der Ploeg et al.
tional field “Show Functional Category” described above 2001), two operons under control of the regulators CysB but also includes the category number. and Cbl (CysB-like) were more highly expressed on 4. COG description. This option overlaps with the additional
taurine. These aretauABCD(b0365–b0368), a catabolic
field “Show COG (NCBI)” but also gives the COG number.
operon for taurine, and ssuEADCB (b0937–b0933), a
5. Protein binding sites. For each gene in the query list this
program identifies documented (dark blue background) catabolic operon for utilization of alkanesulfonates.
and putative (light blue background) regulatory proteins They are easily identified on the image as striking strings that bind within a user-specified number of base pairs (de- of red spots. A number of single red spots are also fault is 2000) upstream of the start site for the gene or
clearly visible. Two that are easily understood are a spot
corresponding multigenic operon. Note that every gene is
corresponding to thecblregulatory gene (b1987) and
considered a member of an operon, whether or not it is
peri-Figure1.—Genome image of an E. colicDNA microarray. E. coliwild-type strain NCM3722 was grown in N⫺C⫺S⫺minimal medium (Gutnicket al.1969) with either 0.25 mmtaurine (Cy5; red fluorescence) or 0.25 mmsulfate (Cy3; green fluorescence) as the sulfur source. The carbon and nitrogen sources were glycerol and ammonium, respectively. As described in the text, the image was generated by rearranging spots in the scanned image of the glass slide in genome order. The b number centuries are indicated to the left and the decades on the top. Blanks represent b numbers that do not correspond to ORFs. Genes with R/Gmedian ratioⱖ3 are highlighted in blue boxes (a feature of the Genome Image/AMAD programs; see materials and methods). They are (in order):tauACD(b0365, b0367, and b0368),ssuBCDAE(b0933–b0937), andsbp(b3917).R/Gmedian refers to the ratio of Rmedian/G median for all of the pixels constituting a spot. These values are determined after global normalization.
plasmic sulfate transport component known to be highly may contribute. Low intensity of a spot may have many causes but low intensity of a group of adjacent spots expressed under sulfur-limiting conditions (Quadroniet
al.1996). Note thattauBandcblare not boxed because corresponding to an operon(s) probably indicates that the operon is not highly expressed under either condi-their R/Gratios were ⬍3. The reproducibility and
sig-nificance of other red spots is currently being assessed tion chosen for the comparison and hence R/Gratios should be evaluated accordingly.
(P.Gyaneshwar,unpublished results).
Also available from genome images is visual informa- The quality of spots can be assessed directly on ge-nome images without the need for complex statistical tion on spot intensities, information that may be lost in
some higher-level analyses of the data (e.g., clustering procedures because the images are composed of the actual scanned pixels. Dark spots within operons can based on R/G ratios). By displaying the spots rather
than pseudocolors representingR/Gratios, we can dis- be seen easily when they are surrounded by spots that are otherwise red, green, or bright yellow. Such spots cern, for example, bright yellow spots, genes for which
there is probably a large amount of mRNA in both often indicate failed PCR products or damaged print tips. In Figure 1 there are two black spots (b3309 and cultures. Several long strings of bright yellow spots in
Figure 1 correspond to operons of ribosomal protein b3310) in the middle of the string of ribosomal protein genes between b3294 and b3321. They were reproduci-genes or clusters of such operons (e.g., b3294–3298,
b3299–3310, b3311–3321, b3339–3342, b3983–3984, bly black in several prints and hence probably are failed PCR products.
b3985–3986), which are always highly expressed in E.
coli (Neidhardt et al. 1990). Other strings of bright Finally, in conjunction with analyses at theE. coliEntry Point (see below), genome images can be helpful in yellow spots correspond to genes of the flagellar and
chemotaxis regulon (b1070–1083, b1881–1892, b1920– detecting misannotated operons and artifactual differ-ential expression. For example, we determined that the 1926) and to operons encoding the F1F0ATPase (b3731–
3739) and the tricarboxylic acid cycle enzymes succinate gltIJKandLgenes probably constitute a single operon, as do yhdWXY and Z, although gltI was not originally dehydrogenase (b0721–0724) and 2-oxoglutarate
dehy-drogenase and succinyl-CoA synthetase (b0726–b0729). included with the otherglt genes and theyhdoperon was split in half (Zimmeret al.2000). Likewise we showed Although high intensity is probably an indication of
We are currently using aligned genome images to identify the intersections and unions of genes induced upon limitation of sulfur or nitrogen (P.Gyaneshwar,
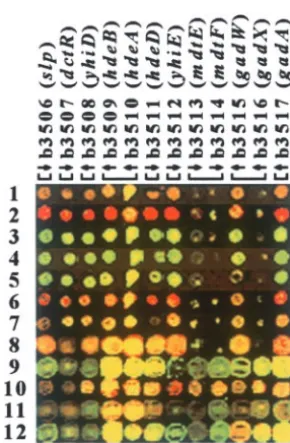
unpublished results). Previously, we have used them to analyze a regulatory cascade that controls the homeo-static response to nitrogen limitation and to note simul-taneous changes in expression of the 12 genes in the slp-gadA region (b3506–b3517), whose expression ap-pears to be elevated under conditions of slow growth (Zimmer et al. 2000). Behavior of these 12 genes in a dozen independent experiments is shown in Figure 2, which represents only theslp-gadAregion of the dozen aligned genome images. Although the genes are anno-tated as members of nine different operons (Figure 2 and information from theE. coliEntry Point at http:// nature.berkeley.edu/ⵑopaliy/papers/GenomeImages. html), their expression appears to change in parallel in all of the experiments. The visual analysis was confirmed by calculating a pairwise correlation matrix of
log-trans-Figure 2.—The slp-gadA region (b3506–b3517) of 12
formedR/G ratios, which showed a good positive
rela-aligned genome images. Rows correspond to different
experi-tionship among expression of all these genes (average
ments and columns indicate the genes in the portion of the
pairwise correlation of 0.91). Similar effects have been
images shown (b numbers and gene names). Brackets denote
operon boundaries and arrows indicate the direction of tran- seen for clusters of operons with common regulatory scription of each gene. The data were taken from theE. coli control, e.g., clusters of ribosomal protein genes and Entry Point. In experiments 1–8, b3513, b3514, and b3517
the flagellar and chemotaxis regulon (Soupene et al.
appear to be bad PCR products. A table with the descriptions
2003). Regulation of genes in theslp-gadA region has
of the experiments and a table with functional descriptions
been intensively studied recently (MasudaandChurch
of the genes are available at http://nature.berkeley.edu/ⵑ
opaliy/papers/GenomeImages.html. 2003 and references cited therein). This region is proba-bly also subjected to common transcriptional control. In addition, one or more structural proteins,e.g., H-NS, readthrough transcription (Wendischet al. 2001, Fig- may control access of RNA polymerase to this region ure 3C). ThecynX gene is adjacent tolacA and is the of the genome, which would be analogous to regional last gene in the cynTSX operon, which is transcribed effects observed in eukaryotic organisms (Lercher et towardlac. The high signal seen in IPTG-induced cells is al.2002; Royet al.2002; SpellmanandRubin2002). probably due to the presence of antisense RNA because To our knowledge such effects have not been docu-many transcripts for thelacoperon terminate at least mented in bacteria.
one-third of the way into thecynXgene (Hedigeret al. E. coliEntry Point—tools for identifying relationships
1985;McCormick et al.1991). among E. coli genes: The E. coli Entry Point is a set
As indicated inmaterials and methods, the AMAD of tools for identifying known biological relationships database, in which our genome images are stored, allows among groups of genes. A user can enter any list and extraction of the corresponding numerical data. AMAD then display various sorts of biological information for was developed by Joe DeRisi. Extraction of numerical each gene, including information on chromosome posi-data can, of course, also be accomplished with other tion and inclusion in an operon, promoter and-factor
microarray data analysis programs. controlling expression, regulatory proteins that bind
Alignment of genome images: Aligned genome im- upstream and their binding sites, sequence, function of
ages are used to identify similarities and differences in the gene product, and homology relationships to other gene expression (mRNA levels) in several experiments gene products (seematerials and methods). The full and to assess reproducibility of these differences (see, list of genes together with the information requested is for example, an alignment of four images for anE. coli shown on one web page, allowing fast comparisons and K12 strain grown on taurinevs.sulfate at http://nature. interpretations. In addition, the information can easily berkeley.edu/ⵑopaliy/papers/GenomeImages.html). An be copied into a spreadsheet program such as Microsoft alignment of twoE. coligenome images can be viewed Excel for further analysis locally.
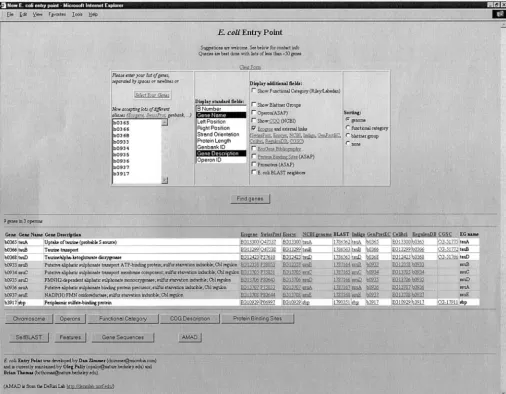
Figure3.—A screen shot of the main page of theE. coliEntry Point. Genes corresponding to spots with anR/Gmedian ratio ⱖ3 in the experiment of Figure 1 were entered in the selection box and information fields for gene name, gene description, and a number of web links to external databases were displayed. Background shading of the rows alternates between operons. Other information available from theE. coliEntry Point is discussed in the text.
sponding list of genes was transferred directly to theE. operon (b0367 istauB, white background) was not in-cluded in the original list of those with R/Gratio ⱖ3. coli Entry Point. The screen shot shows some of the
basic annotation information available from the options By clicking the button at the bottom of the operon page the user can now return to theE. coliEntry Point with “Display Standard Fields” and “Display Additional Fields.”
Note that the background shading of the rows alternates all genes of the operons being considered and obtain additional information for all of them. Entering b0367 between operons. Note, too, that there are direct links
to the other major E. colidatabases listed. Thus, if the in AMAD allows the user to determine that the R/G median for this gene was 2.0, whereas ratios for the 9 user wishes additional information on a gene(s) of
inter-est, he or she can go to a gene-specific page of any of genes originally in the list were between 3.2 and 14.8. Screen shots obtained by using all of the clickable but-these databases with one click of the mouse button. A
screen shot of all the additional information available tons at the bottom of the E. coli Entry Point page for the expanded list of 10 genes are given at http://nature. from the option “Display Additional Fields” is provided
at http://nature.berkeley.edu/ⵑopaliy/papers/Genome berkeley.edu/ⵑopaliy/papers/GenomeImages.html, along with comments on the timeliness and accuracy Images.html, along with comments.
Figure 4 shows the information available from the of the information currently available.
An important feature of theE. coliEntry Point is that clickable button “Operon” at the bottom of theE. coli
compare gene expression between different laboratory strains ofE. coligrown in the same medium (Soupene
et al.2003). In the latter case, comparison between a robustE. coliK12 wild-type strain and MG1655 (CGSC 6300) illustrated strikingly the low expression of flagel-lar and chemotaxis genes in MG1655 (Lehnen et al. 2002) because these are arranged in several large clus-ters on the genome. After we initially employed genome images (Zimmeret al.2000;Wendischet al.2001), sev-eral other programs that present microarray data in genome order, e.g., GeneSpring (SiliconGenetics http:// www.silicongenetics.com/cgi/SiG.cgi/Products/Gene Spring/index.smf), also became available. However,
in-Figure4.—Screen shot of the operon tool for the gene list
formation about primary data—overall quality of the
of Figure 3. The data shows that the genes (shaded
back-ground) were in three operons (indicated in separate rows) experiment and/or the occurrence of missing spots in
and that only one gene (b0367, white background) in one of operons whose expression differs under the two condi-the operons was missing in condi-the original list. The button at condi-the tions chosen—must be assessed less directly because bottom of the page allows the user to return to theE. coli
expression differences are presented in artificial color.
Entry Point with all of the genes listed.
In addition, these new programs are often costly. A major goal of aligning genome images is similar to image is displayed in AMAD, clicking on a spot of inter- that of powerful statistical methods for data analysis est transfers the user directly to theE. coliEntry Point such as hierarchical clustering (Eisenet al.1998). The
with the corresponding gene already entered in the two approaches are complementary, with alignment
gene selection field. From the gene one can proceed having two distinct strengths for small numbers of exper-to its operon and all of the other information described iments. First, the alignment of several genome images above. Similarly, when a user decides to highlight a can be viewed on a single page, whereas the complete number of spots on a genome image,e.g., those whose cluster analysis for E. coli requires many more pages. R/Gratio is above a certain cutoff value (seematerials (Results of the latter are usually organized into a figure/
and methods), he or she can, in a separate operation, table that is L experiments wide and N genes high, also transfer the corresponding list of genes to theE. whereN isⵑ4400 for E. coli.) The compactness of
ge-coliEntry Point. nome images facilitates rapid qualitative analysis of the
Finally, if the user wishes first to determine the gene data and reduces its complexity by allowing immediate set meeting a certain criterion,e.g., all the genes con- consideration of operons without the need to sift taining “tau” in their name, he or she can begin with through lists of hundreds of genes. Apart from the 1125 the option “Select Genes” at the Entry Point and then genes that are transcribed separately inE. coli, the re-return to the Entry Point with the resulting list. Criteria maining 3100 protein-coding genes are partitioned into for selecting genes include gene name, description, b only about one-quarter as many operons (ⵑ750;
Glas-number, position on the genome, and length. The user neret al.2003; http://asap.ahabs.wisc.edu/annotation/ can also generate lists of genes from other programs or php/ASAP1.htm). In the case of the NtrC and Nac E. coliresources on the internet and import them into regulons, the 75 genes involved were members of only
theE. coliEntry Point. 25 operons (Zimmer et al. 2000). A second advantage
of genome images is that members of operons are con-tiguous whereas this often is not the case in a
hierarchi-DISCUSSION
cal cluster. The nested NtrC and Nac regulons provide an interesting example. Many of the operons under
Genome images and aligned genome images:We
de-veloped genome images to visualize microarray data in control of these regulatory proteins encode ABC trans-port systems for nitrogen-containing compounds, and, a way that would facilitate comprehensive qualitative
analysis of one or a few experiments. In the results biologically, members of each operon are their own closest neighbors because they must function together. we present two new examples of their use, along with
the use of theE. coliEntry Point database. Previously, Genome images showed clearly that expression of all genes in each operon changed in the same direction we have used genome images and aligned images to
aid in determining the regulons controlled by nitrogen when various strains and growth conditions were com-pared (Zimmer et al.2000). Nevertheless, members of regulatory protein C (NtrC) and the nitrogen
assimila-tion control protein (Nac;Zimmeret al.2000) to assess different operons were intermingled in hierarchical clusters (http://nature.berkeley.edu/ⵑopaliy/papers/ the responses of freshly isolated urinary tract and
did not change to the same extent. [As discussed pre- functional information into a spreadsheet file that was used to compare the protein and mRNA profiles ofE. viously, we think this has a biological explanation (
Zim-meret al. 2000).] Apart from problems with operons, colion a global scale (Corbinet al.2003). The compari-son was also visualized in artificial color in an analog however, the results of hierarchical clustering and
inter-pretation of genome images (Zimmeret al.2000) were of an aligned genome image (http://coli.berkeley.edu/ protein_profile/).
remarkably congruent, illustrating the complementarity
of the two means of analysis. A cluster of only 39 genes The Entry Point consists of simple programs that ex-tract and visualize data, which can be downloaded from contained 32 genes in operons directly under NtrC
con-trol and a second cluster of only 24 genes contained 17 a variety of publicly available sources (seematerials and methods). The capacity to visualize this data in new genes in operons under Nac control. In all, two-thirds
of the 75 genes we had identified previously were in ways rests on the flexibility given by being able to access it from a MySQL database that was implemented local-these two clusters (http://nature.berkeley.edu/ⵑopaliy/
papers/GenomeImages.html). ly. As illustrated in the results and at http://nature.
berkeley.edu/ⵑopaliy/papers/GenomeImages.html, the In their masterful study using glass-slide DNA
mi-croarrays and hierarchical clustering to analyze trypto- quality of the information obtained from the Entry Point depends on whether information in other databases is phan metabolism in E. coli, Khodursky et al. (2000)
mentioned that only five known multigene operons current and accurate. One very useful feature of the Entry Point is that it facilitates access to primary litera-were fully represented in the set of 169 genes that they
selected to analyze, whereas 37 operons were repre- ture from PubMed (EcoGene Bibliography) and to in-formation from other databases. Data from these sources sented by only a single gene. For example, expression of
only a few of the 50 genes in the flagellar and chemotaxis can be cross-checked to obtain the best possible infor-mation on a list of genes at any given time.
regulon appeared to respond to tryptophan availability.
However, examination of the data in genome images Conclusions:Global expression technologies have led to a rapid increase in our knowledge and understanding showed that expression of genes in many operons,
in-cluding those of the flagellar and chemotaxis regulon, of metabolic pathways and regulatory networks in a vari-ety of microbes and other organisms. As the use of DNA differed in the same direction in particular comparisons
between growth conditions or strains (strings of contigu- microarrays becomes more widespread among biolo-gists of all generations, it will be useful to have biologist-ous red or green spots; see example at http://nature.
berkeley.edu/ⵑopaliy/papers/GenomeImages.html). friendly software and visualization tools available to sup-plement more mathematical tools. Genome images and One image revealed a striking artifact: an apparent
dif-ference in expression of the flagellar and chemotaxis theE. coli Entry Point should be useful in this regard. Our current efforts are directed at improving these tools regulon between a wild-type strain (W3110) and a strain
lacking the tryptophan repressor CY15682. The W3110 forE. coli, making them widely available, and generaliz-ing them to other microorganisms.
wild-type strain is in the same lineage as MG1655 (
Bach-mann 1996) and expresses flagellar genes poorly (see D.P.Z. thanks Arkady Khodursky, Brian Peter, and Volker Wendisch above), whereas the particulartrpR2strain used for this for stimulating discussions of technical aspects of bacterial microarray experiments and the merits of various methods for interpreting the
and one other experiment is apparently noncongenic
data; David Botstein, Patrick Brown, and Joseph DeRisi for guidance
with W3110 and expresses these genes well. The difference
in all aspects of microarray experiments; and Daniel Rokhsar, Nik
was not seen when congenic trpR2and wild-type strains Putnam, and David Schweisguth for ideas and advice on computation. were compared (Khodurskyet al.2000; P.Gyaneshwar, We thank Charles Yanofsky for access to his data in AMAD and Jon
unpublished results). The use of genome images to McAuliffe and Michael I. Jordan for advice on analysis of theslp-gadA region. This work was supported by National Institutes of Health
examine the data ofKhodurskyet al.(2000), which we
(NIH) fellowship GM19862 to D.P.Z. and NIH grant GM38361 and
are analyzing in further detail elsewhere (P.
Gyanesh-a grGyanesh-ant from the Torrey MesGyanesh-a ReseGyanesh-arch Institute, SyngentGyanesh-a ReseGyanesh-arch
war, A. Jones, A. Khodursky and S. Kustu,
unpub-and Technology, La Jolla, California, to S.K.
lished results), illustrated the value of these images as an adjunct to hierarchical clustering.
TheE. coliEntry Point:After examining genome
im-LITERATURE CITED
ages and using data sorting and filtering methods to
Bachmann, B. J., 1996 Derivations and genotypes of some mutant
determine a list of genes whose expression differs in a
derivatives ofEscherichia coliK-12, pp. 2460–2488 inEscherichia
microarray experiment, an investigator can use the E. coli and Salmonella: Cellular and Molecular Biology, Ed. 2, edited by F. C.Neidhardt, R.CurtissIII, E. C. C.Lin, J.Ingraham, B. K. coliEntry Point to extract biological information about
Lowet al.ASM Press, Washington, DC.
these genes. Examples of the uses of the Entry Point
Bairoch, A., andR. Apweiler, 2000 The SWISS-PROT protein
se-are given in theresults. We previously used the Entry quence database and its supplement TrEMBL in 2000. Nucleic
Acids Res.28:45–48.
Point to determine relationships among the genes of
Berlyn, M. B., and S. Letovsky, 1992 Genome-related datasets
the NtrC and Nac regulons and to update their
annota-within the E. coli Genetic Stock Center database. Nucleic Acids
tions. In addition, we used it recently to export a list Res.20:6143–6151.
Blattner, F. R., G. Plunkett, III, C. A. Bloch, N. T. Perna, V.
Burlandet al., 1997 The complete genome sequence ofEsche- Quadroni, M., W. Staudemann, M. KerteszandP. James, 1996 Analysis of global responses by protein and peptide fingerprinting richia coliK-12. Science277:1453–1474.
of proteins isolated by two dimensional gel electrophoresis:
appli-Corbin, R. W., O. Paliy, F. Yang, J. Shabanowitz, M. Plattet al.,
cation to sulfate starvation responses of Escherichia coli.Eur. J. 2003 Toward a protein profile ofEscherichia coli: comparison to
Biochem.239:773–781. its transcription profile. Proc. Natl. Acad. Sci. USA100:9232–
Riley, M., andB. Labedan, 1996 E. coligene products: physiological 9237.
functions and common ancestries, pp. 2118–2202 inEscherichia
Descartes, A., and T. Bunce, 2000 Programming the Perl DBI.
coli and Salmonella: Cellular and Molecular Biology, Ed. 2, edited by O’Reilly & Associates, Cambridge, MA.
F. C.Neidhardt, R.CurtissIII, E. C. C.Lin, J.Ingraham, B. K.
Eisen, M. B., P. T. Spellman, P. O. BrownandD. Botstein, 1998
Lowet al.ASM Press, Washington, DC. Cluster analysis and display of genome-wide expression patterns.
Riley, M., andD. B. Space, 1996 Genes and proteins ofEscherichia Proc. Natl. Acad. Sci. USA95:14863–14868.
coli(GenProtEC). Nucleic Acids Res.24:40.
Glasner, J. D., P. Liss, G. Plunkett, III,A. Darling, T. Prasadet
Roy, P. J., J. M. Stuart, J. LundandS. K. Kim, 2002 Chromosomal al., 2003 ASAP, a systematic annotation package for community
clustering of muscle-expressed genes in Caenorhabditis elegans. analysis of genomes. Nucleic Acids Res.31:147–151.
Nature418:975–979.
Goodman, N., 2002 A dim summary of microarray software. Genome
Rudd, K. E., 2000 EcoGene: a genome sequence database for Esche-Technol.19:58–64.
richia coliK-12. Nucleic Acids Res.28:60–64.
Gutnick, D., J. M. Calvo, T. KlopotowskiandB. N. Ames, 1969 Salgado, H., A. Santos-Zavaleta, S. Gama-Castro, D. Millan -Compounds which serve as the sole source of carbon or nitrogen Zarate, E. Diaz-Peredoet al., 2001 RegulonDB (version 3.2): forSalmonella typhimuriumLT-2. J. Bacteriol.100:215–219. transcriptional regulation and operon organization inEscherichia
Hediger, M. A., D. F. Johnson, D. P. NierlichandI. Zabin, 1985 coliK-12. Nucleic Acids Res.29:72–74.
DNA sequence of the lactose operon: the lacA gene and the Schena, M., D. Shalon, R. W. DavisandP. O. Brown, 1995 Quanti-transcriptional termination region. Proc. Natl. Acad. Sci. USA tative monitoring of gene expression patterns with a
complemen-82:6414–6418. tary DNA microarray. Science270:467–470.
Karp, P. D., M. Riley, M. Saier, I. T. Paulsen, S. M. Paleyet al., Sherlock, G., 2000 Analysis of large-scale gene expression data. 2000 The EcoCyc and MetaCyc databases. Nucleic Acids Res. Curr. Opin. Immunol.12:201–205.
28:56–59. Soupene, E., W. C. van Heeswijk, J. Plumbridge, V. Stewart, D.
Khodursky, A. B., B. J. Peter, N. R. Cozzarelli, D. Botstein, P. O. Bertenthalet al., 2003 Physiological studies ofEscherichia coli
Brownet al., 2000 DNA microarray analysis of gene expression strain MG1655: growth defects and apparent cross-regulation of in response to physiological and genetic changes that affect tryp- gene expression. J. Bacteriol.85:5611–5626.
tophan metabolism inEscherichia coli.Proc. Natl. Acad. Sci. USA Spellman, P. T., andG. M. Rubin, 2002 Evidence for large domains of similarly expressed genes in theDrosophilagenome. J. Biol.1: 97:12170–12175.
5.
Lehnen, D., C. Blumer, T. Polen, B. Wackwitz, V. F. Wendischet
Tatusov, R. L., M. Y. Galperin, D. A. NataleandE. V. Koonin, al., 2002 LrhA as a new transcriptional key regulator of flagella,
2000 The COG database: a tool for genome-scale analysis of motility and chemotaxis genes inEscherichia coli.Mol. Microbiol.
protein functions and evolution. Nucleic Acids Res.28:33–36.
45:521–532.
van der Ploeg, J. R., E. EichhornandT. Leisinger, 2001
Sulfo-Lercher, M. J., A. O. UrrutiaandL. D. Hurst, 2002 Clustering
nate-sulfur metabolism and its regulation inEscherichia coli.Arch. of housekeeping genes provide a unified model of gene order
Microbiol.176:1–8. in the human genome. Nat. Genet.31:180–183.
Wall, L., T. ChristiansenandJ. Orwant, 2000 Programming Perl.
Masuda, N., andG. M. Church, 2003 Regulatory network of acid
O’Reilly & Associates, Cambridge, MA. resistance genes inEscherichia coli.Mol. Microbiol.48:699–712.
Wendisch, V. F., D. P. Zimmer, A. Khodursky, B. Peter, N. Cozza-McCormick, J. R., J. M. ZengelandL. Lindahl, 1991 Intermediates
relliet al., 2001 Isolation ofEscherichia colimRNA and compari-in the degradation of mRNA from the lactose operon ofEscherichia
son of expression using mRNA and total RNA on DNA microar-coli.Nucleic Acids Res.19:2767–2776. rays. Anal. Biochem.290:205–213.
Medigue, C., A. Viari, A. HenautandA. Danchin, 1993 Colibri: Zimmer, D. P., E. Soupene, H. L. Lee, V. F. Wendisch, A. B. Khodur-a functionKhodur-al dKhodur-atKhodur-a bKhodur-ase for theEscherichia coligenome. Microbiol. skyet al., 2000 Nitrogen regulatory protein C-controlled genes
Rev.57:623–654. ofEscherichia coli: scavenging as a defense against nitrogen
limita-Neidhardt, F. C., J. L. IngrahamandM. Schaechter, 1990 Physiol- tion. Proc. Natl. Acad. Sci. USA97:14674–14679. ogy of the Bacterial Cell: A Molecular Approach. Sinauer Associates,