FULL PAPER
On the role of anisotropic MF/HF
scattering in mesospheric wind estimation
Toralf Renkwitz
1*, Masaki Tsutsumi
2,3, Fazlul I. Laskar
1, Jorge L. Chau
1and Ralph Latteck
1Abstract
The Saura radar is designed and used to measure winds and electron densities at polar latitudes (69◦ N) within the D region, namely between 50 and 100 km altitude. A relatively narrow radar beam can be generated and steered into distinct pointing directions as a rather large antenna array is used. From the observed radial velocities of the individual pointing directions, the horizontal and vertical wind fields can be obtained using the Doppler beam swinging (DBS) method. With recent upgrades to the radar, the interferometric capabilities are largely improved allowing simulta‑ neous application of different wind estimation techniques now, and also echo localization. In recent studies, Saura DBS winds assuming isotropic scattering were found to be underestimated in comparison with highly reliable winds observed with the MAARSY MST radar in the presence of polar mesospheric summer echoes (PMSE). This underesti‑ mation has been investigated by analyzing the scattering positions as well as applying the imaging Doppler interfer‑ ometry technique. Besides this, Saura winds derived with the classical DBS method seem to be error prone at altitudes above 90 km and even below this altitude for periods of enhanced ionization, e.g., particle precipitations. Various methods taking into account the scattering positions have been used to correct the wind underestimation. These winds are compared to MST radar winds during PMSE, and an optimal combination of these methods for the Saura radar is presented. This combined wind data appears to be reliable; it shows reasonable amplitudes as well as tidal structures for the entire altitude region.
Keywords: Radar, Wind estimation, D region, Interferometry, Scattering
© The Author(s) 2018. This article is distributed under the terms of the Creative Commons Attribution 4.0 International License (http://creat iveco mmons .org/licen ses/by/4.0/), which permits unrestricted use, distribution, and reproduction in any medium, provided you give appropriate credit to the original author(s) and the source, provide a link to the Creative Commons license, and indicate if changes were made.
Introduction
MF/HF-Radars1 operated at frequencies around 3 MHz are the only radar instruments that allow a continuous monitoring of the lowermost part of the ionosphere. Winds observed with such radar systems have hence been used in several studies of the structure and dynam-ics of this altitude range. MF radar data in general have shown a good agreement in the wind structures to those of other colocated systems like MST and meteor radars. As an example, Hoffmann et al. (2010) combined meteor radar winds with winds obtained by the full cor-relation analysis (FCA) using the wide-beam MF radar at Andenes and Juliusruh, for polar and middle latitudes respectively. In this study the authors generated hourly wind fields with a coverage from 70 to 100 km altitude
to investigate, e.g., wind field climatology, wind vari-ances, wave activities and momentum flux. In respect of this study, it, however, has to be noted that magnitudes of FCA horizontal winds in general are known to be underestimated (Holdsworth and Reid 1995, 1997). For the same polar location, another valuable time series also exists for the Saura radar, applying DBS methods. This dataset was used by Placke et al. (2015a, b) to derive the annual cycles of horizontal winds as well as to investigate the interaction of gravity waves momentum flux with the mean flow. For these and other studies, DBS data comprised of radial velocities along the beam pointing direction or the already converted vertical and horizon-tal winds of the VEL analysis2 have typically been used.
Open Access
*Correspondence: renkwitz@iap‑kborn.de
1 Radar Remote Sensing, Leibniz‑Institute of Atmospheric Physics
at the University of Rostock, Schlossstraße 6, Kühlungsborn 18225, Germany
Full list of author information is available at the end of the article
1 <3 MHz medium frequency (MF), >3 MHz high frequency (HF). 2 VEL is a post-analysis tool provided in the commercial analysis package
Saura DBS hourly wind data have also been recently thor-oughly investigated by Wilhelm et al. (2017), in compari-son with winds derived by a colocated specular meteor radar. In particular, below 85 km altitude, the authors found a good correlation between the two independent systems. However, the wind magnitudes of both systems seem to deviate from each other toward their individual altitudinal coverage and the authors suggest the use of correction factors to generate a homogeneous wind field.
As a second indicator, comparisons to radar meas-urements using the MAARSY MST radar (53.5 MHz) observing polar mesospheric summer echoes have shown similar wind structures, but generally larger magnitudes than the Saura radar winds.
Since the recent upgrades to the Saura radar, it is even more flexible and advanced techniques can be applied that allow the observation of new parameters, which are partly used in this study to investigate the consist-ent underestimation of horizontal winds. Therefore, the methods used to derive winds for the Saura radar are revisited with the intention to generate a revised data-set of high reliability. This is particularly interesting as the temporal resolution of MF/HF radar winds used for scientific studies is typically in the order of 30–60 min, while the improved Saura winds appear to be useful down to a few minutes.
In earlier studies, mainly for VHF radar observations, the observed deviation of nominal beam pointing and detected scattering position is often referred to aspect sensitivity. The aspect sensitivity parameter θs can be esti-mated from the spatial correlation method relating the FCA pattern scale, axial ratio and nominal beam width (see, e.g., Holdsworth and Reid 1995). Furthermore, aspect sensitivity can be estimated by comparing the detected power of at least two radar beam positions of finite and known width pointing toward zenith and off-zenith. (See, e.g., Hocking and Hocking 2007, and refer-ences therein for aspect sensitivity and θs parameter.) This implies that the observed structures show anisotropic and mirror-like scattering properties associated with fad-ing signal strength toward larger off-zenith angles. For radars operated at the MF/HF range beam steering capa-bilities were and are still rare, therefore parameters of the spatial correlation wind estimation techniques were often used to investigate scattering properties. Adams et al. (1989) reported on the aspect sensitivity of MF-radar backscatter and categorized the MF-radar echoes into classes of anisotropic properties for positions near zenith and isotropic for positions of more than 6 ◦ zenith angle for altitudes below 85 km. For this study, the aspect sensi-tivity was estimated from the observed variation of signal power with zenith angle.
Lesicar and Hocking (1992) investigated the scatter-ing properties in the Southern Hemisphere usscatter-ing the Buckland Park MF radar near Adelaide in Australia, using spectral width analysis and spatial correlation technique. The authors found an aspect sensitivity rang-ing from θs=6◦ to 15◦ for 70–100 km in a three year
long data series. Furthermore, a seasonal dependency at lower altitudes (70–80 km), with minima in local winter, but almost constant aspect sensitivity above 80 km was observed. As we will show later, this is approximately the same altitude at which we see the largest changes in the radar echoes. On the basis of spatial correlation tech-niques, Lesicar et al. (1994) examined the dependence of aspect sensitivity at three different latitudes in the south-ern hemisphere in respect to the model assumption of prevailing ellipsoidal shaped turbulence cells. Addition-ally, the authors analyzed data from a vertical and off-vertical beam experiment and found equivalent results.
As a consequence it is important to estimate the effec-tive scattering position to obtain correct DBS wind mag-nitudes. The effective scattering position is a product of the polar diagram of backscatter of the individual scat-terers as well as the polar diagrams of the transmit and receive antenna (see, e.g., Röttger 1980).
Later, Holdsworth and Reid (2004) exploited the beam steering capability of the same MF radar and analyzed the effective scattering positions using for example hybrid Doppler interferometry (HDI). In the HDI technique, the obtained scattering positions are used for the vertical and horizontal wind projection.
In the following section, the experimental setup and the radar properties are introduced which help to under-stand the applied methods. After this, under-standard Saura winds are compared to observations with the quasi colo-cated MST MAARSY radar, which is used as a reference for this study. We show Angle of Arrival statistics of 1-year observations for vertical and oblique beam point-ing. Subsequently, we evaluate and present different wind estimation techniques followed by the currently optimal combination of techniques to derive a reliable wind field for the Saura radar. A discussion and conclusions are given in the latter part of this manuscript.
Experimental setup
with its predecessor radar MF-Andenes operated at 1.98 MHz just 20 km north of Saura, which was used in several studies. The Saura radar performs observations throughout the year due to its relative low frequency and the sufficient amount of electron number density per-mitting radar backscatter. The lower boundary of the D region and thus the radar’s coverage, however, is highly dependent on the ionization level at the given time, mainly controlled by the solar and geomagnetic activity. During periods of enhanced ionization in the D region, the Saura radar is capable of providing wind measure-ments down to 50 km altitude as we will show later in Fig. 8, where in general no other instruments may pro-vide winds of equivalent temporal and spatial coverage as well as resolution.
The specialty of the Saura radar is the large antenna array, which is comprised of 29 crossed antennas arranged in a Mills Cross configuration and annexed by two additional antennas. The latter are typically only used for reception in a spaced antenna configuration for the interferometric analysis of the detected signals. The comparably large antenna array, for a radar system operating in the medium frequency range, spreads well over 1 × 1 km and thus offers a good angular resolution with a minimum half-power beam width of 6.3◦ and 6.6◦ , respectively pointing boresight and 6.8◦ off-vertical. Another example for such a large antenna array used for atmospheric science at such low frequencies is the Buck-land Park MF radar and was described by Holdsworth and Reid (2004). The arrangement of the Saura antenna array is shown in Fig. 1, where antennas marked in red depict the receiving configuration used in this study. Each dipole of the crossed antennas in the array is connected to an individual transceiver module being adjustable in phase and providing 2 kW peak power each. This config-uration provides radar beam steering capabilities as well as the generation of right and left circular polarization, respectively matching the ordinary and extraordinary magneto-ionic component, often abbreviated by O/X.
The atmosphere is typically probed sequentially in verti-cal and four oblique directions (see Table 1 for details). With such characteristics, the versatile Saura radar is mainly used to derive the wind field in the mesosphere by applying Doppler Beam Swinging (DBS, see Woodman and Guillen 1974) or Spaced Antenna techniques (SA) applying the full correlation analysis method (FCA, see Briggs 1984; Vincent et al. 1987). The temporal resolution of Saura radar winds depends on the chosen radar exper-iment settings at the given time. The individual experi-ments nowadays have a run time of roughly 4 min, 215 s for the vertical and 235 s for the multi-beam experiment including oblique soundings. The typical experiment sequence is scheduled as follows, one vertical followed by two multi-beam experiments, with a sequence length of 12 min. For this study, only single pulse experiments with 1 km pulse width are used to prevent potential code side lobe contamination at mesospheric heights generated by long range-coded high duty cycle signals on transmission scattered off the E region.
Besides measuring winds in the D region, the Saura radar is also used to estimate electron number densities by the interleaved sounding with both magneto-ionic components and applying Differential Absorption (DAE) and Differential Phase (DPE) measurements [see, e.g., Singer et al. 2011)].
Since a major upgrade of the Saura radar in December 2015, the old analog acquisition system was changed to digital transceiver modules, sampling the intermediate
-550 -450 -350 -250 -150 -50 50 150 250 350 450 550
Fig. 1 Map of the Saura radar antenna array, black and red marked positions respectively depict transmit and receive antennas. In this study, the antennas Z1, Z2, N2 and N4 are mostly used for the interferometric analysis of received signals
Table 1 Current optimal parameters of the Saura radar
Geographic coordinates 69.14◦ N; 16.02◦E
Frequency 3.17 MHz
Peak pulse power 120 kW, 0.5%
Antenna array gain 18.4 dBi
Half‑power beam width 6.3◦
Receiver channel 9
Range resolution, pulse width 1 km
Typical beam Vertical: θ=0◦ , φ=0◦ Pointing directions θ=6.8◦ : φ=56.2◦, 146.2◦
frequency, accompanied with increased duty cycle as well as implementation of code functionality. At the same time the antenna combination and mapping to the receiver channels were modified in the way that 28 anten-nas out of the Mills Cross array, omitting the center and annexed Z1, Z2 antennas, are combined and connected to one receiver channel. This permits to connect the remaining receiver channels to individual antennas that can be used for interferometric purpose (see Fig. 1). Such spaced antenna configuration were and still are widely used for wide-beam MF radars mostly applying methods like FCA. However, the greater benefit for Saura is given by estimating the mean scattering position of the radar echoes in azimuth and zenith angle. This application of interferometric analysis is often called Angle of Arrival (AOA) and is widely used for various applications, like for specular meteor radars (see, e.g., Jones et al. 1998; Lau et al. 2006), but also in communication systems (Mailaender et al. 2011).
Comparison of Saura DBS and MAARSY PMSE winds
In this study, the evaluation of Saura horizontal winds is done by comparing them to winds derived by the MAARSY MST radar, which is located about 20 km north of Saura, observing polar mesospheric summer echoes (PMSE). These echoes are typically observed between 80 and 90 km altitude in the northern hemi-sphere due to the cold mesopause region (Lübken 1999). These low temperatures allow the formation of ice particles, which are charged by ionization, reducing the diffusivity and thus allow Bragg scattering of VHF radio waves (Rapp and Lübken 2004). PMSE were first seen and reported by Czechowsky et al. (1979) and have been widely investigated in the northern and southern hemisphere. Winds obtained from PMSE observations of MAARSY are generally very reliable as the targets are typically quite strong, and the minimum half-power beam width is only 3.6◦ and contaminations from side lobes are normally sufficiently suppressed (see Latteck et al. 2012, for further information about this radar).
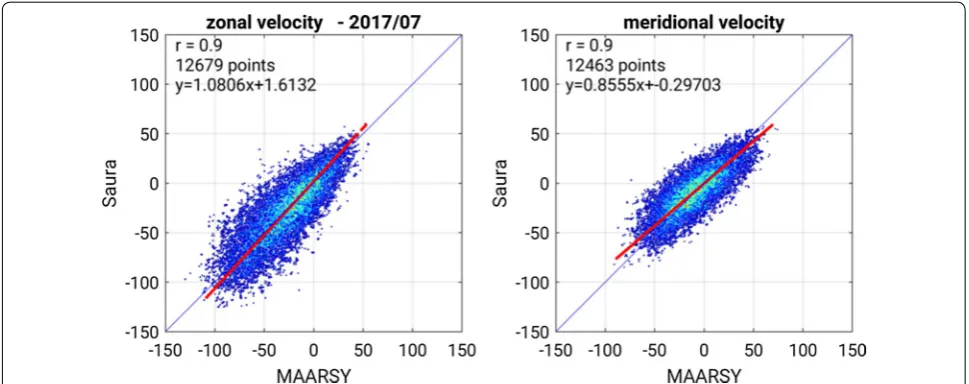
For both radars, the horizontal wind field and ver-tical wind field are calculated assuming the nomi-nal beam pointing direction to be the same as the mean scattering positions. The MAARSY wind data of 300 m range resolution has been adapted to the Saura altitudinal and temporal resolution (median val-ues) for this and the subsequent comparisons, which are 1 km and 12–4 min at best, respectively. For this analysis, we used the multi-beam experiment pointing toward zenith and four oblique beams toward θ =6.8◦ as listed in Table 1 and depicted in Fig. 3 for O- and X-mode. For each Saura experiment run the horizontal
and vertical velocities are derived by a least-squares method, while for MAARSY the standard VEL out-put is used. For MAARSY the VEL outout-put is basically generated by converting radial velocities and nomi-nal beam pointing direction to vertical and horizontal wind components including averaging techniques. In a test we did not find significant differences between VEL and a least-squares fit as applied to the Saura data. Hence the already existing standard VEL output is used in the subsequent comparisons. For all comparison in this study, both time series are cleaned for outliers by a histogram method, which excludes data with less than 5% occurrence. The regression of the two data series is then done by applying the Deming method (see, e.g., Cornbleet and Gochman 1979). This method belongs to the group of total least squares, and contrary to the standard least squares, it allows for individual errors in both series to find the best line fit. For July 2017, horizontal winds of Saura and MAARSY are depicted as correlograms in Fig. 2. Equivalent results have been also found for the remaining months when PMSE can be observed, May to August 2017, as well as during the previous year, but are not shown here. The correlation between both dataset is pretty good ( r=0.9 ), in par-ticular with regard to the separation of 20 km between both systems, which actually probe a different volume as well as further geophysical differences like localized wave activity are not considered. Such effects were not seen in previous publications, but were certainly not that pronounced as hourly wind data was used. Besides the high correlation a significant and systematic devia-tion in the magnitudes is clearly seen. This underesti-mation of Saura DBS winds accounts for approximately 25% and will be investigated in the following.
Statistics of MF scattering positions
angular range of this antenna configuration using only the longest baselines reaches 14.4◦ off the nominal beam pointing direction. The nominal beam pointing can be vertical (zenith) or off-vertical depending on the actual experiment settings. For off-vertical pointing directions, the complex raw data can also be re-phased to cover a symmetric area around zenith. Incorporating the shorter baselines the angular coverage extends to almost 25◦ . We call these estimated positions quasi-unambiguous as of course positions outside the angular coverage will
be aliased. A discussion of ambiguous AOA positions is given in Appendix 1 of this manuscript.
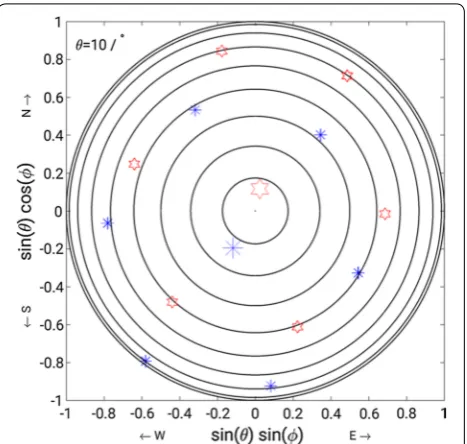
The detected average scattering positions for 65–85 km altitude are shown in Fig. 3 for almost 1 year of continu-ous data of DBS measurements into five beam directions using ordinary and extraordinary polarization. A similar distribution is also seen when the closely spaced anten-nas E2, E3 and Z2 are used, which give a larger angular range, but due to coupling effects of the antennas, this configuration is not preferred. For each beam pointing Fig. 2 Correlogram of winds derived with Saura DBS/VEL standard output versus MAARSY DBS/VEL winds derived from observations of polar mesospheric summer echoes (80–90 km altitude) for July 2017. The correlation value and number of data points is listed in the upper left corner, as well as the fitted linear function also marked in red on top of the scatter points
=5° /circ =5° /circ =5° /circ
=5° /circ 20161025 - 20171023 - no of files: 359
beam positions
obs. av. for 65-85km nominal
/ /
0° / 0.2°
54.8° / 5.1°
238.1° / 5.1°
326.9° / 5.3°
145.1° / 5° 0° / 0°
56.2° / 6.8°
236.2° / 6.8°
326.2° / 6.8°
146.2° / 6.8°
-0.2 -0.1 0 0.1 0.2
sin( ) sin( ) -0.2
-0.1 0 0.1 0.2
sin(
) cos(
)
0.2 0.4 0.6 0.8 1
direction in total approximately 100,000 valid scattering positions were analyzed with 0.2◦ angular resolution for the shown beam integrated count rates. Besides using a signal-to-noise criteria, no further selection of the time series data has been applied here before estimating the mean Angle of Arrival (MAOA).
The average position of the scattering structures of the whole dataset are estimated after fitting a 2D Gauss-ian function, which for this purpose should agree well enough to the observed shape of the distribution.
The average scattering location for the vertical beam corresponds well to the nominal zenith position, which underlines a suitable phase calibration is used for the MAOA estimation. For the oblique beam positions the scattering center seems to be near θ =5.1◦ instead of the nominal beam pointing direction of θ =6.8◦ , which cor-responds to an aspect sensitivity of θs=8◦.
The enhanced intensity of the vertical compared to the oblique beam directions (Fig. 3), is caused by higher individual count rate. In particular at the lower altitudes, radar echoes are often seen in the vertical beam only, but not in oblique beams. The scatter around the individual center position is in the order of ±2◦ (half intensity), so there is also a minor aggregation of scatter points from the four oblique beams at the vertical position. The dis-tribution of scattering positions for the oblique beams appears to be wider spread along the zenith angle than along the azimuth. For the vertical beam a slight defor-mation from circular to an oval shape is notable for the normalized count rates between 0.5 and 0.8. With the same orientation toward nearly northern and southern directions, additional scatter can be seen at approxi-mately θ =7.5◦ . This deformation is caused by the side lobes formed along the antenna array orientation ( 11.2◦ off north), that seems to be pronounced for the north and south array arms. Though, this still needs to be investi-gated, but indications for this additional scatter were found for the presence of particle precipitation events.
Recent maintenance to Saura did not reveal any tech-nical reason for the observed deviation of scattering and nominal beam position, but confirmed appropriate phase offset between the individual transmitter modules and antennas to steer the radar beam to the designated direc-tions. In agreement with the previously mentioned stud-ies, we therefore refer this deviation to aspect sensitivity or other forms of variability of the scattering structures and needs to be considered for the wind processing.
Applied wind estimation methods
The relatively large antenna array aperture of Saura results in a sufficiently small beam width that Doppler beam swinging methods (DBS) can be applied to meas-ure radial velocities for certain beam pointing directions.
For the oblique beams, the nominal half-power one-way beam width of the Saura radar is in the order of 6.3◦ using the entire array of 29 antennas. The radial velocities can be derived by using a) the spectral moments, b) fitting an adequate function (e.g., Gaussian-like) to the time series spectra or c) fitting the slope of the autocorrelation function, where for Saura the spectral methods give best results.
DBS measurements have been performed most of the operation time since the radar was built in 2002. Only few interruptions of this operation scheme occurred for special campaigns like dedicated meteor observations or maintenance. Having this rich dataset in mind, there is a huge interest in not only applying new techniques for recent operations, but also retrospectively adapt or improve the already collected data.
Generally, if a scattering structure exist within the illu-minated area near the beam pointing direction, the DBS technique offers maximum signal-to-noise ratio (SNR) as the entire antenna array is used on transmission and reception. Until now, typically no correction for the effec-tive scattering position was applied for Saura.
DBS winds including MAOA correction
The combination of the obtained radial velocities and nominal beam pointing directions allows the estimation of the horizontal and vertical wind vectors. This process-ing may be combined with averagprocess-ing techniques in time and range (altitude) to reduce the variability.
Holdsworth and Reid (2004) applied full correlation analysis (FCA) and also DBS techniques in combination with MAOA and post-statistic steering (PSS, see, e.g., Kudeki and Woodman 1990) to investigate the effects of the effective beam pointing to wind measurements. Simi-lar experiments have now been conducted with Saura mainly to correct for the observed scattering positions.
In the previous section we have shown the statistical positions of the scattering structures seen with Saura for one year between 65 and 85 km altitude. For all oblique beams transmitted to 6.8◦ zenith angles, most of the ech-oes are detected at around 5.1◦ (see Fig. 3). The azimuthal positions agrees pretty well to the nominal positions within one degree and only slightly affects the magnitude of the estimated horizontal winds. However, the displace-ment to near-zenith positions introduces a significant underestimation of horizontal winds if the nominal beam positions are used for the conversion.
superimposed instead of the nominal position results in an increase of about 25% in horizontal wind magni-tudes and thus shows a much better agreement to the MAARSY PMSE winds. This correction is especially interesting and useful to correct older data for which no AOA information is available.
Obviously, this method is only statistically giving the correct result, but might not necessarily be optimal for a specific period of time given the observed spread in the detected scattering positions. For this reason we now use the instantaneous MAOA positions instead of the average annual position of the scatterers for a given DBS experiment run, typically covering 4 min. In the case of too large angular separation ( 10◦ ) between the instanta-neous MAOA and the statistical scattering position, the earlier is assumed to be faulty and the statistical position is used in the further processing. This method allows smaller variations around the statistical position to be accounted for, but rejects presumably error-prone larger offsets that occur for low SNR or interference situations. For situations in which the individual detected radial velocities and beam positions don’t match, there won’t be results in the least-squares-fit matrix conversion. With this, a few artifacts that are seen at times in the statisti-cal correction at the lowermost altitudes are now mostly removed. Similar effects are often seen at higher altitudes typically above 85 km.
Similar to Fig. 2, the horizontal winds applying statis-tical and instantaneous MAOA corrections are again correlated with the MAARSY PMSE data. Both data-sets show equivalent scatter with a correlation factor of r=0.88 and r=0.9 for the statistical and instanta-neous MAOA approach, respectively. The data for the
instantaneous MAOA correction of the scattering posi-tion for July 2017 is shown in Fig. 4. The meridional Saura wind of this approach seems to be still underestimated, while the zonal wind is slightly larger than the MAARSY winds. On average, for both horizontal components, we find a regression slope of 0.97, so the earlier magnitude offset between the radars is mostly eliminated.
Imaging Doppler Interferometry ‑ IDI4
In the previous section, we highlighted the need to cor-rect for the scattering position of the observed radar targets by an either statistical or preferably instantane-ous value. This correction is done for every beam point-ing direction for one experiment run, of typically 4 min duration. The imaging Doppler interferometry technique (IDI) actually advances this idea as not only one domi-nant scattering position is derived, but multiple scatter-ers are assumed to contribute to the observed spectra. The complex cross-spectra of at least three separated antennas are split into individual frequency bins, which are treated as radial velocities for which corresponding scattering positions can be calculated by interferometric means. This allows for mapping radial velocity distribu-tions corresponding to their location. Calculating the scattering structures within IDI is similar to the AOA approach, not using correlation phases, but the phases of cross-spectral bins of the chosen antenna pairs in respect to their geometry.
IDI has been introduced by Adams et al. (1986, 1989) and revisited its application some years later by Palmer et al. (1995, 1996) for VHF radars as well as for HF/MF radars (Brosnahan and Adams 1993; Meek and Manson 1987; Roper and Brosnahan 1997).
Besides Palmer et al. (1995, 1996) applying IDI tech-niques to the narrow beam MST MU radar, IDI was more often applied to wide-beam MF radars. These radars illu-minate large portions of the D region with more than 100 km diameter at the time for 85 km altitude. Contrary to these radars, the illuminated area for the Saura radar is normally just 9 km wide, so we preferably use the DBS experiments with five interleaved beam positions and both magneto-ionic modes (O/X). Doing so, we increase the illuminated area and with this the total amount of observed scattering structures.
The IDI method used in this study for Saura data bases on the descriptions given by Palmer et al. (1995), but applying additional integration of complex time series or spectra and frequency decimation. For the five-beam scan experiment, we typically apply two spectral inte-grations and a subsequent frequency decimation by four to reduce the uncertainties of the individual points. For experiments with a large number of data points per beam, e.g., pointing exclusively toward zenith, a high spectral resolution and frequency span is available. In these cases it often appeared to be advantageous to utilize coherent integrations at first, but the resulting Nyquist frequency must permit the existing radial velocities to avoid aliasing. In addition, we clean the data by reject-ing potentially erroneous scatterreject-ing positions caused by ambiguous cross-spectral phases. The doubtful data points are detected as their radial velocity and associated detected zenith angle would exceed a horizontal velocity of 175 m/s. The weighting as described in Palmer et al. (1996) does not appear to be critical for the Saura. We, however, discard noisy data and with this unreliable scat-tering positions by applying a minimum SNR threshold of 3 to 6 dB to reject presumably unreliable bins of the cross-spectra.
In our experiments we favorably use four antennas in a “Y”-configuration to derive reliable positions of the scat-tering structures and abbreviated this approach by IDI4. Similar to the AOA estimations, described in “Statistics of MF scattering positions” section, we may resolve an angular range of up to 25◦ off the nominal beam point-ing uspoint-ing the shortest baselines. In this earlier section we have shown the statistical scatter positions (MAOA) using the same antenna configuration (see Fig. 3). The typical spread of the scatterers is in the order of about ±2◦ around their center position, while for off-vertical beam pointing directions a systematic offset toward zenith was observed. With this knowledge we may claim that for such conditions practically all scattering posi-tions will be within our angular coverage.
During July 2017 we also conducted a special experi-ment pointing the radar beam to θ =13.6◦ similar to the
standard DBS experiment with θ =6.8◦ . Besides the two
DBS experiments consisting of five beam directions each with O- and X-mode a vertical only O/X experiment was interleaved in the standard Saura measuring sequence. This vertical beam only experiment can also be used for IDI4 techniques, however, as the scattering structures seen with this experiment are pretty close to zenith, the spectra are rather narrow due to the small radial veloci-ties. Naturally, the error for the horizontal projection of scattering positions near zenith is much larger than for oblique beams. Nonetheless, applying accurate phase cal-ibration of the antenna-receiver combination still allow wind estimations, especially if they are used in combina-tion with oblique beam data to reject error-prone esti-mations. Combining all three experiments will not only improve the temporal resolution down to 4 min but also provides better coverage at lower altitudes. For almost the same experiment runtime, the vertical experiment
provides more pulses for that distinct direction than it is the case for the five-beam experiment, which also includes the vertical direction.
For sufficient signal strength and a minimum num-ber of 20 detected individual scattering structures IDI4 shows realistic wind structures and magnitudes. This is still true for the upper altitudes, where the classical DBS approach often fails due to the large number of concur-ring scatteconcur-ring structures, including meteors.
The comparison of IDI4 winds to MAARSY PMSE winds for July 2017 is depicted in Fig. 5. The correlation is equivalent to the standard and the previous methods with r=0.88 , while the scatter appears to be larger. The IDI4 winds seem to have slightly larger amplitudes than the MAARSY winds with a linear regression slope of about 1.1 on average. Similarly to the DBS with instan-taneous MAOA results, the meridional wind appears to be smaller than the zonal wind in comparison with MAARSY.
Combining methods to generate a reliable wind field Both presented methods, DBS including instantaneous MAOA correction and IDI4, show better agreement with the MAARSY wind data. However, both show different altitudinal coverage and should be combined properly for best performance. For a more explicit comparison we compared both Saura wind datasets for 2 km altitude bins to derive their correlation and the linear least-squares
regression. Figure 6 depicts the altitudinal resolved results as well as the averaged values for all available heights indicated as dashed lines between 65 and 70km in the three left panels and the mean wind and standard deviation of both methods in the right panel. The largest correlation is found between 75 and 92 km, which sup-ports the previous use of MAARSY PMSE winds at 80 to 90 km altitude as a suitable reference. From the slope of the fitted linear function, we can see that for most heights the IDI4 winds are slightly larger than the DBS results. Below 77 km the slopes of both horizontal wind compo-nents deviate, which is to some extent a matter of the pre-vailing summer wind situation and primarily caused by the rather weak meridional component. IDI4 appears to deliver fairly reliable winds for the entire range, but espe-cially above 75 km. Multiple scattering structures gener-ate severely broadened spectra at altitudes above 80 km, for which in the DBS method often only the mean radial velocity and mean scattering position may be estimated. Depending on the intensity of the individual scattering structures and their superposition, the radial velocities and for correction purpose more importantly the MAOA positions are likely error-prone. At the lowermost ranges the coverage of IDI4 is inferior to DBS, likely caused by the lesser SNR as only four instead of 28 antennas are used on reception, but also due to the prevailing narrow spectra at lower altitudes. Making use of more individual antennas, ideally sampling every antenna of the array,
would provide similar total SNR. Additionally, plenty of individual baselines would be available, improving the localization of the scatterer, if cross-correlation phases are unwrapped correctly or other suitable techniques are used. At these altitudes below 75 km, it is advanta-geous to apply DBS methods including the instantaneous MAOA positions of the scatterer.
Figure 7 shows the individual wind results applying DBS with instantaneous MAOA correction as well as IDI4 winds for 3 to 5 July 2017. At altitudes above 90 km gaps are seen for DBS, while IDI4 is still performing well. For example, the tidal structures are preserved especially for the meridional component.
As a final product for further studies, we therefore gen-erate a common wind field from both techniques. The higher altitudes are dominated by IDI4 (2:1 weight), while the lower altitudes are the average of DBS and IDI4, if both provide data. The different weighting for the upper altitudes is implemented as the already MAOA cor-rected DBS winds still seem to be fairly underestimated as only the dominating scattering position is derived. The
combined wind is shown for the July period in the lower panel of Fig. 7 as well as in Fig. 8 for a similar window in September 2017. The structures in the zonal wind com-ponent of the IDI4 and DBS July data appear to be rather bulky at higher altitudes, which is not seen in the meridi-onal component and in the September data. The latter period is of special interest as the middle atmosphere was characterized by a high ionization level due to the major solar and geomagnetic activity around 5th and 11th Sep-tember. This interesting situation allowed wind measure-ments with Saura showing reasonable tidal structures from 95 km down to 52 km altitude.
For the period of 1 to 25 July 2017, we also derived the power spectral density for the horizontal and verti-cal components of the combined dataset to underline its usefulness. For this, the combined wind data have been interpolated to a regular temporal grid using a polyno-mial fit as well as for existing short gaps ( <1 h). The inte-gration of five individual spectra generated for a 5-day window time series of horizontal and vertical wind each is depicted in Fig. 9. For both shown altitude regions,
70–80 km and 80–90 km, distinct peaks at 24 h, 12 h and 8 h periods, marking the dominating tidal components are found as well as a reasonable slope of the individual spectra.
Discussion
This study has been stimulated by the improved inter-ferometric capabilities of the Saura radar using mul-tiple receivers to estimate the actual positions of the Fig. 8 Saura wind combining DBS with instantaneous MAOA positions and IDI4 technique for 2017/09/15–17, representing a period of rather high electron density after major solar and geomagnetic activity on Sept 5th and 11th
10-5 10-4
frequency /Hz 105
106 107 108
power spectral density /
m
2 s -2 Hz
-1
zonal
24h
12h
8h f -1 f -5/3
70-80km 80-90km
10-5 10-4
frequency /Hz 105
106 107 108
meridional
24h
12h
8h f -1 f -5/3
70-80km 80-90km
10-5 10-4
frequency /Hz 102
103 104 105
vertical
24h
12h
8h f -1 f -5/3
70-80km 80-90km
radar signal scatterers. Improved beam positions may help to correct the underestimated horizontal winds of the Saura radar as found in comparisons to MAARSY winds obtained from PMSE observations. MAARSY PMSE winds using the DBS method with a minimum half-power beam width of 3.6◦ are assumed to be highly reliable and the errors in the winds should be negligi-ble as long as sufficiently strong signals are used. This is especially true for this study where the highly resolved PMSE winds are used as a reference for 80–90 km altitude and are then adapted to the coarse altitudi-nal and temporal resolution of Saura. Contrary to our argumentation in this study regarding MF radar wind measurements, anisotropic scattering like aspect sensi-tivity should generally not play a role in PMSE winds as long as the scattering structures are volume filling, which has been shown by Sommer et al. (2016). This especially holds, of course, for the statistical monthly analysis done here, where the in principle randomly distributed PMSE structures are sufficiently long observed. For that reason, no aspect sensitivity correc-tion has been applied to the PMSE winds, which would actually intensify the MAARSY winds even more. From this current point of view, we rule out potential error sources in the PMSE winds. Both systems, how-ever, do not exactly probe the same volume as they are separated by 20 km, which might introduce recogniz-able differences in the measurements, but the south beams of MAARSY basically overlap with the northern beams of Saura. Therefore, we assume the Saura winds are most likely underestimated in the methods applied until now.
The probable and reasonable cause are the positions and the properties of scatterers seen by the Saura radar. Analyzing 1-year of raw data with interferometric means we found the dominant scattering positions at 5.1±2◦ instead of nominal beam pointing at 6.8◦ off-zenith.
Variations of the scattering positions may occur due to inhomogeneities of the radio refractive index in the horizontal and vertical direction and their superposition. Within the radar volume various forms of tilted, corru-gated or spherical shell layers, equivalently illustrated by Meek and Manson (1992), may exist. Localized turbu-lence that generates highly efficient scattering structures and different vertical thickness of the layers as well as particle precipitation events modify scattering proper-ties. All of these phenomena will modify the straight-lined wave propagation.
As the derived statistical positions for one year of data are still rather distinct, the cause seems to be regular and persistent. The spread of the detected positions originates from the beam width and short term random variabilities, though. A turbulence model of nonuniform scattering
properties, e.g., more anisotropic behavior at the edges and isotropic turbulence in the center of a distinct layer was proposed by Hocking (1989); Woodman and Chu (1989), causing refractive index fluctuations that would explain some of the observed effects. Enhanced spec-tral width at altitudes above 80 km and a high number of detected scatterers with IDI techniques are certainly an indicator of enhanced turbulence, but a rather equiva-lent offset between the nominal beam directions and the detected scattering positions is also seen at lower altitudes, where the spectra are very narrow. Therefore, the observed anisotropy is at least not exclusively caused by turbulence scattering, but likely to some extent is also related to spec-ular scattering, which was also quoted by Hocking and Röttger (2001) and references within. In a future study, the temporal evolution and altitudinal variability of the scat-tering positions throughout the year will be investigated. Analyzing additional beam pointing directions with larger zenith angle as well as the relation to turbulence and ioni-zation level might give additional information to charac-terize and clarify the observations done so far.
Holdsworth and Reid (2004) studied the influence of aspect sensitivity to MF radar wind measurements by estimating the scattering positions. For a 11-day cam-paign with the Buckland Park MF radar applying DBS and HDI methods, they also found a clear separation of the nominal beam position and the detected scatter-ing positions, referrscatter-ing to as effective beam positions ( θnom=13◦ , θeff =9.5◦). This distinct offset equals θs=7.7◦ and is similar to what was found in our study for
the Saura radar for which an aspect sensitivity of θs=8◦
can be attributed. They also found equivalent aspect sensitivity in the pattern scale parameter of FCA for the period of July 1996 to September 2003.
HDI techniques to the Saura radar making use of at least eight individual antennas will be investigated and evalu-ated in future.
For altitudes above 85 km we found times, when the DBS method does not provide wind estimates. For this altitude the Saura radar beam width roughly corresponds to a radar volume cylinder of 9 km diameter and typi-cally 1 km height, neglecting certainly existing side lobes. Several individual concurring scatterer exist within this large volume with a typical high electron number density of about 109 el/m3 and sufficiently large gradients. For a given time, a set of scattering structures are superim-posed in the observed time series and thus contribute to the spectra, but do not necessarily belong to the nomi-nal beam pointing direction. During these occasions the standard wind output and the statistical AOA corrected version often do not show reliable results as either too small or no wind values are derived. Too large ampli-tudes in the vertical wind component are a good indica-tor for such situations. As another complication, the side lobe attenuation is rather poor for the Saura antenna array, partially −6 dB at worst. Efficient scatter may be picked up from the sides and related to wrong altitudes for classical DBS methods without interferometric sup-port. Under most conditions the side lobe attenuation is not a problem, however, meteors are often detected far off the nominal beam pointing. For the case of using instantaneous scattering positions, these effects are not that pronounced as either reliable dominant positions are detected or the data of an unsuitable combination of radial velocities and scattering positions is discarded (see Figs. 7 and 8 for examples).
The idealized, but typically applicable scheme of well defined radar volume is also severely distorted during particle precipitation events, which occur frequently in geomagnetic active times at polar latitudes (see Renkwitz and Latteck 2017, for corresponding Saura observations). Multiple angularly wide spread scattering structures occur during these times, that contribute to the detected spectra. Such broad spectra, however, are very useful for IDI techniques, which are capable to attribute radial velocities to a number of individual scattering positions. For that reason our IDI4 implementation shows much better results for the higher altitudes than DBS methods. Therefore, they will certainly also agree much better to specular meteor radar winds, for which Wilhelm et al. (2017) found generally too small magnitudes in the Saura data until 2014. A revision of this study for the improved Saura winds available since the upgrades in 2015 is recommended.
At lower altitudes the spectra are much narrower most of the times and with that only few scattering positions are detected near the nominal position. Therefore, it
proved to be advantageous for the Saura to preferably apply IDI4 to oblique beam measurements showing rea-sonable wind structure and magnitudes in comparison with MAARSY PMSE winds. Whereas due to the lower SNR, the lower most altitudes are not as good covered by IDI as it is with DBS applying AOA corrections.
Both DBS wind methods show high correlations to PMSE winds observed by the MAARSY radar ( r=0.9 ), while for IDI4 the correlation factor is just negligibly smaller ( r=0.88 ). For best results and coverage a com-bined dataset is generated by DBS including instantane-ous MAOA positions for the lower altitudes and IDI4 predominantly for the higher altitudes. This combined dataset shows reasonable magnitudes as well as coherent tidal structures and appears to be very reliable.
Another indicator as a figure of merit, wind power spectral densities are calculated for July 1–25, 2017 for the combining data (see Fig. 9). Here, five spectra of each 5-day window time series of zonal and meridional winds are integrated. The diurnal and semidiurnal tides as well as the characteristic slopes of f−1 to f−5/3 for structures generated by turbulence from the inertial frequency down to the smallest resolved scales are seen. The slope for the lower altitude window (70–80 km) roughly fol-lows f−1 , while the upper altitudes (80–90 km) are closer to a f−5/3 slope. The slope for the vertical wind appears to be flat for larger scales, but steepens for periods below 2 h. Equivalent to our upper altitude window, Hoffmann et al. (2010) have shown spectra with a slope of f−5/3 for 82 km altitude as well as 24 h and 12 h tidal peaks in hourly horizontal FCA winds observed by the former MF-Andenes radar, at almost the same location, for each quarter in 2008. In agreement to these findings, Sato et al. (2017) have recently presented summer wind spec-tra for PMSE heights (84–88 km) in Antarctica following a f−5/3 slope for the horizontal winds, while the vertical winds follow f−1.
Conclusions
In the standard wind analysis used for the Saura radar until now, it was always assumed that nominal beam pointing direction and the actual scattering position are identical. However, in a recent study consistently too small horizontal wind magnitudes were found in com-parison with MAARSY PMSE winds. As a potential cause the deviation of the scattering position from the nominal beam pointing direction was speculated.
this study we found dominant scattering positions shifted toward zenith, typically referred to aspect sensitivity, for which we calculated θs=8◦ on average, which is in
agreement to other publications applying similar tech-niques. We, however, also attribute the spread of the scat-tering positions to short term variability of the scatscat-tering structures itself like their shape, orientation and of course the superposition of multiple structures within the radar volume as well as occurring meteor events.
The underestimation of Saura winds in the classical DBS method is revised by applying the effective beam position from the statistical or preferably instantane-ous scattering position, for every 4-min experiment run. Improvements are seen at lower heights near the SNR threshold for DBS using AOA corrected scat-tering positions, in the presence of noise spikes or interference. At higher altitudes, e.g., above 85 km, multiple concurring scatterer exist, that can be prop-erly treated by IDI techniques using four antennas in a “Y”-configuration.
Furthermore, the high temporal resolution of 4 min for IDI is particularly interesting, however the variability seen within such cadence and its reliability needs to be investigated and proven.
Another major advantage of IDI is the immunity to unusual broad spectra as seen during particle precipita-tion events that frequently occur at polar latitudes dur-ing geomagnetic distorted times. For such situations the DBS approach often leads to a faulty wind estimation as radial velocity components are unintentionally attributed to wrong (higher) altitudes and multiple spectral peaks cannot be treated correctly. Finally a combined dataset has been generated employing the AOA corrected DBS method for the lower and IDI for the higher altitudes. This combined dataset shows reasonable wind structures with magnitudes equivalent to MAARSY PMSE winds as well as high correlations of r=0.9.
After all, the methods presented here cope with the horizontal wind underestimation and we have shown the benefit in combining DBS and IDI methods to generate a reliable wind field. For older data where no interferomet-ric capabilities were available, the statistical scattering positions to correct DBS winds should be used for poten-tial re-analysis.
Authors’ contributions
TR and JLC conceived the presented idea. TR prepared and analyzed most of the presented data and wrote the manuscript. MT contributed to the manuscript with additional analysis methods and comparable computa‑ tions, sorting the content and rewording sections. FIL verified the wind data and spectral analysis as well as performed rewording and proof reading. JLC accounted for additional analysis ideas, proposed using IDI wind techniques and sorted the manuscript content. RL prepared and provided various wind data set of the MAARSY radar. All authors discussed the results and contrib‑ uted to the manuscript. All authors read and approved the final manuscript.
Author details
1 Radar Remote Sensing, Leibniz‑Institute of Atmospheric Physics at the Uni‑
versity of Rostock, Schlossstraße 6, Kühlungsborn 18225, Germany. 2 National
Institute of Polar Research, Tachikawa, Japan. 3 Department of Polar Science,
National University SOKENDAI (Graduate University for Advanced Studies), Hayama, Japan.
Acknowlegements
The authors explicitly acknowledge discussions with Werner Singer and Peter Hoffmann including their proposed changes to the manuscript. We further‑ more express our gratitude to the Andøya Space Center for their permanent support for the operation and maintenance of both radars Saura and MAARSY. We are grateful for the referees’ comments, which identified inaccuracies in the initial version.
Competing interests
The authors declare that they have no competing interests.
Availability of data and materials Please contact author for data requests.
Funding
The MAARSY radar development was supported by the German grant 01 LP 0802A of the Bundesministerium für Bildung und Forschung.
Appendix 1—Ambiguity of angle of arrival positions with Saura
Unambiguous angle of arrival (AOA) positions may be derived by triangle antenna configuration with baseline lengths or differences of baseline length smaller than 0.5 . It has to be noted that for the analysis in this manu-script the derived scattering positions are not unambigu-ous per se for the chosen antenna configuration (N2, N4, Z1, Z2), but there are normally another six solutions for the positions possible. We show two examples with nom-inal position and ambiguous positions in Fig. 10 and list them in Table 2. These positions have been calculated considering 2 π phase ambiguity and 1◦ uncertainty of the individual antenna phases. These examples show, that other existing solutions are separated by about 50◦ from the nominal position.
Nevertheless, we stated throughout the manuscript, that we are able to derive the quasi-unambiguous posi-tions of the scatterers. This assumption bases on the knowledge that the scatterers are well localized within about ±2◦ off the center scatter position as shown in Fig. 3. Most of the spread is associated with the 6.3◦ beam width of the transmit radiation pattern. An equivalent distribution of the scattering positions is also seen when using the closely spaced antennas E2, E3, Z2 forming an isosceles triangle of 0.74 (see Fig. 1 for reference) and thus offering a larger unambiguous angular range, which supports our assumption.
Publisher’s Note
Springer Nature remains neutral with regard to jurisdictional claims in pub‑ lished maps and institutional affiliations.
Received: 16 March 2018 Accepted: 17 September 2018
References
Adams GW, Brosnahan JW, Walden DC, Nerney SF (1986) Mesospheric obser‑ vations using a 2.66‑MHz radar as an imaging Doppler interferometer: description and first results. J Geophys Res Space Phys 91(A2):1671–1683. https ://doi.org/10.1029/JA091 iA02p 01671
Adams GW, Brosnahan JW, Johnson RE (1989) Aspect sensitivity of 2.66‑MHz radar returns from the mesosphere. Radio Sci 24(2):127–132. https ://doi. org/10.1029/RS024 i002p 00127
Briggs BH (1984) The analysis of spaced sensor records by correlation tech‑ niques. MAP Handb 13:166–186
Brosnahan J, Adams G (1993) The MAPSTAR imaging Doppler interferometer (IDI) radar: description and first results. J Atmos Terr Phys 55(3):203–228. https ://doi.org/10.1016/0021‑9169(93)90067 ‑9, http://www.scien cedir ect.com/scien ce/artic le/pii/00219 16993 90067 9, Arecibo initiative dynam‑ ics of the atmosphere, AIDA act ’89
Cornbleet PJ, Gochman N (1979) Incorrect least‑squares regression coefficients in method‑comparison analysis. Clin Chem 25(3):432–438. http://clinc hem.aaccj nls.org/conte nt/25/3/432
Czechowsky P, Rüster R, Schmidt G (1979) Variations of mesospheric struc‑ tures in different seasons. Geophys Res Lett 6:459–462. https ://doi. org/10.1029/GL006 i006p 00459
Hocking WK (1989) Seasonal variation of turbulence intensities in the upper mesosphere and lower thermosphere measured by radar techniques. In: Edwards B (ed) Middle atmosphere program. Handbook for MAP, vol 27. http://adsab s.harva rd.edu/abs/1989m aph...27..439H
Hocking A, Hocking WK (2007) Turbulence anisotropy determined by wind profiler radar and its correlation with rain events in Montreal, Canada. J Atmos Ocean Technol 24(1):40–51. https ://doi.org/10.1175/JTECH 1964.1 Hocking WK, Röttger J (2001) The structure of turbulence in the middle and
lower atmosphere seen by and deduced from MF, HF and VHF radar, with special emphasis on small‑scale features and anisotropy. Ann Geophys 19(8):933–944. https ://doi.org/10.5194/angeo ‑19‑933‑2001, https ://www. ann‑geoph ys.net/19/933/2001/
Hoffmann P, Becker E, Singer W, Placke M (2010) Seasonal variation of mesospheric waves at northern middle and high latitudes. J Atmos Sol Terr Phys 72(14):1068–1079. https ://doi.org/10.1016/j.jastp .2010.07.002, http://www.scien cedir ect.com/scien ce/artic le/pii/S1364 68261 00019 87 Holdsworth DA, Reid IM (1995) Spaced antenna analysis of atmospheric
radar backscatter model data. Radio Sci 30(5):1417–1433. https ://doi. org/10.1029/95RS0 1888
Holdsworth DA, Reid IM (1997) An investigation of biases in the full correla‑ tion analysis technique. Adv Space Res 20(6):1269–1272. https ://doi. org/10.1016/S0273 ‑1177(97)00784 ‑9, http://www.scien cedir ect.com/ scien ce/artic le/ pii/S0273 11779 70078 49, coupling and Energetics in the Stratosphere‑Mesosphere‑Thermosphere‑Ionosphere System Holdsworth D, Reid I (2004) The Buckland Park MF radar: routine observation
scheme and velocity comparisons. Ann Geophys 22:3815–3828. https :// doi.org/10.5194/angeo ‑22‑3815‑2004
Jones J, Webster AR, Hocking WK (1998) An improved interferometer design for use with meteor radars. Radio Sci 33:55–65
Kudeki E, Woodman RF (1990) A poststatistics steering technique for MST radar applications. Radio Sci 25(4):591–594. https ://doi.org/10.1029/ RS025 i004p 00591
Latteck R, Singer W, Rapp M, Vandepeer B, Renkwitz T, Zecha M, Stober G (2012) The new MST radar on Andøya: system description and first results. Radio Sci. https ://doi.org/10.1029/2011R S0047 75
Lau EM, Avery SK, Avery JP, Janches D, Palo SE, Schafer R, Makarov NA (2006) Statistical characterization of the meteor trail distribution at the South Pole as seen by a VHF interferometric meteor radar. Radio Sci. https ://doi. org/10.1029/2005R S0032 47
Lesicar D, Hocking W (1992) Studies of seasonal behaviour of the shape of mesospheric scatterers using a 1.98 MHz radar. J Atmos Terr Phys 54(3):295–309. https ://doi.org/10.1016/0021‑9169(92)90009 ‑A, http:// www.scien cedir ect.com/scien ce/artic le/pii/00219 16992 90009 A Lesicar D, Hocking W, Vincent R (1994) Comparative studies of scatterers
observed by MF radars in the southern hemisphere mesosphere. J Atmos Terr Phys 56(5):581–591. https ://doi.org/10.1016/0021‑9169(94)90099 ‑X, http://www.scien cedir ect.com/scien ce/artic le/pii/00219 16994 90099 X, solar Terrestrial Energy Program (STEP)
Lübken FJ (1999) Thermal structure of the Arctic summer mesosphere. J Geo‑ phys Res 104:9135–9149. https ://doi.org/10.1029/1999J D9000 76 Mailaender L, Affes S, Juntti M, Pesavento M (2011) Advances in angle‑of‑
arrival and multidimensional signal processing for localization and communications. EURASIP J Adv Signal Process 1:94. https ://doi. org/10.1186/1687‑6180‑2011‑94
Meek CE, Manson AH (1987) Mesospheric motions observed by simultaneous medium‑frequency interferometer and spaced antenna experiments. J Fig. 10 Example of ambiguous angle of arrival positions for two
assumed scattering positions at φ=211.2◦,θ=13.2◦ and φ=11.2◦ ,θ=6.8◦ marked in red and blue by large asterisk and hexagon
marker, respectively. The ambiguous positions are separated by at least 50◦ off the nominal position and shown with the same color but
smaller marker size
Table 2 List of two nominal and their respective ambiguous positions for the chosen Saura antenna configuration
φ θ φ θ
211.2◦ 13.2◦ 11.2◦ 6.8◦
40.6◦ 31.9◦ 34.3◦ 59.6◦
121.0◦ 39.3◦ 91.3◦ 43.3◦
174.9◦ 68.1◦ 160.0◦ 40.6◦
216.3◦ 79.2◦ 222.4◦ 40.7◦
265.3◦ 51.6◦ 291.2◦ 43.3◦
Geophys Res Atmos 92(D5):5627–5639. https ://doi.org/10.1029/JD092 iD05p 05627
Meek C, Manson A (1992) Angle‑of‑arrival oscillations in the mesosphere as seen by medium frequency (MF) radar. J Atmos Terr Phys 54(3):277–293. https ://doi.org/10.1016/0021‑9169(92)90008 ‑9, http://www.scien cedir ect.com/scien ce/artic le/ pii/00219 16992 90008 9
Palmer RD, Huang X, Fukao S, Yamamoto M, Nakamura T (1995) High‑resolu‑ tion wind profiling using combined spatial and frequency domain inter‑ ferometry. Radio Sci 30(6):1665–1679. https ://doi.org/10.1029/95RS0 2594 Palmer RD, Vangal S, Larsen MF, Fukao S, Nakamura T, Yamamoto M (1996)
Phase calibration of VHF spatial interferometry radars using stellar sources. Radio Sci 31:147–156. https ://doi.org/10.1029/95RS0 2319 Placke M, Hoffmann P, Latteck R, Rapp M (2015a) Gravity wave momentum
fluxes from MF and meteor radar measurements in the polar MLT region. J Geophys Res Space Phys 120(1):736–750. https ://doi.org/10.1002/2014J A0204 60,2014J A0204 60
Placke M, Hoffmann P, Rapp M (2015b) First experimental verification of summertime mesospheric momentum balance based on radar wind measurements at 69° N. Ann Geophys 33(9):1091–1096. https ://doi.org/10.5194/angeo ‑33‑1091‑2015, https ://www.ann‑geoph ys.net/33/1091/2015/
Rapp M, Lübken FJ (2004) Polar mesosphere summer echoes (PMSE): review of observations and current understanding. Atmos Chem Phys 4:2601– 2633. https ://doi.org/10.5194/acp‑4‑2601‑2004
Reid IM (2015) MF and HF radar techniques for investigating the dynamics and structure of the 50 to 110 km height region: a review. Prog Earth Planet Sci 2:33. https ://doi.org/10.1186/s4064 5‑015‑0060‑7
Renkwitz T, Latteck R (2017) Variability of virtual layered phenomena in the mesosphere observed with medium frequency radars at 69° N. J Atmos Sol Terr Phys 163(Supplement C):38–45. https ://doi.org/10.1016/j.jastp .2017.05.009, http://www.scien cedir ect.com/scien ce/artic le/pii/S1364 68261 73007 92, Long‑term changes and trends in the upper atmosphere Roper RG, Brosnahan JW (1997) Imaging Doppler interferometry and the
measurement of atmospheric turbulence. Radio Sci 32(3):1137–1148. https ://doi.org/10.1029/97RS0 0089
Röttger J (1980) Structure and dynamics of the stratosphere and mesosphere revealed by VHF radar investigations. Pure Appl Geophys 118:494–527. https ://doi.org/10.1007/BF015 86465
Sato K, Kohma M, Tsutsumi M, Sato T (2017) Frequency spectra and vertical profiles of wind fluctuations in the summer Antarctic mesosphere revealed by MST radar observations. J Geophys Res Atmos 122(1):3–19. https ://doi.org/10.1002/2016J D0258 34,2016J D0258 34
Singer W, Latteck R, Holdsworth D (2008) A new narrow beam Doppler radar at 3 MHz for studies of the high‑latitude middle atmosphere. Adv Space Res 41:1488–1494
Singer W, Latteck R, Friedrich M, Wakabayashi M, Rapp M (2011) Seasonal and solar activity variability of D‑region electron density at 69° N. J Atmos Sol Terr Phys 73(9):925–935. https ://doi.org/10.1016/j.jastp .2010.09.012, http://www.scien cedir ect.com/scien ce/artic le/pii/S1364 68261 00027 25 Sommer S, Stober G, Chau JL (2016) On the angular dependence and scatter‑
ing model of polar mesospheric summer echoes at VHF. J Geophys Res Atmos 121(1):278–288. https ://doi.org/10.1002/2015J D0235 18,2015J D0235 18
Vincent RA, May PT, Hocking WK, Elford WG, Candy BH, Briggs BH (1987) First results with the Adelaide VHF radar: spaced antenna studies of tropo‑ spheric winds. J Atmos Sol Terr Phys 49:353–366
Wilhelm S, Stober G, Chau JL (2017) A comparison of 11‑year mesospheric and lower thermospheric winds determined by meteor and MF radar at 69° N. Ann Geophys 35(4):893–906. https ://doi.org/10.5194/angeo ‑35‑893‑ 2017, https ://www.ann‑geoph ys.net/35/893/2017/
Woodman RF, Chu YH (1989) Aspect sensitivity measurements of VHF back‑ scatter made with the Chung‑Li radar: plausible mechanisms. Radio Sci 24(2):113–125. https ://doi.org/10.1029/RS024 i002p 00113