P R O C E E D I N G S
Open Access
Linear models for breeding values prediction in
haplotype-assisted selection - an analysis of
QTL-MAS Workshop 2011 Data
Anna Mucha
*†, Heliodor Wierzbicki
†From
15th European workshop on QTL mapping and marker assisted selection (QTLMAS)
Rennes, France. 19-20 May 2011
Abstract
Background:The aim of this study was to estimate haplotype effects and then to predict breeding values using linear models. The haplotype based analysis enables avoidance of loosing information due to linkage disequilibrium between single markers. There are also less explanatory variables in the linear model which makes the estimation more reliable.
Methods:Different methods and criteria for marker and haplotype selection were considered. First, markers with MAF lower than 5% where excluded from the data set. Then, SNPs in complete linkage disequilibrium where selected. Next step was to construct haplotypes and to estimate their frequencies basing on selected SNPs. The haplotypes with a frequency lower than 1% were not considered in further analysis. Chosen haplotypes were used as the explanatory variables in the linear models for breeding values prediction. Linear models with fixed and random haplotype effects as well as animal model were tested.
Results:The number of markers was limited to 1206, 1189, 1249, 1288 and 1167 for chromosome 1, 2, 3, 4 and 5, respectively due to MAF criterion. In total 409 subsets of SNPs with r2=1 were found. 1476 haplotypes with different lengths were inferred. The frequencies of 817 haplotypes were higher than 1% - 184 for the first
chromosome, 172 for the second, 131 for the third, 146 for the forth and 184 haplotypes for the fifth chromosome. The haplotype effects estimated using random models were comparable and more precise in prediction for individuals with unknown phenotypes. A few haplotypes with large effects were found when their effects were defined as fixed in the linear model . The correlations of the predicted breeding values with true breeding values were not that high. This could be brought about by selection criteria imposed on the genotype data which led to substantial reduction of number of markers.
Conclusions:Although not many markers were considered in the study, the results obtained show that the implemented approach can be considered as quite promising. The haplotype approach let to avoid high dimensional models as compared with single SNPs models.
Background
Single Nucleotide Polymorphisms (SNPs) are the most widely used genetic markers for breeding value predic-tion [1]. Nonetheless, each SNP has relatively low content of genetic information. The haplotype approach gives a possibility to accumulate genetic information in
haplotype blocks and to keep the Linkage Disequilibrium (LD) information in the statistical model [2]. Thus, the haplotype-assisted selection can be a very powerful tool in animal breeding [3].
Methods
The QTL MAS 2011 simulated dataset was analysed to predict breeding values of individuals with known (2000 observations) and unknown (1000 observations) pheno-types. Genotype data were selected according to three
* Correspondence: [email protected] †Contributed equally
Department of Genetics, Wrocław University of Environmental and Life Sciences, Kożuchowska 7, Wrocław 51-631, Poland
criteria. Markers with Minor Allele Frequency (MAF) lower than 5% were excluded from the dataset. Then, LD between markers was measured using r2. SNPs in com-plete LD with at least one other SNP were picked out for further analysis. Basing on subsets of closely linked mar-kers (MAF>5%, r2=1), haplotypes were constructed. Baye-sian algorithm implemented in PHASE was used for haplotypes construction and for their frequencies estima-tion [4]. Haplotypes with populaestima-tion frequency lower than 1% were omitted in further analysis [5]. Inferred haplotype effects were estimated using statistical models for breeding values prediction. Four statistical models were considered. Fixed model (FM) handled haplotypes effects as fixed. The fitted model was the following: y = 1nμ1+Xg1+e1, wherey
is a vector of phenotypes, 1nis a vector of ones,nis
num-ber of known phenotypes,μ1 is an overall mean,Xis a
design matrix of haplotype effects,g1is a vector of fixed
haplotype effects,e1is a vector of random residual effects
and e1∼N(0,σe21). Two random models (RM1 and
RM2) treated haplotype effects as random. RM1 was the following:y=1nμ2+Xg2+e2, wherey,1n,n,μ2,Xare defined
analogically as above,g2is a vector of random haplotype
effects and g2∼N
dom residual effects and e2∼N
0,σe22. RM2 was the following:y=1nμ3+Xg3+e3, wherey,1n,n,μ3,Xare defined
analogically as above,g3is a vector of random haplotype
effects and g3∼N
of random residual effects and e3∼N
0,σ2
e3
. In RM1 the homogeneous variance whatever haplotype length, and in RM2 the heterogeneous variance depending of the hap-lotype length was assumed. Animal model (AM) was also fitted to the data to predict breeding values and to com-pare results obtained with previous models. AM was defined as follows:y=1nμ+Zg+e, wherey,1n,n,μare defined
as in previous models,Z is a design matrix of random additive polygenic effects,gis a vector of random additive polygenic effects and g∼N0,Aσ2
g ,Ais the numerator
relationship matrix,eis a vector of random residual effects and e∼N0,σ2
e
. The breeding values for individualj estimated using FM, RM1 and RM2 were defined as a sum of haplotype effects of the individual. The results of con-sidered models were compared using the Pearson’s corre-lation coefficients. All computations were performed using R-package.
Results
MAF and LD reduction
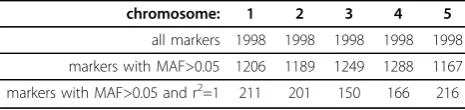
The results of MAF and LD reduction are shown in table 1. When MAF was used as a selection criterion
the number of markers was limited from 1998 to 1206, 1189, 1249, 1288 and 1167 for chromosome 1, 2, 3, 4 and 5, respectively. LD between selected markers was investigated and the subsets of SNPs with r2=1 were allocated. 211 SNPs from the first chromosome were a base for construction of subsets of markers and inferring haplotypes. Analogically, 201 SNPs, 150 SNPs, 166 SNPs and 216 SNPs with r2=1 with at least one other marker were allocated for chromosome 2, 3, 4 and 5, respec-tively. Among selected SNPs different sizes of subsets were found. The sizes and numbers of SNPs subsets are shown in table 2. In total 409 subsets of SNPs were found. For example, 75 subsets consisted of 2 SNPs, 12 subsets consisted of 3 SNPs, 3 subsets consisted of 4 SNPs, 1 subset consisted of 5 SNPs and 1 subset con-sisted of 8 SNPs were obtained for the first chromo-some. The results for remaining chromosomes can be read analogically from table 2.
Reduction by haplotype frequencies
A total of 1476 haplotypes with different lengths were inferred - 328 for the first chromosome, 309 for the second, 240 for the third, 262 for the forth and 337 haplotypes for the fifth chromosome. The frequencies of 817 haplotypes were higher than 1% - 184 for the first chromosome, 172 for the second, 131 for the third, 146 for the forth and 184 haplotypes for the fifth chromo-some (table 3). Among haplotypes with frequency higher than 1%, there were 644 haplotypes consisted of 2 alleles, 123 haplotypes consisted of 3 alleles, 34 haplo-types consisted of 4 alleles, 10 haplohaplo-types consisted of 5 alleles, 2 haplotypes consisted of 6 alleles, 2 haplotypes consisted of 7 alleles and 2 haplotypes consisted of 8 alleles (table 3).
Breeding values prediction
The constructed haplotypes were used for breeding values prediction. First, the haplotype effects estimated using FM, RM1 and RM2 were investigated. The results of FM and RM1 estimation are shown in Figure 1. The haplotype effects estimated using RM1 and RM2 were highly comparable. The correlation between them was 0.9607. The FM results differed markedly as compared with the random models results. The correlation between haplotype effects estimated using FM and RM1 was 0.1737, whereas the correlation between haplotype effects estimated using FM and RM2 was 0.1656.
Table 1 MAF and LD reduction
chromosome: 1 2 3 4 5
all markers 1998 1998 1998 1998 1998
markers with MAF>0.05 1206 1189 1249 1288 1167
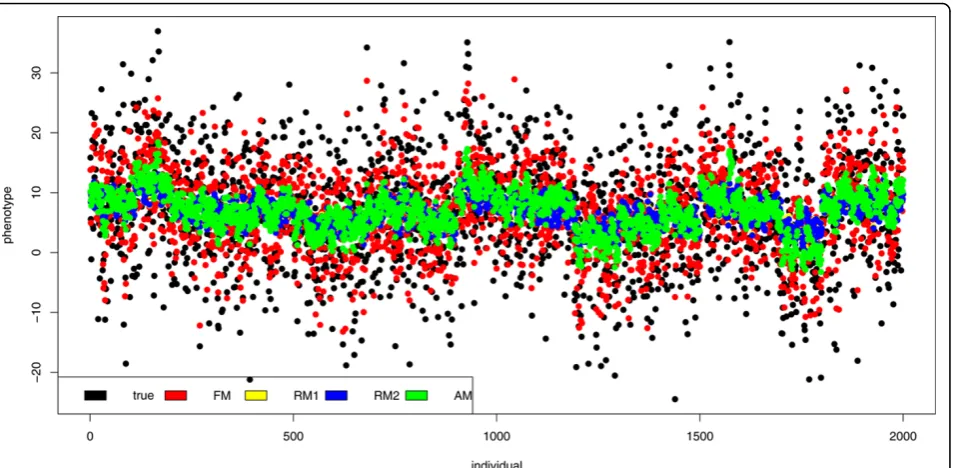
All models were used for breeding values and there-after for phenotype values prediction, especially for the individuals with unknown phenotype (all phenotypes were published after QTL MAS Workshop 2011). The results of phenotypes prediction and the true values for individuals with known phenotypes are shown in Figure 2. The results of FM and AM were closer to the true values than other results. The correlation between true phenotypes and the FM results was 0.7145, whereas between true phenotypes and the AM results was 0.7315. The phenotypes predicted using random models (RM1 and RM2) were highly comparable (with the cor-relation of 0.9974 between them), but less correlated with true values (0.4872 and 0.4911, respectively), than FM and AM results. These and remaining correlations were statistically significant (p < 0.05) and are shown in table 4. The results of phenotypes prediction and the true values for individuals with unknown phenotypes are shown in Figure 3, which shows that the results of RM1 and RM2 were more precise than the other ones.
The correlations between phenotypes predicted with these models and true values were 0.7043 and 0.7052, respectively. These predictors were also very similar (correlation 0.9972). In case of unknown phenotypes FM gave less precise results. The correlation with the true value was 0.4873. The AM predictors were corre-lated with true values at 0.6081. These and remaining correlations were statistically significant (p < 0.05) and are shown in table 4.
Discussion
The MAF and LD reduction results were comparable and there were not substantial differences between chro-mosomes. The haplotypes consisted of 2 alleles were predominant. The longest haplotype length was 8 alleles. The longer haplotype, the lower was its frequency and the less haplotypes fulfilled the threshold of 1%. A few haplotypes with large effects were found using the fixed model. The negligible differences between results obtained using RM1 and RM2 were probably caused by
Table 2 Subsets of SNPs after MAF and LD reduction
chromosome subset of SNPs
all 2-SNP 3-SNP 4-SNP 5-SNP 6-SNP 7-SNP 8-SNP
1 92 75 12 3 1 - - 1
2 87 67 16 3 - - 1
-3 65 52 8 3 2 - -
-4 73 57 12 4 - - -
-5 92 71 14 4 2 1 -
-TOTAL 409 322 62 17 5 1 1 1
Table 3 Number of haplotypes according to chromosome, haplotype length and frequency
Haplotype length subset chromosome TOTAL
1 2 3 4 5
all all 328 309 240 262 337 1476
freq>1% 184 172 131 146 184 817
2 all 232 215 173 187 235 1042
freq>1% 150 134 104 114 142 644
3 all 56 70 35 49 44 254
freq>1% 24 30 17 24 28 123
4 all 18 14 16 26 24 98
freq>1% 6 6 6 8 8 34
5 all 8 - 16 - 22 46
freq>1% 2 - 4 - 4 10
6 all - - - - 12 12
freq>1% - - - - 2 2
7 all - 10 - - - 10
freq>1% - 2 - - - 2
8 all 14 - - - - 14
small disparities between haplotype lengths (from 2 to 8 alleles). Regardless of heterogeneous (RM2) or homoge-neous (RM1) variance assumption, the breeding values prediction results were comparable. FM and AM gave better results for the individuals with known pheno-types, whereas RM1 and RM2 were more precise in
prediction for individuals with unknown phenotypes. The correlations of the predicted breeding values with true breeding values were not high and ranged from 0.4872 to 0.7315. This could be brought about by selec-tion criteria imposed on the genotype data which led to substantial reduction of number of markers.
Figure 1Haplotype effects. Figure shows the scale of haplotype effects estimated using fixed model (FM), the first random model (RM1) and the second random model (RM2).
Conclusions
Although not many markers were considered in the study (outcome of complete LD as a marker selection criterion), the results obtained show that the implemented approach can be considered as quite promising. The random models (RM1 and RM2) gave highly comparable results, more precise for individuals with unknown phenotypes. The haplotype approach let to avoid high dimensional models as compared with single SNPs models.
List of abbreviations used
SNP: Single Nucleotide Polymorphisms; LD: Linkage Disequilibrium; MAF: Minor Allele Frequency; FM: Fixed model; RM: Random models; AM: Animal model.
Acknowledgements
The QTL-MAS Workshop 2011 organizers are acknowledged for simulating the dataset and providing true phenotype values.
This article has been published as part ofBMC ProceedingsVolume 6 Supplement 2, 2012: Proceedings of the 15th European workshop on QTL mapping and marker assisted selection (QTL-MAS). The full contents of the supplement are available online at http://www.biomedcentral.com/bmcproc/ supplements/6/S2.
Competing interests
The authors declare that they have no competing interests.
Published: 21 May 2012
References
1. Kolbehdari D, Schaeffer LR, Robinson JAB:Estimation of genome wide haplotype effects in half-sib designs.J Anim Breed Genet2007, 124(6):356-361.
Table 4 Correlations between true and predicted phenotypes
MODEL true FM RM1 RM2 AM
true 1 0.4873
The correlations between true and predicted phenotypes for individuals with known phenotype (below diagonal). The correlations between true and predicted phenotypes for individuals with unknown phenotype (above diagonal). 95% confidence intervals for correlations are shown in brackets.
2. Sham PC, Rijsdijk FV, Knight J, Makoff A, North B, Curtis D:Haplotype Association Analysis of Discrete and Continuous Traits Using Mixture of Regression Models.Behav Genet2004,34(2).
3. Calus MPI, Meuwissen THE, de Roos APW, Veerkamp RF:Accuracy of Genomic Selection Using Different Methods to Define Haplotypes.
Genetics2008,178:553-561.
4. Stephens M, Smith NJ, Donnelly P:A new statistical method for haplotype reconstruction from population data.Am J Human Genet2001, 68:978-989.
5. Hayes B, Hagesæther N, Ådnøy T, Pellerud G, Berg PR, Lien S:Effects on Production Traits of Haplotypes Among Casein Genes in Norwegian Goats and Evidence for a Site of Preferential Recombination.Genetics 2006,174:455-464.
doi:10.1186/1753-6561-6-S2-S11
Cite this article as:Mucha and Wierzbicki:Linear models for breeding values prediction in haplotype-assisted selection - an analysis of QTL-MAS Workshop 2011 Data.BMC Proceedings20126(Suppl 2):S11.
Submit your next manuscript to BioMed Central and take full advantage of:
• Convenient online submission
• Thorough peer review
• No space constraints or color figure charges
• Immediate publication on acceptance
• Inclusion in PubMed, CAS, Scopus and Google Scholar
• Research which is freely available for redistribution