Comparative Genomics via Wavelet Analysis
for Closely Related Bacteria
Jiuzhou Song
Department of Biochemistry and Molecular Biology, Faculty of Medicine, University of Calgary, 3330 Hospital Drive NW, Calgary, Alberta, Canada T2N 4N1
Email:[email protected]
Tony Ware
Department of Biochemistry and Molecular Biology, Faculty of Medicine, University of Calgary, 3330 Hospital Drive NW, Calgary, Alberta, Canada T2N 4N1
Email:[email protected]
Shu-Lin Liu
Department of Biochemistry and Molecular Biology, Faculty of Medicine, University of Calgary, 3330 Hospital Drive NW, Calgary, Alberta, Canada T2N 4N1
Email:[email protected]
M. Surette
Department of Biochemistry and Molecular Biology, Faculty of Medicine, University of Calgary, 3330 Hospital Drive NW, Calgary, Alberta, Canada T2N 4N1
Email:[email protected]
Received 26 February 2003; Revised 11 September 2003
Comparative genomics has been a valuable method for extracting and extrapolating genome information among closely related
bacteria. The efficiency of the traditional methods is extremely influenced by the software method used. To overcome the problem
here, we propose using wavelet analysis to perform comparative genomics. First, global comparison using wavelet analysis gives
the difference at a quantitative level. Then local comparison using keto-excess or purine-excess plots shows precise positions of
inversions, translocations, and horizontally transferred DNA fragments. We firstly found that the level of energy spectra difference
is related to the similarity of bacteria strains; it could be a quantitative index to describe the similarities of genomes. The strategy
is described in detail by comparisons of closely related strains:S.typhiCT18,S.typhiTy2,S.typhimuriumLT2,H.pylori26695, and
H.pyloriJ99.
Keywords and phrases:comparative genomics, gene discovery, wavelet analysis, bacterial genome.
1. INTRODUCTION
Since the publication of the whole genomic sequence of Haemophilus influenzae[1], the draft genomes of more than 90 bacterial strains have been completely finished. A no-table outcome of these genome projects is that at least one third of the genes encoded in each genome have no known or predictable functions. The genome sequencing, while not providing the detailed minutiae of the complete sequences, allows comparisons between genomes to identify insertion, deletion, and transfers that are undoubtedly important in the different phenotype of strains. However, as the level of evo-lutionary conservation of microbial proteins is rather uni-form, a large portion of gene products from each of the sequenced genomes has homologs in distant genomes [2].
The large amount of data has already given rise to sev-eral studies on whole genome comparisons such as those between several closely related bacterial species [3,4]. One problem for this kind of research is that DNA and protein fragment comparisons are highly dependent on sequence alignment methods such as FASTA34, BLAST, CLUSTALW, STADEN, PHRED, and so forth. Since the efficiency of the methods is extremely influenced by the software methods used, sequence alignment is possible for short DNA and pro-tein sequence comparisons, the methods also need heavy use of time, energy, and resources. Here we propose a strat-egy for whole genome or large fragment sequence com-parisons. The comparative genomics method we propose is based on the whole genome. Firstly, we use wavelet trans-form analysis to make a global comparison of closely related strains, giving their similarities and differences at quantita-tive level and with statistical meaning. Then we use keto ex-cess or purine exex-cess, as proposed by Freeman [5], to visu-alize some local differences. These indices are not like GC skew and AT skew [6, 7, 8] which depend on the sliding window size; they can show the exact positions of rearrange-ments and the origin and terminus sites of DNA replication. We illustrate the strategy using several closely related species including S.Typhimurium LT2, S.Typhi CT18, S.TyphiTy2, H.pyloriJ99 andH.pylori26695 strains. These pairs of bacte-ria share a similar flask-like morphology and show serolog-ical cross-reaction, but they differ in several important fea-tures including differences in G + C content and genome size, different tissue specificity, and pathogenic effects for human.
To understand the similarity between DNA structure and function, it is necessary to compare DNA sequences, espe-cially for newly closely identified ones. Wavelet analysis has been applied to a large variety of biomedical signals; the method will provide a useful visual description of the in-herent structure underlying DNA sequence [9]. A wavelet is a waveform of effectively limited duration that has an aver-age value of zeros, and wavelet analysis is the breaking up of a signal into shifted and scaled versions of the original (or mother) wavelet [10]. It provides a multiscale representation of signals allowing efficient smoothing and/or extraction of basic components at different scales. So the wavelet analysis supplies a new way to compare whole genomes at quantita-tive levels. The main idea of wavelet analysis is to decom-pose a sequence profile into several groups of coefficients, each group containing information about features of the pro-file at a scale of sequence length. Coefficients at coarse scales capture gross and global features, whereas coefficients at fine scales contain the local details of the profile [11]. A wavelet variance is a decomposition of the variance of a signal; it re-places global variability with variability over scales and in-vestigates the effects of constraints acting at different time or space scales [9]. The similarity comparison via wavelet analysis expands the traditional sequence similarity concept, which takes into account only the local pairwise DNA or amino acid sequences and disregards the information con-tained in coarse spatial resolution. Also the wavelet analysis does not require the complex sequence alignment
process-ing for sequence [12]. In this study, we explore the possibil-ity of genome comparisons using wavelet transform analysis and keto-excess or purine-excess plots to perform compar-ative genomics, and introduce the idea of using the energy spectra difference as a quantitative index to describe the sim-ilarity of genomes. The strategy used in this paper not only provides the location oforiCandterCsites of DNA replica-tion, but also is a powerful tool for examining genome frag-ment insertion, inversion, translocation, reorganization, and revealing evolutionary history.
2. MATERIAL AND METHOD
The sequences of Salmonella typhi Ty2 [13], Helicobac-ter pylori J99 [14], and Helicobacter pylori 26695 [15] were obtained from the NCBI website; Salmonella ty-phimurium LT2 and Salmonella typhi CT18 were down-loaded from both ftp://ftp.ncbi.nih.gov/genomes/Bacteria/ Salmonella typhimurium LT2/and fromftp://ftp.sanger.ac. uk/pub/pathogens/st/, respectively.
For global comparisons of closely related bacteria, we firstly do not use sequence alignment to do the compari-son, but use wavelet analysis to compare the purine-excess curve or keto-excess curve [5] and get the genome difference at quantitative level. In transforming the sequence data into digital data, we just count the cumulative number of each of the DNA bases A, C, G, and T along the whole genome. The purine excess was defined as the sum of all purines (A and G) minus the sum of all pyrimidines (T and C) encountered in a walk along the sequence up to the point plotted and was determined by
wherenranges from 1 toN(Nis the chromosome length) andBA,iis 1 if there is an A in theith position, and 0
other-wise (the termsBT,i,BG,i, andBC,iare defined similarly). In
the same way, the keto excess was defined as the sum of all keto bases (G and T) minus that of the amino bases (A and C) and was determined by
KetoExcessn=
Here againnranges from 1 toN, whereNis the chromosome length, andBis the number of the particular base (A, C, G, or T) occurring at theith location (either 0 or 1 in each case). We can also define local versions of these vectors:
KTn=BT,i+BG,i−BA,i−BC,i, PTn=BA,i+BG,i−BT,i−BC,i.
(3)
tool for analyzing localized variations of power within a time series, with successful applications in signal and image pro-cessing, numerical analysis, and statistics. The wavelet analy-sis procedure is to adopt a wavelet prototype function called an analyzing wavelet or mother wavelet. Because the orig-inal function can be represented in terms of a wavelet ex-pansion (using coefficients in a linear combination of the wavelet function), data operations can be performed using corresponding wavelet coefficients. We employ the continu-ous real wavelet transform [17]. Our analyzing wavelet is the normalized first derivative of a Gaussian function:
Φ(t)= t
whereσ is a scaling factor. The real wavelet transform of a function f is
In order to apply this transform to a vector x of lengthN
(such as the vectors KT or PT defined above), x is taken to correspond to samples at the points t0 = 0, t1 = 1/N, t = 2/N,. . .,tN = 1−1/N of a 1-periodic functionx(t).
The wavelet transformWx, for each scalesin a given range, is then just a convolution of two vectors that can be calcu-lated in the Fourier domain using the fast Fourier transform. Explicitly, we have
all valuesnfor which the terms in the sum are not negligi-ble. The result is a two-dimensional array of values of Wx
at positionst(ranging from 0 to 1) and scaless(a magni-fication parameter). One can think of this as a collection of one-dimensional transforms of the original signal at diff er-ent scales.
Methods based on wavelet transforms generally require powerful visualization tools. In implementation, we figure out the purine excess and keto excess using Perl and C++ codes, perform wavelet transformation analysis via Matlab, and make graphics using the xmgrace graphic software on MACI-cluster parallel computers.
3. RESULTS AND ANALYSIS
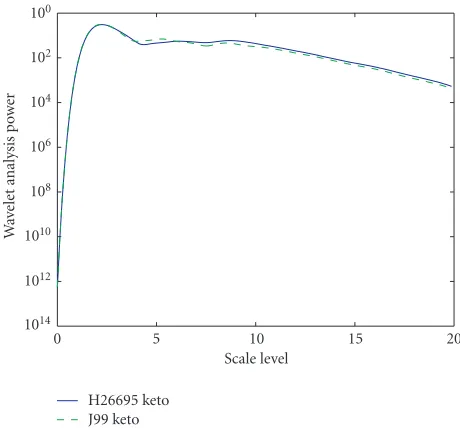
3.1. Global comparison of the closely related strains To investigate the relationship between closely related strains and determine their similarity, we use wavelet analysis to show the global spectrum of the two closely related strains. If the spectra are completely identical, they are the same strains, otherwise, we divide them to different strains. This identification, which is different from clone morphologi-cal index and physiology and biochemistry characteristics, is based on whole genome comparison. The global wavelet
100
Figure1: Comparison of the purine-excess wavelet analysis spectra inS.typhiCT18 andS.typhimuriumLT2.
spectra of the purine excess for three pairs ofS.typhiCT18 andS.typhimuriumLT2,S.typhiCT18 andS.typhiTy2, and H.pylori 26695 andH.pyloriJ99 are shown in Figures1,2, and3. The power in the wavelet transform is computed for a range of scales and plotted as a function of scale level σ, where the scale iss = 2−σ. The higher the scale number is,
100
102
104
106
108
1010
1012
1014
Wa
ve
le
t
an
al
ys
is
p
o
w
er
0 5 10 15 20 25
Scale level
Ty2 purine CT18 purine
Figure2: Comparison of the purine-excess wavelet analysis spectra inS.typhiCT18 andS.typhiTy2.
compared closely related strains. Here, we can see that the variability can be observed in the cumulative signal plots for the two strains; the variability is a definite indicative of com-ponent differences in the DNA sequences. From the compar-isons of the energy spectra among the strains, we can infer that theS.typhiCT18, compared toS.typhimuriumLT2, has closer relationship with and bigger similarity toS.typhiTy2. The strainH.pylori26695 andH.pyloriJ99 have the biggest difference variability in these three compared strains.
3.2. Local comparison of the closely related strains After comparison via wavelet transformation analysis, we have measured the global difference at a quantitative level. Now we analyze the local differences using the visualized keto-excess or purine-excess plot which explores the main information variation given by the wavelet analysis. In com-parative genomics, as shown inFigure 4, the figure clearly shows the positions of terC sites and oriC sites for both strains. Most parts of the keto-excess curves overlap be-tweenS.typhimuriumLT2 andS.typhiCT18, but there is an extra part around the terC site in S.typhimurium LT2. Af-ter partitioning in detail the fragment, the extra fragments in S.typhimurium LT2, the fragments A, B, C, D, E, and F in a length range from 1483934 to 1870353 bp as shown inFigure 5a, are rearranged or incompletely translocated to S.typhiCT18 which are also located around the terC site; the fragments are completely reversed at the length range from 1235888 to 1643129 bp and the order of fragments is reversed from fragments F to fragment A, as shownFigure 5b. The re-arrangements of DNA fragments suggest that the inversions and translocations took place in the strainS.typhiCT18 se-quences, thus disrupting the original arrangement of these
100
102
104
106
108
1010
1012
1014
Wa
ve
le
t
an
al
ys
is
p
o
w
er
0 5 10 15 20
Scale level
H26695 keto J99 keto
Figure3: Comparison of the keto-excess wavelet analysis spectra in
H.pylori26695 andH.pyloriJ99.
fragments. As a result, the keto excess plot in theS.typhiCT18 is a little bit different from that ofS.typhimuriumLT2. As for the transferred or relocated genes, the most inverted frag-ments inS.typhiCT18 involve genes inS.typhimuriumLT2 which contain cell processes: macromolecule metabolism, cell envelope, energy metabolism, such as secretion sys-tem effectors and apparatus [ssa(A–U) and yscR gene], cy-toplasmic protein, inner membrane protein, family trans-port protein, oxidoreductase, periplasmic protein, peptide transport protein, transcriptional regulator or repression, fumarate hydratase, and tyrosine tRNA synthetase. The translocation genes in CT18 include transcriptional regula-tor, ATPase and phosphatase, ABC superfamily oligopeptide transport protein, peptide transport protein, anthranilate synthase, cardiolipin synthase, energy transducer, formyl-tetrahydrofolate hydrolase, GTP cyclohydrolase, nitrate re-ductase, phage shock protein, tryptophan synthase, and so forth.
40000
20000
0
−20000
Ke
to
ex
ce
ss
0 1e+ 06 2e+ 06 3e+ 06 4e+ 06 5e+ 06 Genome length (1e+ 06=1 000 000 bp)
S.typhimurumLT2
S.typhiCT18 Translocations
terC terC
oriC oriC
Insertions
Figure 4: Comparative genomics between S.typhi CT18 and
S.typhimurium LT2. The black line is keto-excess plot in
S.typhimuriumLT2 and the red one is keto-excess plot inS.typhi
CT18. The maximum value and minimum value in each curve are corresponding to the positions of terC site and oriC site
of DNA replications, respectively. Compared with S.typhiCT18,
S.typhimuriumLT2 has an extra part around terC site;S.typhiCT18 has a triangle insertion around 4.45 mb.
tail protein, phage tail fiber protein, phage base plate assem-bly protein, lysozyme, membrane protein, and other pro-teins. The remaining genes within this insertion in S.typhi CT18 have not yet been identified.
The numbers and types of paralogs were very different betweenS.typhiCT18 andS.typhimuriumLT2; those diff er-ences also contribute to the local differences of the wavelet transformation spectra and the keto excess-plots in the two strains. In S.typhimurium LT2, most of paralogs are two copies of cytochrome c-type biogenesis protein genes (ccmA-H), citrate lyase synthetase (citC-citG), and five copies of transposase (tnpA). In contrast, in S.typhiCT18, there are twenty-six copies of transposase (tnpA); the two copies of paralogs are oxaloacetate decarboxylase (oadA, oadB, oadG, and oadX), cytochrome c-type biogenesis protein (ccmA-H), and citrate lyase synthetase (citA-G, X, and T).
TheSalmonella enterica serovar typhiis a human-specific pathogen causing enteric typhoid fever, a severe infection of the reiculoendothelial system. TheS.typhiCT18 andS.typhi Ty2 are two well-studied pathogenic strains, by the compar-ison via wavelet spectra they have very little difference and are very close; this statement confirms most of researcher’s inference. The information from comparative genomics and genes in S.typhi will help us to reveal more specific drug candidates and vaccines.Figure 6only shows the fragments with larger than 12,000 bp. From Figure 6, the S.typhiTy2 genome is distinguished from that ofS.typhiCT18 by inter-replichore inversion and translocations. The figure indicates that the inverted DNA fragments are the main reason for the
40000
20000
0
−20000
Ke
to
ex
ce
ss
0 1e+ 06 2e+ 06 3e+ 06 4e+ 06 5e+ 06 Genome length (1e+ 06=1 000 000 bp)
A B C D
E F G H
(a)
40000
30000
20000
10000
0
−10000
−20000
Ke
to
ex
ce
ss
0 1e+ 06 2e+ 06 3e+ 06 4e+ 06 5e+ 06 Genome length (1e+ 06=1 000 000 bp)
A B C D
E F G H
(b)
Figure5: Identification of translocated and inserted fragments in
S.typhiCT18 andS.typhimuriumLT2. The fragments A, B, C, C, D,
E, and F inS.typhimuriumLT2 are reversed and translocated into
S.typhiCT18; the order of fragments becomes F, E, D, C, B, A. The
partial insertions in S.typhiCT18, fragments G and H, are
hori-zontal transferred fragments fromS.typhimuriumLT2; the fragment
length of G and H is around 35 KB.
40000
Figure6: Identification of translocated and inserted fragments in
S.typhiCT18(A) andS.typhiTy2(B). The 14 biggest fragments A, B,
C, . . . , O inS.typhiTy2 are reversed and translocated intoS.typhi
CT18; the order of fragments becomes O, N, M, . . . , A. The partial
insertions inS.typhiCT18 are horizontal transferred fragments into
S.typhiTy2; the fragment length of G and H is around 35 KB.
They have the same positions of oriC and terC site and phys-ical balance features, and share a 35 kb inversions around
4.5 mb. The sequence in the inversion fragment in the two strains is the same as in the fragments G and H of the LT2. We also got a lot of pseudogenes; we think that the inverted and translocated fragments are the main reason of making the pseudogenes in the two strains. The message helps to reveal the pseudogene mechanisms and potentially contributions to pathogenicity; the detail description is beyond the scope of the paper.
Comparative genomics using purine-excess plots was also used to compareH.pyloristrains J99 andH.pyloristrains 26695. The size of the inversed and translocated fragments is much smaller than that ofS.typhiCT18,S.typhiTy2, and S.typhimuriumLT2, the only fragments larger than 1000 bp are shown in Figure 7. From Figures 7a and 7b, the two strains could clearly show terC sites on the purine curves. We found that the dnaA gene is near the global minimum site, so we refer to the oriC site located on these regions. There are a lot of rearrangements, horizontal transfers, translocations, and reversions amongH.pylori J99 andH.pylori26695; the inversions and horizontally transformed DNA fragments are clearly seen to result in mirror symmetry transformations. In contrast to previous genomics comparison between the two strains, using window-sized GC skew [18], the purine-excess plots give us precise positions of inversion, translo-cations, and horizontal transformed DNA fragments. Inter-estingly, the shape and composition of cag pathogenicity is-land (cagPAI) are pretty similar. The inversion and transloca-tion events do not happen in this region; this implies that the zone is not a result of differential retention of ancestral DNA in these strains but is a product of horizontal transfer; this region might represent pathogenicity islands [14]. We also found that one of the reasons which formed the jagged dia-gram ofH.pyloriis thatH.pylori26695 has some unique pro-logs (products of gene duplications). These propro-logs are acyl carrier protein (acpP), biopolymer transport protein (exbB and exbD), iron dicitrate transport protein (fecA), and trans-poses (tnpA and tnpB).
4. DISCUSSION
Here we have described a wavelet analysis strategy to reveal the whole genome difference between closely related bacte-rial strains. Compared with the widely used GC skew and AT skew, the purine excess and the keto excess are visualiza-tion tools to show whole genome informavisualiza-tion; they do not involve any default window size or the loss of any informa-tion. Via analyzing the excesses, the wavelet method enables global comparison at a quantitative level, and the keto-excess or purine-excess plot shows the local difference. Through our research, the wavelet energy spectra difference can give a quantitative measure of strain difference. It is an important value for closely related strain, especially for the similar clone morphology and serological cross reaction putative strains. It could be a quantitative index to ascertain the similarity and relationship among strains.
20000
Figure7: Identification of translocated and inserted fragments in
H.pylori, Strain J99 andH.pylori, Strain 26695. The fragments A, B,
C, D, E and F inH.pylori StrainJ99 are reversed and translocated
intoH.pylori StrainH26695.
between closely related strains or species, there is more about comparative genomic analysis other than merely identify-ing the presence or absence of specific fragments or genes. It is important to know whether these genes are
capa-ble of being translated into functional proteins. Very small changes such as insertion, deletion, mutation, transloca-tions, and so forth in genomic sequence can have a dispro-portionate effects on the phenotype of an organism. Such changes could lead to frameshifts or base pair replacement leading to the introduction of stop codons, and may re-move the activity of the encoded protein when the gene sequence is still present in the genome. In addition, these changes may produce pseudogenes. Since the changes are not random, the pseudogenes may be over-presented in cer-tain functional classes such as pathogenicity island and cell-associated genes. For example, S.typhiCT18 and Ty2 con-tain inactivated genes which are involved in virulence and host range. ForS. typhimurium, several genes that have been shown to be important for phenotypes in S. typhimurium appear to be inactive in S.typhi [19]. Therefore, further studies ofS.typhiare likely to reveal rearrangements, inser-tions, translocainser-tions, and horizontal transfers correspond-ing to different tissue specificity and pathogenic effects for human and other organisms. Potentially the alteration of transcription and translation between related strains needs to be checked and confirmed by wet-bench genetic analy-sis. We think that although comparative genomics can pro-vide very large amount of information on variations in each genome, it is still only an initial step in understanding the biology of an organism. Analysis of the complete genome se-quence is only the start of the biological journey. The C++ and Matlab scripts for wavelet analysis and cumulative di-agrams (Keto and purine excesses) are available on request from authors.
ACKNOWLEDGMENTS
The authors would like to thank the anonymous referees and also Prof. C. Sensen for his comments on earlier versions of this paper. They would also like to thank Dr. Doug Phillips for his computer support.
REFERENCES
[1] R. D. Fleischmann, M. D. Adams, O. White, et al., “Whole-genome random sequencing and assembly of Haemophilus
influenzae Rd.,”Science, vol. 269, no. 5223, pp. 496–512, 1995.
[2] E. V. Koonin and M. Y. Galperin, “Prokaryotic genomes: the
emerging paradigm of genome-based microbiology,”Current
Opinion in Genetics & Development, vol. 7, no. 6, pp. 757–763, 1997.
[3] R. Himmelreich, H. Plagens, H. Hilbert, B. Reiner, and R. Herrmann, “Comparative analysis of the genomes of the bacteria Mycoplasma pneumoniae and Mycoplasma
genital-ium,”Nucleic Acids Research, vol. 25, no. 4, pp. 701–712, 1997.
[4] M. McClelland, L. Florea, K. Sanderson, et al., “Comparison of the Escherichia coli K-12 genome with sampled genomes of a Klebsiella pneumoniae and three salmonella enterica
serovars, Typhimurium, Typhi and Paratyphi,” Nucleic Acids
Research, vol. 28, no. 24, pp. 4974–4986, 2000.
[5] J. M. Freeman, T. N. Plasterer, T. F. Smith, and S. C. Mohr,
“Patterns of genome organization in bacteria,” Science, vol.
[6] J. R. Lobry, “Asymmetric substitution patterns in the two
DNA strands of bacteria,” Molecular Biology and Evolution,
vol. 13, no. 5, pp. 660–665, 1996.
[7] A. Grigoriev, “Analyzing genomes with cumulative skew
dia-grams,”Nucleic Acids Research, vol. 26, no. 10, pp. 2286–2290,
1998.
[8] A. Grigoriev, “Strand-specific compositional asymmetries in
double-stranded DNA viruses,”Virus Research, vol. 60, no. 1,
pp. 1–19, 1999.
[9] P. Lio, “Wavelets in bioinformatics and computational
biol-ogy: state of art and perspectives,”Bioinformatics, vol. 19, no.
1, pp. 2–9, 2003.
[10] A. Arneodo, B. Audit, E. Bacry, S. Manneville, J.-F. Muzy, and S. G. Roux, “Thermodynamics of fractal signals based on wavelet analysis: application to fully developed turbulence
data and DNA sequences,” Physica A, vol. 254, no. 1-2, pp.
24–45, 1998.
[11] J. Song, A. Ware, and S.-L. Liu, “Wavelet to predict bacterial
ori and ter: a tendency towards a physical balance,”BMC
Ge-nomics, vol. 4, no. 1, pp. 17, 2003.
[12] X.-Y. Zhang, Y.-T. Zhang, S. C. Agner, et al., “Signal
process-ing techniques in genomic engineerprocess-ing,” Proceedings of the
IEEE, vol. 90, no. 12, pp. 1822–1833, 2002.
[13] W. Deng, S.-R. Liou, G. Plunkett III, et al., “Comparative ge-nomics of Salmonella enterica serovar Typhi strains Ty2 and
CT18,”Journal of Bacteriology, vol. 185, no. 7, pp. 2330–2337,
2003.
[14] R. A. Alm, L. S. Ling, D. T. Moir, et al., “Genomic-sequence comparison of two unrelated isolates of the human gastric
pathogen Helicobacter pylori,”Nature, vol. 397, no. 6715, pp.
176–180, 1999.
[15] J.-F. Tomb, O. White, A. R. Kerlavage, et al., “The complete genome sequence of the gastric pathogen Helicobacter
py-lori,”Nature, vol. 388, no. 6642, pp. 539–547, 1997.
[16] A. S. Wunenburger, A. Colin, J. Leng, A. Arneodo, and D. Roux, “Oscillating viscosity in a lyotropic lamellar phase
under shear flow,” Phys. Rev. Lett., vol. 86, no. 7, pp. 1374–
1377, 2001.
[17] S. G. Mallat, A Wavelet Tour of Signal Processing, Academic
Press, London, UK, 1999.
[18] J. A. Abildskov, “Additions to the wavelet hypothesis of cardiac
fibrillation,” Journal of Cardiovascular Electrophysiology, vol.
5, no. 7, pp. 553–559, 1994.
[19] J. Parkhill, G. Dougan, K. D. James, et al., “Complete genome sequence of a multiple drug resistant Salmonella enterica
serovar Typhi CT18,”Nature, vol. 413, no. 6858, pp. 848–852,
2001.
Jiuzhou Songreceived his Ph.D. degree in statistical genetics from China Agricultural University in 1996. From 1996 till 1998, he held a postdoctoral fellowship in genet-ics at Hebrew University, and from 1998 till 2000, he was a Research Fellow in bio-chemistry and molecular biology at the In-diana University. Now he is a Research As-sociate in the Departments of Microbiology & Infectious Disease, and Biochemistry &
Molecular Biology, Faculty of Medicine, University of Calgary. His main work is on bioinformatics and statistics, especially on high throughput gene expression data analysis, comparative genomics, biopathway and gene discovery, gene network, regulatory analysis, phylogenetic domain analysis, and computational biology.
Tony Ware received his Ph.D. degree in numerical analysis from Oxford University in 1991, having five years earlier obtained an honours degree in mathematics (First Class). From 1991 till 1993, he held a re-search fellowship in Oxford, and from 1993 till 1997, he was a Lecturer in applied math-ematics at the University of Durham, UK. From 1997 till 1998, he received a research fellowship from the Department of
Clini-cal Neurosciences at the University of Calgary. Since 2000, he has been an Assistant Professor in the Department of Mathematics and Statistics at the same university.
Shu-Lin Liureceived his Ph.D. degree from Gifu University in 1990. He is an Adjunct Assistant Professor in the Department of Microbiology & Infectious Diseases, Faculty of Medicine, Univer-sity of Calgary, Canada. His research focuses on bacterial evolution and speciation and is currently supported by grants from the Cana-dian Institutes of Health Research (CIHR) and Natural Science and Engineering Research Council of Canada.
M. Surette has been a Canada Research Chair in Microbial Gene Expression and an Alberta Heritage Foundation for Medi-cal Research Senior Scholar since 2002. He is an Associate Professor in the Depart-ments of Microbiology & Infectious Dis-ease, and Biochemistry & Molecular Biol-ogy, Faculty of Medicine, University of Cal-gary, Canada. He has received Young Inves-tigator Awards from Bio-Mega/Boehringer