Source model for strong ground motion generation in the frequency range
0.1–10 Hz during the 2011 Tohoku earthquake
Kimiyuki Asano and Tomotaka Iwata
Disaster Prevention Research Institute, Kyoto University, Gokasho, Uji, Kyoto 611-0011, Japan
(Received December 28, 2011; Revised April 20, 2012; Accepted May 5, 2012; Online published January 28, 2013)
The source model of the 2011 Tohoku earthquake, which is composed of four strong motion generation areas (SMGAs), is estimated based on the broadband strong ground motion simulations in the frequency range 0.1–10 Hz using the empirical Green’s function method. Two strong motion generation areas are identified in the Miyagi-oki region west of the hypocenter. Another two strong motion generation areas are located in the Fukushima-Miyagi-oki region southwest of the hypocenter. The strong ground motions in the frequency range 0.1–10 Hz along the Pacific coast are mainly controlled by these SMGAs. All the strong motion generation areas exist in the deeper portion of the source fault plane. The stress drops of the four SMGAs range from 6.6 to 27.8 MPa, which are similar to estimations for pastM7-class events occurring in this region. Compared with the slip models and aftershock distributions of past interplate earthquakes in the Miyagi-oki and Fukushima-oki regions since the 1930s, the SMGAs of the 2011 Tohoku earthquake spatially correspond to the asperities ofM7-class events in 1930s. In terms of broadband strong ground motions, the 2011 Tohoku earthquake is not only a tsunamigenic event with a huge coseismic slip near the trench but is also a complex event simultaneously rupturing pre-existing asperities.
Key words:2011 Tohoku earthquake, source model, strong motion generation area, empirical Green’s function method, broadband strong ground motion simulation, asperity.
1.
Introduction
The 2011 Tohoku earthquake, which occurred at 14:46
on March 11, 2011 (JST = UTC + 9), rocked over
the Japanese country. The hypocenter determined by the Japan Meteorological Agency (JMA) was 38.1035◦N, 142.8610◦E at a depth of 23.74 km beneath the Pacific Ocean off the eastern coast of northeastern Japan. Many earlier studies have reported that its moment magnitude was 9.0 (e.g., Hayes, 2011; Nettleset al., 2011) and it was the largest event to have occurred in Japan since instrumen-tal observation started in the late 19th century. This event is characterized as a mega-thrust earthquake rupturing the plate boundary between the North American Plate and the subducting Pacific Plate. An enormous tsunami swept the Pacific coast of Tohoku and Kanto districts, northeastern Japan. A seismic intensity of 7 on the JMA intensity scale was observed at Tsukidate, Kurihara city, 175 km west of the epicenter, and a seismic intensity of 6+was widely ob-served in the Tohoku and Kanto districts (Hoshiba et al., 2011). The nationwide digital strong motion seismograph networks, K-NET and KiK-net, both installed and oper-ated by the National Research Institute for Earth Science and Disaster Prevention (NIED), Japan (Aoiet al., 2011), recorded the ground acceleration time histories at more than one thousand stations across Japan (Kunugiet al., 2012).
Copyright cThe Society of Geomagnetism and Earth, Planetary and Space Sci-ences (SGEPSS); The Seismological Society of Japan; The Volcanological Society of Japan; The Geodetic Society of Japan; The Japanese Society for Planetary Sci-ences; TERRAPUB.
doi:10.5047/eps.2012.05.003
The kinematic heterogeneous slip histories on the source fault of this megathrust event were estimated in space and in time by inversion analyses of teleseismic data (e.g., Ammon
et al., 2011; Hayes, 2011; Ide et al., 2011; Shao et al., 2011; Yagi and Fukahata, 2011), strong motion data (e.g., Suzukiet al., 2011; Yoshidaet al., 2011a), both teleseis-mic and strong motion data (e.g., Yoshidaet al., 2011b), and combined datasets of teleseismic, strong motion, and geodetic data (e.g., Koketsuet al., 2011). However, those studies used the seismic waves at strong motion stations in the frequency range lower than 0.1 or 0.125 Hz. It is not easy for those source models, which are constrained by the lower frequency data, to reproduce the observed broadband ground motions. In order to account for the observed strong ground motions of frequencies higher than 0.1 Hz, which are usually related to seismic damages on building and civil structures, constraints on the source process by higher fre-quency data are indispensable. It is useful for such an anal-ysis to use the records of small events occurring close to the target event as empirical Green’s functions.
The use of empirical Green’s functions was originated by Hartzell (1978). Irikura (1986) developed a systematic methodology to simulate strong ground motions in a broad-band frequency range based on the self-similar scaling law of fault parameters between large and small events and the
ω−2 source spectral model. The waveform for the target event is simulated by summing up the observed waveform of a smaller event convolved with a filtering function or cor-rection function, which corrects the difference in the slip velocity time function between the large and small events.
Characterized source patch models give successful simula-tions using the empirical Green’s function method. Miyake
et al.(2003) named this source patch the strong motion gen-eration area (SMGA), and this is defined as the area char-acterized by a large uniform slip velocity within the total rupture area, which reproduces near-source strong ground motions up to about 10 Hz. The source process is rep-resented by a source model which is composed of one or more SMGAs. For inland crustal earthquakes, Miyakeet al. (2003) concluded that the SMGAs coincided with the large slip areas or the asperities of heterogeneous slip dis-tributions derived from low-frequency (<1 Hz) waveform inversions, and they concluded that the near-source strong ground motions were controlled mainly by the size of the SMGA and the rise time there.
The strong motion generation area and the empirical Green’s function method has been successfully applied to strong motion simulations of past subduction-zone in-terplate earthquakes (e.g., Kamae and Kawabe, 2004; Miyahara and Sasatani, 2004; Suzuki and Iwata, 2007; Takiguchiet al., 2011). Suzuki and Iwata (2007) analyzed the 2005 Miyagi-oki earthquake (MJMA7.2) which occurred west of the epicenter of the 2011 Tohoku earthquake, and they confirmed that two SMGAs of the 2005 Miyagi-oki earthquake existed inside the asperities where relatively large slip was observed from the kinematic waveform in-versions, but that the area size of these was significantly smaller than the asperity area. Takiguchiet al.(2011) mod-eled the SMGAs of two interplate events off Ibaraki on July 23, 1982, and May 8, 2008, which had occurred adjacent to the source area of the 2011 Tohoku earthquake. They concluded that the SMGAs of the 1982 and 2008 events were located close to each other but possibly did not over-lap. The investigation on the repeatability of asperities and strong motion generation areas is one of the key issues for subduction-zone interplate earthquakes.
In this paper, we estimate a source model composed of SMGAs by analyzing the strong ground motion records observed at K-NET and KiK-net strong motion stations. We consider the three-dimensional geometry of the plate interface for locating SMGAs. The spatial relationships between the SMGAs of the 2011 Tohoku earthquake and the source regions of past interplate events in this subduction zone are discussed.
2.
Data
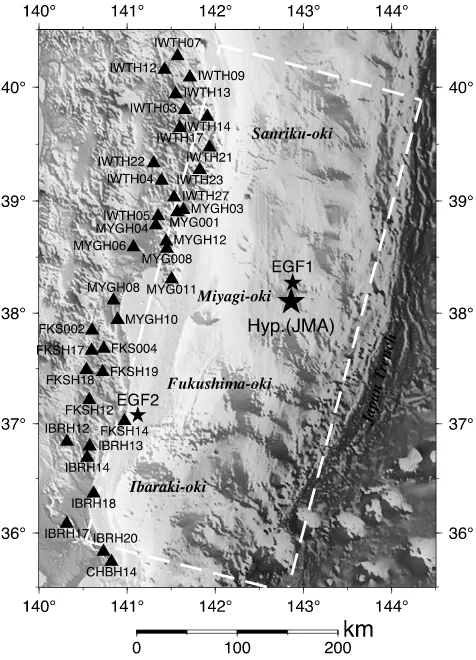
The strong motion records of K-NET and KiK-net are used. Figure 1 shows the spatial distribution of the strong motion stations used in this study. The downhole records of KiK-net stations installed in the basement rock are mostly used to avoid the soil nonlinearity effects of superficial lay-ers during strong ground motions. Some of the K-NET sur-face stations located at stiff soil and rock sites are addition-ally used.
3.
Locating the Rupture Starting Points of
SM-GAs on the Plate Interface
Figure 2 shows the record section of the north-south com-ponents of observed original acceleration waveforms ac-cording to the station’s latitude. Four distinctive wave
pack-Fig. 1. The map showing the studied area. The large and small solid stars represent epicenters of the 2011 Tohoku earthquake (Mw9.0) and
two EGF events by JMA, respectively. Solid triangles indicate the strong motion stations whose observed ground motions are plotted in the record section in Fig. 2. The broken rectangle indicates the source fault plane of the 2011 Tohoku earthquake (from Suzukiet al., 2011).
ets propagating northward and southward are clearly seen in the record section. The first (S1) and second (S2) wave packets arrive first at MYG011 just 121 km west of the epi-center, which is the nearest station from the epicenter of the mainshock. S1 and S2 are separated by approximately 40 s. The third wave packet (S3) propagates from off Fukushima prefecture, and the fourth wave packet (S4) propagates from the neighborhood of the boundary between the Fukushima and Ibaraki prefectures. Those observed characteristics of strong ground motions give a brief image of the source pro-cess related to the high-frequency seismic wave generation during the 2011 Tohoku earthquake.
Fig. 2. Record section of the NS component of acceleration waveforms according to latitude. The acceleration waveforms are normalized by its maximum amplitude. Arrows indicate four distinctive wave packets observed in the ground motions (S1–S4).
In order to determine the location of the rupture starting point and rupture time for each SMGA objectively, we read the onset of S1–S4 at stations along the source region. The
S-wave onset data at 10 to 25 stations are used for each SMGA. The stations are selected from Fig. 2 to give bet-ter azimuthal coverage as possible. The most distant sta-tions are not used because it was difficult to read the on-set precisely at those stations. The optimum parameters are obtained from the travel time data. The one-dimensional velocity structure model in Table 1 is used to calculate the
S-wave travel time. This velocity structure model is ap-proximated from the regional integrated velocity structure model by Koketsuet al.(2008), which was constructed for the long-period ground motion prediction from the antici-pated Miyagi-oki earthquake.
The difference between the observed and theoretical travel times is corrected by using an Mw6.0 foreshock (EGF1 in Fig. 1 and Table 2) as a reference event. The location of the reference event was fixed at the hypocen-ter dehypocen-termined by JMA. The optimal location and rupture time of the individual SMGA are determined minimizing the RMS calculated from the following equation by a grid
Table 1. S-wave velocity structure model for calculating theoretical travel time and the ray path.
Depth (km) S-wave velocity (km/s)
0 3.20
6 3.42
15 3.82
28 4.46
∗This velocity structure model is approximated from the regional velocity structure model of Koketsuet al.(2008).
search,
RMS=
1
n
n
i=1
t0+
ti
cal− ˆt i cal
−ti
obs− ˆt i obs
2. (1)
Here, ti
cal and t
i
obs are the calculated and observed travel times of the SMGA at the i-th station, respectively. tˆi
cal andtˆi
Table 2. The hypocentral information of events used as the empirical Green’s functions (EGF).
EGF1 EGF2
Origin time (JST)∗ 2011/3/10 03:16 2005/10/22 22:12
Latitude (◦N)∗ 38.2712 37.0797
Longitude (◦E)∗ 142.8788 141.1205
Depth (km)∗ 28.87 51.96
MJMA∗ 6.4 5.6
Strike/Dip/Rake (◦)∗∗ 191/20/78 209/28/96 Seismic moment (N m)∗∗ 1.41×10¹⁸ 2.32×10¹⁷
Mw∗∗ 6.0 5.5
∗The origin time, location, and JMA magnitudeMJMAare determined by JMA. ∗∗The focal mechanism and seismic moment refer to the Global CMT catalog.
Table 3. The location of the rupture starting point and the rupture time relative to the origin time for each SMGA. Rupture starting point Rupture time (s) Latitude (◦N) Longitude (◦E) Depth (km)
SMGA1 38.075 142.070 36.8 24.1
SMGA2 38.075 142.555 28.0 65.4
SMGA3 37.060 141.655 37.1 106.5
SMGA4 36.995 141.000 53.8 133.0
search are 0.005◦ for latitude and longitude and 0.1 s for rupture time, respectively.
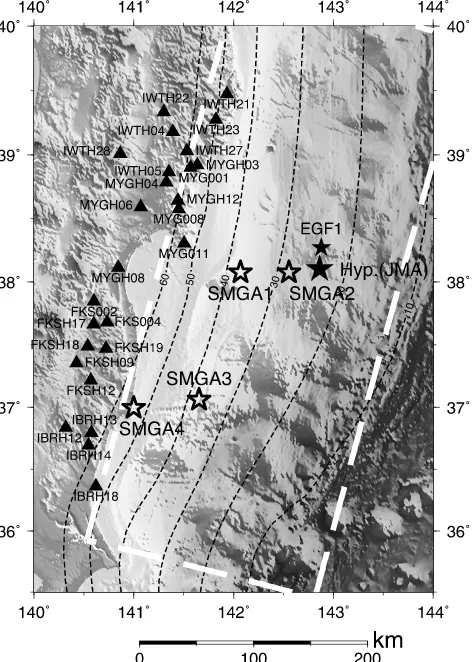
Figure 3 shows the estimated rupture starting points of four SMGAs on the map. The rupture delay times from the origin time are 24.1 s, 65.4 s, 106.5 s, and 133.0 s, respec-tively. The coordinates of the rupture starting points and their rupture times are listed in Table 3. Figure 4 shows the error distribution in space. The locations of these rupture starting points of SMGAs are well determined by the data. This figure implies that the spatial uncertainty in the dip di-rection is relatively larger than that in the strike didi-rection because of the nonuniform station distribution surrounding the source region.
4.
Construction of SMGA Source Model through
Strong Motion Simulations in the Frequency
Range 0.1–10 Hz
4.1 Brief introduction of the empirical Green’s func-tion method
The synthetic ground motion for the target eventU(t)is synthesized by summing the records of small eventsu(t) with a filtering function F(t), which corrects the differ-ence in the slip velocity time function between the large and small events following the source scaling laws (Irikura, 1986; Irikuraet al., 1997; Miyakeet al., 2003),
U(t)=
N
i=1 N
j=1
r ri j
{F(t)∗(C·u(t))}, (2)
whereN andCare the ratios of the source dimensions and the stress drops between the large and small events, respec-tively. N must be an integer. The asterisk denotes convo-lution in the time domain. r is the hypocentral distance of the small event. ri j is the distance from the subfault(i,j) to the station. This method assumes that the source fault of the EGF event is finite.
Fig. 3. Map showing the locations of the rupture starting points of SMGAs (open stars). The large and small solid stars indicate the epicenters of the mainshock and reference event (EGF1) both determined by JMA, respectively. Solid triangles indicate the strong motion stations used for locating SMGAs. The broken contour lines represent the depth of the plate interface by Nakajima and Hasegawa (2006) and Nakajimaet al.
Fig. 4. Distributions of RMS residuals estimated by the grid search method for locating the rupture starting points of SMGAs. The contour interval is 1 s. The cross indicates the minimum value.
The filtering functionF(t)is
F(t)=δt−ti j
+ 1
n1−e−1
·(
N−1)n
k=1
e−(Nk−1)−1nδ
t−ti j−
(k−1)τ
(N−1)n
,
(3)
ti j=
ri j−r0
VS
+ξi j
Vr
. (4)
τ is the rise time for the large event. n is an appropriate integer to weaken artificial periodicity. r0 is the hypocen-tral distance of the large event. ξi j is the distance between the subfault (i,j) and the rupture starting point. VS and
Vr are the S-wave velocity in the source area and the rup-ture propagation velocity, respectively. Asano and Iwata (2010) modified these formulations to consider the one-dimensional velocity structure model. Equations (2) and (4) are modified as
U(t)=
N
i=1 N
j=1
R Ri j{
F(t)∗(C·u(t))}, (5)
and
ti j=Ti j−T0+
ξi j
Vr.
(6)
Ris the distance along the ray path of the small event. Ri j is the distance along the ray path of the S-wave from the subfault(i,j)to the station. Ti j andT0are the travel times of theS-wave from the subfault(i,j)and the rupture start-ing point to the station, respectively. The theoretical travel time and ray path are calculated from the one-dimensional velocity structure model of Table 1.
The scaling parameters N and C satisfy the following relationships (Irikura, 1986),
U0
u0
= M0
m0
=C N3, (7)
and
A0
a0 =
C N. (8)
U0andu0 indicate the constant levels of amplitude of the displacement source spectra for the large and small events, respectively. M0 andm0 are the seismic moments of the large and small events, respectively. A0anda0indicate the constant levels of amplitude of the acceleration source spec-tra for the large and small events, respectively. The ground motion from a source model composed of multiple SMGAs can be obtained by the superposition of synthetic ground motions generated from each SMGA with time shift.
4.2 Source spectral ratios
The scaling parameters N and C are determined for each SMGA from the observed source spectral ratio by the source spectral fitting method (Miyakeet al., 1999, 2003). This method derives these parameters by fitting the ob-served source spectral ratio between the large and small events to the theoretical source spectral ratio following the
ω−2source spectral model. The moment ratio M
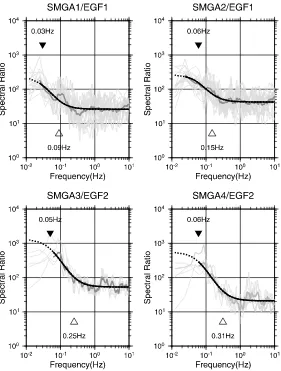
Fig. 5. Observed source spectral ratios for each strong motion station (thin gray lines), the average observed source spectral ratios among stations (thick gray line), and theoretical source spectral ratio (thick solid line) fitted to the observation for each SMGA. The solid inverse triangle and the open triangle indicate the corner frequencies for target and EGF events, respectively.
the corner frequency of the target and EGF events, are es-timated by a grid search algorithm. Firstly, the observed source amplitude spectral ratio of the S-wave portion of each SMGA is calculated for each station. In this analysis, only records in which individual wave packets correspond-ing to each SMGA are isolated sufficiently to have the time windows for calculating Fourier amplitude spectra are used. The propagation path effects are corrected for geometrical spreading of the body waves and an attenuation factor. The frequency-dependent quality factor,Q(f)= 110f0.69 ob-tained by Satohet al.(1997) in this region is used to correct the attenuation factor. TheS-wave velocity is assumed to be 4.46 km/s in this correction.
The records of anMw6.0 event, which occurred at 03:16 on March 10, 2011 (JST), is used as EGF for SMGA1 and SMGA2 (EGF1), and those of anMw5.5 event, which oc-curred at 22:12 on October 22, 2005 (JST), is used as EGF for SMGA3 and SMGA4 (EGF2). The epicenters of two EGF events are shown in Fig. 1. The hypocentral infor-mation of EGF events is summarized in Table 2. Figure 5 shows the observed source spectral ratio for each SMGA compared with the theoretical spectral ratio from a ω−2 source spectral model estimated by the grid search. The estimated corner frequencies for target and EGF events are
indicated with the plots of spectral ratios in Fig. 5. The corner frequencies of one EGF event estimated from the source spectral ratios of two SMGAs (e.g., SMGA1/EGF1 and SMGA2/EGF1) are nearly identical. Derivation of the scaling parametersNandCfrom the obtained moment ra-tios and corner frequencies is straightforward.Nare 3, 3, 5, and 5 for SMGA1, SMGA2, SMGA3, and SMGA4, respec-tively.Cvalues are estimated to be 10.6 and 4.0 for SMGA3 and SMGA4, respectively. Since theCvalues for SMGA1 and SMGA2 do not seem to be well constrained because of small N, theC values for these SMGAs are searched together with other unknown parameters in the following strong motion simulations.
4.3 Estimation of SMGA source model
The source parameters of the four SMGAs are then esti-mated based on broadband strong motion simulations using the empirical Green’s function method. The best set of pa-rameters is estimated by minimizing the following residual function through a grid search (Miyakeet al., 1999, 2003).
residual= Nst
m=1 Ncomp
l=1
⎡ ⎢ ⎢ ⎣
t
uobs(t)−usyn(t)
2
t
uobs(t)2
t
Table 4. Search range, grid interval, and estimated value of model parameters in the grid search.
l=w(km)∗ τ(s)∗ C NSL∗∗ NSW∗∗ Vr(km/s)∗
SMGA1 Search range 5.0–15.0 1.0–3.0 5.0–15.0 1–3 1–3 2.8–4.0
(EGF1) Interval 1.0 0.1 1.0 1 1 0.4
Estimated value 12.0 2.3 12.0 2 3 4.0
SMGA2 Search range 5.0–15.0 1–3 1–3
(EGF1) Interval 1.0 1 1
Estimated value 14.0 3 1
SMGA3 Search range 3.0–10.0 0.1–0.6 10.6 1–5 1–5 2.8–4.0
(EGF2) Interval 0.5 0.02 fixed 1 1 0.4
Estimated value 7.0 0.34 10.6 2 3 4.0
SMGA4 Search range 4.0 1–5 1–5
(EGF2) Interval fixed 1 1
Estimated value 4.0 1 3
∗l,w,τ, andV
rdenote the length, width, rise time, and rupture velocity of EGF1 and EGF2, respectively. ∗∗NSL and NSW indicate the rupture starting subfault within SMGA in the strike and dip directions.
Table 5. Estimated parameters of SMGAs.
N C Strike Dip L W S T M0 σ D
(◦) (◦) (km) (km) (km2) (s) (N m) (MPa) (m)
SMGA1 3 12.0 195 13 36 36 1296 6.90 4.57×10²⁰ 23.9 5.2
SMGA2 3 14.0 195 13 36 36 1296 6.90 5.33×10²⁰ 27.8 6.1
SMGA3 5 10.6 198 17 35 35 1225 1.70 3.07×10²⁰ 17.5 3.7
SMGA4 5 4.0 203 20 35 35 1225 1.70 1.16×10²⁰ 6.6 1.4
Total 5042 1.41×10²¹
∗L,W,S,T,M
0,σ, andDdenote the length, width, area, rise time, seismic moment, stress drop, and slip amount, respectively.
+
t
eobs(t)−esyn(t)
2
t
eobs(t)2
t
esyn(t)2
⎤ ⎥ ⎥
⎦. (9)
Here, u(t) is the displacement waveform, ande(t)is the acceleration envelope, in the frequency range 0.1–10 Hz.
Nst is the number of stations, and Ncomp is the number of components (here,Ncomp=2; two horizontal components). The parameters estimated by the grid search are the spa-tial dimensions, the rise times of the EGF events, the stress drops (i.e. C values) and rupture starting subfaults of GAs, and the rupture propagation velocities within the SM-GAs. The lengthL, widthW, and rise timeTof the SMGA are given byN l,Nw, Nτ from the lengthl, widthw, and rise timeτ of the EGF event. The search range and its grid interval of the model parameters in the grid search are given in Table 4. The stress drops of the EGF events are cal-culated assuming a circular crack source model (Eshelby, 1957). The strike and dip angles of each SMGA are de-termined based on the local geometry of the plate interface (Table 5). Thus, the deeper SMGA has a slightly steeper dip angle because of the bending of the subducting Pacific slab. The source parameters for SMGA1 and SMGA2 are deter-mined using seventeen stations in the Miyagi, Iwate, and Fukushima prefectures. Those for SMGA3 and SMGA4 are determined using eight stations in the Fukushima and Ibaraki prefectures.
Figure 6 shows a map view of the estimated source model. The source parameters of each SMGA are listed in Table 5. The rupture within SMGA1 propagates to-wards the up-dip direction while that within SMGA2
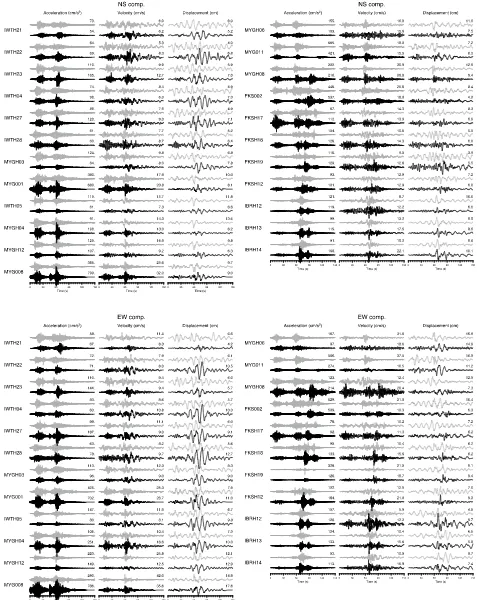
Fig. 7. Comparison between the observed and synthetic acceleration, velocity, and displacement waveforms in the frequency range 0.1–10 Hz. The upper gray traces are observed, and the lower black traces are synthetic waveforms. The waveforms are normalized by the maximum amplitude of the observed waveform. The numbers above the traces are the maximum amplitude of each trace.
agates towards the down-dip directions. The ruptures of SMGA3 and SMGA4 located southwest of the hypocenter mainly propagate in a southwest direction. The stress drops of four SMGAs range from 6.6 to 27.8 MPa. The stress
drop of SMGAs around 20 MPa is similar to those of the 2005 Miyagi-oki earthquake (MJMA7.2) (Suzuki and Iwata, 2007).
Fig.
8.
Comparison
between
the
F
ourier
amplitude
spectra
of
the
observ
ed
(gray)
and
synthetic
accelerations
synthetic acceleration, velocity, and displacement wave-forms in the frequency range 0.1 to 10 Hz at 23 strong mo-tion stamo-tions. Two horizontal components are shown in this figure. Figure 8 presents the comparison between the ob-served and synthetic acceleration Fourier amplitude spectra at the same stations shown in Fig. 7. The synthetic displace-ment waveforms at some stations in Fig. 7 exhibit a larger amplitude than the observations. For those stations, the syn-thetic accelerations and velocities give better fittings. We think that this is likely caused by slight differences in the radiation coefficients due to the difference of focal mecha-nisms and take-off angles between SMGA and EGF events, because the effect of the radiation coefficients are dominant in the lower frequency range. The synthetic ground motions explain well the characteristics of the observed ground mo-tion in the broadband frequency range.
5.
Discussions
5.1 Comparison with other source models
All the strong motion generation areas exist in the deeper portion of the source fault plane, apart from the Japan Trench. The locations of these SMGAs are consistent with the high-frequency radiation estimated from the teleseis-mic back-projection analyses (e.g., Ishii, 2011; Meng et al., 2011) and strong seismic energy from regional back-projection analysis in the frequency range 0.05–0.5 Hz (Honda et al., 2011). For example, Meng et al. (2011) used teleseismic waveforms from 0.5 to 1 Hz and they highlighted the spatial complementarity between low- and high-frequency source properties of this event. The tsunami source was estimated in the shallower portion close to the Japan Trench (e.g., Fujii et al., 2011). Therefore, the main sources of strong ground motions and tsunamis of this earthquake are complementary to each other.
Four SMGAs have nearly identical spatial dimensions. The spatial dimensions of these SMGAs are much smaller than the large slip area resolved by the kinematic waveform inversions using the low-frequency strong motion records (e.g., Koketsuet al., 2011; Suzukiet al., 2011; Yoshidaet al., 2011a, b). The slip amount in SMGA itself is consis-tent with the slip model from those studies. Since most of the current source inversion studies on this event use very coarse grids (∼30 km) over the entire source fault, which is almost the scale of SMGAs, and low-frequency seismic waves mostly less than 0.1 Hz. There are no prominent peaks corresponding to these SMGAs in low-frequency waveforms analyzed in those kinematic source inversion studies. Localized high-slip velocity SMGAs found in this study may not be captured well in those studies.
SMGAs for this event are also studied in other earlier studies (e.g. Kurahashi and Irikura, 2011; Kawabeet al., 2011). The major differences between our source mod-els and theirs are the source fault geometry, and the ve-locity structure model, to locate the SMGAs on the fault. The details in the analysis are somewhat different among those studies. These studies did not consider the three-dimensional geometry of the plate interface. Our study also considered a one-dimensional velocity structure model in locating SMGAs, and in the strong motion simulations us-ing the empirical Green’s function method as explained in
the previous sections. We searched the best model objec-tively by a grid search approach, whereas other studies de-termined their source models by a trial and error method and they described some source parameters by empirical relationships. Some differences in the obtained source pa-rameters might arise from such differences in the model-ing procedures. Nevertheless, Kurahashi and Irikura (2011) and Kawabeet al.(2011) also similarly found two SMGAs in the Miyagi-oki region, west of the epicenter and two or three SMGAs in the Fukuhima-oki and Ibaraki-oki regions. None of the studies found any SMGA in the shallow por-tion of the source fault near the trench. Hence, the overall features of the obtained source model regarding the strong motion generation are consistent with these studies.
5.2 Spatial relationship between SMGAs and past in-terplate events
In the Miyagi-oki region (off Miyagi), which is the vicin-ity of SMGA1 and SMGA2 of the 2011 Tohoku earthquake,
M7-class interplate earthquakes occurred in 1933, 1936, 1937, 1978, 1981, and 2005. In the Fukushima-oki region (off Fukushima), threeM7-class interplate earthquakes oc-curred in 1938.
Yamanaka and Kikuchi (2004) collected the paper mograms recorded by the mechanical strong-motion seis-mometers of JMA since the 1900s, and they analyzed the kinematic source process of eight interplate earthquakes, which occurred after 1930 in northeastern Japan, by the waveform inversion of these paper seismograms. They found that the typical size of individual asperities in north-eastern Japan wasM7-class, and anM8 earthquake could be caused when the ruptures of multiple asperities were syn-chronized. Based on their analyses, they proposed an asper-ity map in this subduction zone. Uminoet al.(2007) relo-cated the mainshocks and aftershocks of six earthquake se-quences in the Miyagi-oki region occurring in 1933, 1936, 1937, 1939, 1978, and 1981 by usingS−Ptimes from the Seismological Bulletin of JMA and original smoked-paper seismograms observed at several seismic stations in the To-hoku district.
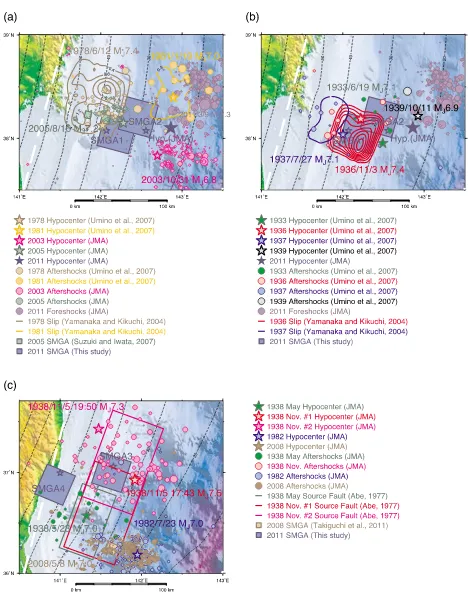
Figure 9(a) spatially compares SMGA1 and SMGA2 with the source regions of interplate events in the Miyagi-oki region on June 12, 1978 (MJMA7.4), January 19, 1981 (MJMA7.0), October 31, 2003 (MJMA6.8), and August 16, 2005 (MJMA7.2). The slip distribution of the 1978 and 1981 events were estimated by Yamanaka and Kikuchi (2004), and the hypocenters of the mainshocks and aftershocks of the 1978 and 1981 events are from Uminoet al. (2007). The hypocenters of the 2003 and 2005 events and the fore-shocks of the 2011 Tohoku earthquakes are taken from the JMA unified earthquake catalog. The source regions of the 1978 and 2005 events overlap each other. However, two SMGAs of the 2005 Miyagi-oki event by Suzuki and Iwata (2007), and two SMGAs of the 2011 Tohoku earthquake, occupy different areas. The SMGA1 and SMGA2 seem to be surrounded by the source regions of 2003 and 2005 se-quences and foreshocks. Thus, the ruptures of SMGA1 and SMGA2 are thought to be different from the 1978 and 2005 Miyagi-oki earthquakes.
area on June 19, 1933 (MJMA7.1), November 3, 1936 (MJMA7.4), July 27, 1937 (MJMA7.1), and October 11, 1939 (MJMA6.9). The hypocenters of the mainshocks and aftershocks of these events are also from Umino et al.
(2007). The slip distributions of the 1936 and 1937 Miyagi-oki events have been estimated by Yamanaka and Kikuchi (2004). They did not analyze the 1933 and 1939 events. The SMGA1 corresponds to the large slip area, or asper-ity, of the 1936 Miyagi-oki earthquake, and the SMGA2 is located inside the aftershock area of the 1933 Miyagi-oki earthquake. These SMGAs are spatially included in the anticipated Miyagi-oki earthquake evaluated by the Head-quarters for Earthquake Research Promotion.
Figure 9(c) shows the spatial comparison of SMGA3 and SMGA4 with the source regions of three interplate events in the Fukushima region occurring in 1938. The first event (MJMA7.0) occurred on May 23, 1938. The second (MJMA7.3) and third (MJMA7.5) events occurred on November 5, 1938. No large interplate earthquake oc-curred in this region after the events of 1938. Abe (1977) estimated the fault dimensions and dislocations of those interplate events of 1938, based on the aftershock dis-tribution, tsunami source area, and forward modeling of regional long-period seismograms using the Haskell-type source model. The 1982 and 2008 Ibaraki-oki interplate events are also shown on the map. The SMGA3 is included in the source region of the 1938 events analyzed by Abe (1977), and is outside the source area of the 1982 and 2008 Ibaraki-oki events. Murotaniet al.(2004) and Uetakeet al.
(2006) also analyzed the regional paper seismograms to ob-tain the slip models for the 1938 Fukuhina-oki sequences, and their results suggest the possibility that SMGA3 is spa-tially included in the source area of an MJMA7.5 event at 19:50 on November 5, 1938 (Nov. #2 event in Fig. 9(c)). As for SMGA4, it is difficult to relate this with past inter-plate events.
From spatial comparisons presented above, the rupture of SMGA1, SMGA2, and SMGA3 are possibly presumed to be the reactivation of pre-existing asperities, or strong motion generation areas, of pastM7-class interplate events in the 1930s. In the 1930s, those asperities ruptured sepa-rately, but they ruptured simultaneously within three min-utes during the 2011 Tohoku earthquake. However, the spa-tial extent of SMGAs for the 2011 Tohoku earthquake is sig-nificantly larger than SMGAs of otherM7-class interplate events in northeast Japan estimated in the previous studies (Suzuki and Iwata, 2007; Takiguchiet al., 2011). Thus, the SMGAs of the 2011 Tohoku earthquake are supposed not to have the same source dimensions with repeatingM7-class events which ruptured in the 1930s. It is likely that the size of the SMGA depend on the magnitude of an earthquake, as do asperities and the total rupture area, even if the location is nearly the same betweenM7 andM9 events. However, there is a possibility that SMGAs estimated in this study still have heterogeneity on a smaller scale, which is not consid-ered in the present study since uniform slip and slip-velocity distributions are assumed within SMGA. Further studies on the hierarchy of SMGA and asperity are necessary to clarify this issue.
6.
Conclusions
The source model composed of four strong motion gen-eration areas of the 2011 Tohoku great subduction earth-quake was estimated based on the broadband strong ground motion simulations using the empirical Green’s function method. Two strong motion generation areas (SMGA1 and SMGA2) are identified in the Miyagi-oki region west of the hypocenter. Another two strong motion generation areas (SMGA3 and SMGA4) are located in the Fukushima-oki region southwest of the hypocenter. The broadband strong ground motions (0.1–10 Hz) along the Pacific coast are mainly controlled by these SMGAs. All the strong motion generation areas exist in the deeper portion of the source fault plane. The stress drops of four SMGAs range from 6.6 to 27.8 MPa, which are similar to estimations for pastM 7-class events in this region. Compared with the slip models and aftershock distributions of past interplate earthquakes in the Miyagi-oki and Fukushima-oki regions since the 1930s, the rupture of strong motion generation areas of the 2011 Tohoku earthquake is presumed to be the reactivation of as-perities of past events, which ruptured separately as M 7-class events in the 1930s. In terms of broadband strong ground motions, the 2011 Tohoku earthquake is not only a tsunamigenic event with huge coseismic slip over a wide area along the trench, but also a complex event rupturing pre-existing asperities. These findings are quite important for the assumption of source models for strong motion pre-dictions from such huge interplate earthquakes. They also provide an insight into the rupture physics of this great in-terplate event in terms of the hierarchy of the source model.
Acknowledgments. We use the strong-motion records of K-NET and KiK-net operated by NIED and hypocentral information cat-alog of JMA, and the moment tensor catcat-alog by Global CMT Project. We would like to thank the staff in these institutes for their continuous effort toward maintaining the system to obtain high-quality data. The digital data of the geometry of the Pa-cific plate is compiled and provided via the Internet by Dr. Fuyuki Hirose at the Meteorological Research Institute of JMA. The slip data of past events are provided by Prof. Yoshiko Yamanaka at Nagoya University. All of figures are drawn by using the Generic Mapping Tools (Wessel and Smith, 1998). The comments from Dr. Yasuhiro Yoshida, Prof. Kuo-Fong Ma, and the associate ed-itor Prof. Tomomi Okada improved the manuscript. This work is partially supported by the Grant-in-Aid for Young Scientists (B) 22710172 from the Japan Society for the Promotion of Science and by the Ministry of Education, Culture, Sports, Science, and Technology (MEXT), Japan under the Observation and Research Program for Prediction of Earthquakes and Volcanic Eruptions.
References
Abe, K., Tectonic implications of the large Shioya-Oki earthquakes of 1938,Tectonophysics,41, 269–289, 1977.
Ammon, C. J., T. Lay, H. Kanamori, and M. Cleveland, A rupture model of the 2011 off the Pacific coast of Tohoku Earthquake,Earth Planets Space,63, 693–696, 2011.
Aoi, S., T. Kunugi, H. Nakamura, and H. Fujiwara, Deployment of new strong motion seismographs of K-NET and KiK-net, in Earthquake Data in Engineering Seismology: Predictive Models, Data Management and Networks, edited by S. Akkar, P. G¨ulkan, and T. van Eck, Geotech-nical, Geological, and Earthquake Engineering,14, 167–186, Springer, Dordrecht, The Netherlands, 2011.
Asano, K. and T. Iwata, Source modeling and strong motion simulation of the 2009 Suruga Bay earthquake (MJMA6.5) using the empirical
Eshelby, J. D., The determination of the elastic field of an ellipsoidal inclusion, and related problems,Proc. Roy. Soc.,A241, 376–396, 1957. Fujii, Y., K. Satake, S. Sakai, M. Shinohara, and T. Kanazawa, Tsunami source of the 2011 off the Pacific coast of Tohoku Earthquake,Earth Planets Space,63, 815–820, 2011.
Hartzell, S. H., Earthquake aftershocks as Green’s functions,Geophys. Res. Lett.,5, 1–4, 1978.
Hayes, G. P., Rapid source characterization of the 2011Mw 9.0 off the
Pacific coast of Tohoku Earthquake,Earth Planets Space,63, 529–534, 2011.
Honda, R., Y. Yukutake, H. Ito, M. Harada, T. Aketagawa, A. Yoshida, S. Sakai, S. Nakagawa, N. Hirata, K. Obara, and H. Kimura, A complex rupture image of the 2011 off the Pacific coast of Tohoku Earthquake revealed by the MeSO-net,Earth Planets Space,63, 583–588, 2011. Hoshiba, M., K. Iwakiri, N. Hayashimoto, T. Shimoyama, K. Hirano, Y.
Yamada, Y. Ishigaki, and H. Kikuta, Outline of the 2011 off the Pacific coast of Tohoku Earthquake (Mw9.0)—Earthquake Early Warning and
observed seismic intensity—,Earth Planets Space,63, 547–551, 2011. Ide, S., A. Baltay, and G. C. Beroza, Shallow dynamic overshoot and energetic deep rupture in the 2011 Mw 9.0 Tohoku-Oki earthquake,
Science,332, 1426–1429, 2011.
Irikura, K., Prediction of strong acceleration motions using empirical Green’s function,Proc. 7th Jpn. Earthq. Eng. Symp., 151–156, 1986. Irikura, K., T. Kagawa, and H. Sekiguchi, Revision of the empirical
Green’s function method by Irikura (1986),Abstr. Seismol. Soc. Jpn. Fall Meet., B25, 1997 (in Japanese).
Ishii, M., High-frequency rupture properties of theMw9.0 off the Pacific
coast of Tohoku Earthquake,Earth Planets Space,63, 609–614, 2011. Kamae, K. and H. Kawabe, Source model composed of asperities for the
2003 Tokachi-oki, Japan, earthquake (MJMA = 8.0) estimated by the
empirical Green’s function method,Earth Planets Space,56, 323–327, 2004.
Kawabe, H., K. Kamae, and H. Uebayashi, Source model of the 2011 Tohoku-Chiho Taiheiyo-oki earthquake,Abstr. Seismol. Soc. Jpn. Fall Meet., B22-05, 2011 (in Japanese).
Koketsu, K., H. Miyake, H. Fujiwara, and T. Hashimoto, Progress towards a Japan integrated velocity structure model and long-period ground motion hazard map,Proc. 14th World Conf. Earthq. Eng., paper no. S10-038, 2008 (DVD-ROM).
Koketsu, K., Y. Yokota, N. Nishimura, Y. Yagi, S. Miyazaki, K. Satake, Y. Fujii, H. Miyake, S. Sakai, Y. Yamanaka, and T. Okada, A unified source model for the 2011 Tohoku earthquake,Earth Planet. Sci. Lett., 310, 480–487, 2011.
Kunugi, T., S. Aoi, W. Suzuki, H. Nakamura, N. Morikawa, and H. Fu-jiwara, Strong motions of the 2011 Tohoku-Oki earthquake,Natural Disaster Res. Rep., NIED,48, 63–71, 2012 (in Japanese with English abstract).
Kurahashi, S. and K. Irikura, Source model for generating strong ground motions during the 2011 off the Pacific coast of Tohoku Earthquake,
Earth Planets Space,63, 571–576, 2011.
Meng, L., A. Inbal, and J.-P. Ampuero, A window into the complexity of the dynamic rupture of the 2011 Mw 9 Tohoku-Oki earthquake,
Geophys. Res. Lett.,38, L00G07, doi:10.1029/2011GL048118, 2011. Miyahara, M. and T. Sasatani, Estimation of source process of the
1994 Sanriku Haruka-oki earthquake using empirical Green’s function method,Geophys. Bull. Hokkaido Univ., Sapporo, Jpn.,67, 197–212, 2004 (in Japanese with English abstract).
Miyake, H., T. Iwata, and K. Irikura, Strong ground motion simulation and source modeling of the Kagoshima-ken Hokuseibu earthquakes of March 26 (MJMA6.5) and May 13 (MJMA6.3), 1997, using empirical
Green’s function method,Zisin 2 (J. Seismol. Soc. Jpn.),51, 431–442, 1999 (in Japanese with English abstract).
Miyake, H., T. Iwata, and K. Irikura, Source characterization for broadband ground-motion simulation: Kinematic heterogeneous source model and
strong motion generation area,Bull. Seismol. Soc. Am.,93, 2531–2545, 2003.
Murotani, S., M. Kikuchi, Y. Yamanaka, and K. Shimazaki, Rupture pro-cess of large Fukushima-oki earthquakes in 1938 (2),Abstr. Seismol. Soc. Jpn. Fall Meet., P-029, 2004 (in Japanese).
Nakajima, J. and A. Hasegawa, Anomalous low-velocity zone and linear alignment of seismicity along it in the subducted Pacific slab beneath Kanto, Japan: Reactivation of subducted fracture zone?,Geophys. Res. Lett.,33, L16309, doi:10.1029/2006GL026773, 2006.
Nakajima, J., F. Hirose, and A. Hasegawa, Seismotectonics be-neath the Tokyo metropolitan area, Japan: Effect of slab-slab con-tact and overlap on seismicity, J. Geophys. Res., 114, B08309, doi:10.1029/2008JB006101, 2009.
Nettles, M., G. Ekstr¨om, and H. C. Koss, Centroid-moment-tensor analysis of the 2011 off the Pacific coast of Tohoku Earthquake and its larger foreshocks and aftershocks,Earth Planets Space,63, 519–523, 2011. Satoh, T., H. Kawase, and T. Sato, Statistical spectral model of earthquakes
in the eastern Tohoku district, Japan, based on the surface and borehole records observed in Sendai,Bull. Seismol. Soc. Am.,87, 446–462, 1997. Shao, G., X. Li, C. Ji, and T. Maeda, Focal mechanism and slip history of the 2011Mw9.1 off the Pacific coast of Tohoku Earthquake, constrained
with teleseismic body and surface waves,Earth Planets Space,63, 559– 564, 2011.
Suzuki, W. and T. Iwata, Source model of the 2005 Miyagi-Oki, Japan, earthquake estimated from broadband strong motions,Earth Planets Space,59, 1155–1171, 2007.
Suzuki, W., S. Aoi, H. Sekiguchi, and T. Kunugi, Rupture pro-cess of the 2011 Tohoku-Oki mega-thrust earthquake (M9.0) in-verted from strong-motion data, Geophys. Res. Lett., 38, L00G16, doi:10.1029/2011GL049136, 2011.
Takiguchi, M., K. Asano, and T. Iwata, The comparison of source mod-els of repeating subduction-zone earthquakes estimated using broad-band strong motion records—1982 and 2008 Ibaraki-ken-oki M 7 earthquakes—,Zisin 2 (J. Seismol. Soc. Jpn.),63, 223–242, 2011 (in Japanese with English abstract).
Uetake, T., J. Kanaya, K. Hijikata, K. Kato, and M. Nakamura, Asperity distribution of E off Fukushima Prefecture, Japan, evaluated by wave-form inversion analysis,Proc. 12th Jpn. Earthq. Eng. Symp., 382–385, 2006 (in Japanese with English abstract).
Umino, N., T. Kono, T. Okada, J. Nakajima, T. Matsuzawa, N. Uchida, A. Hasegawa, Y. Tamura, and G. Aoki, Relocation of the M ∼ 7 Miyagi-oki earthquakes in the 1930s: Seismic slips of asperities that were re-ruptured during the 1978M7.4 Miyagi-oki earthquake?,Zisin 2 (J. Seismol. Soc. Jpn.),59, 325–337, 2007 (in Japanese with English abstract).
Wessel, P. and W. H. F. Smith, New, improved version of Generic Mapping Tools released,Eos Trans. AGU,79, 579, 1998.
Yagi, Y. and Y. Fukahata, Rupture process of the 2011 Tohoku-oki earth-quake and absolute elastic strain release, Geophys. Res. Lett., 38, L19307, doi:10.1029/2011GL048701, 2011.
Yamanaka, Y. and M. Kikuchi, Asperity map along the subduction zone in northeastern Japan inferred from regional seismic data,J. Geophys. Res.,109, B07307, doi:10.1029/2003JB002683, 2004.
Yoshida, K., K. Miyakoshi, and K. Irikura, Source process of the 2011 off the Pacific coast of Tohoku Earthquake inferred from waveform inversion with long-period strong-motion records,Earth Planets Space, 63, 577–582, 2011a.
Yoshida, Y., H. Ueno, D. Muto, and S. Aoki, Source process of the 2011 off the Pacific coast of Tohoku Earthquake with the combination of teleseismic and strong motion data,Earth Planets Space,63, 565–569, 2011b.