Error Detection in Automatic Speech Recognition
Farshid Zavareh, Ingrid Zukerman, Su Nam Kim and Thomas Kleinbauer Faculty of Information Technology, Monash University
Clayton, VICTORIA 3800, Australia [email protected],
{Ingrid.Zukerman,Su.Kim,Thomas.Kleinbauer}@monash.edu
Abstract
We offer a supervised machine learn-ing approach for recognizlearn-ing erroneous words in the output of a speech recognizer. We have investigated several sets of fea-tures combined with two word configura-tions, and compared the performance of two classifiers: Decision Trees and Naïve Bayes. Evaluation was performed on a cor-pus of 400 spoken referring expressions, with Decision Trees yielding a high recog-nition accuracy.
1 Introduction
One of the main stumbling blocks for spoken Nat-ural Language Understanding (NLU) systems is the lack of reliability of Automatic Speech Rec-ognizers (ASRs) (Pellegrini and Trancoso, 2010). Recent research prototypes of ASRs yield Word Error Rates (WERs) between 15.6% (Pellegrini and Trancoso, 2010) and 18.7% (Sainath et al., 2011) for broadcast news. However, the WER of the ASR we employed (Microsoft Speech SDK 6.1) is 34% when trained on an open vocabulary plus a small language model for our corpus. This WER is consistent with that obtained in the 2010 Spoken Dialogue Challenge (Black et al., 2011).
In this paper, we offer a supervised machine learning approach to detect erroneous words in ASR output (this step will be followed by auto-matic error correction). Our approach was evalu-ated on a corpus of 400 spoken referring expres-sions, with the best-performing option yielding an average accuracy of 89% (Section 5).
The rest of this paper is organized as follows. In the next section, we discuss related work. In Sec-tion 4, we describe our experimental design, fo-cusing on the features considered for our machine-learning approach. In Section 5, we discuss our re-sults, followed by concluding remarks.
2 Related Research
Approaches for improving the performance of spoken NLU systems may be classified into pre-ventionandrecovery.
Prevention avoids errors by constraining the vocabulary (Gorniak and Roy, 2005; Sugiura et al., 2009) and grammatical constructs (Brooks and Breazeal, 2006) understood by an ASR. ASRs that employ this approach can process expected utter-ances efficiently, and work well in restricted do-mains. However, these ASRs have trouble process-ing unexpected utterances.
Recovery involves error detection followed by correction. During detection, an NLU system posits that a word in an utterance was incorrectly recognized. Three approaches to error recovery are described in (López-Cózar and Griol, 2010; Ringger and Allen, 1996; Zhou et al., 2006).
López-Cózar and Griol (2010) consider statis-tical information, and lexical, syntactic, semantic and dialogue-related information to correct ASR errors (i.e., replace, insert or delete words in a textual ASR output), and syntactic approaches to modify tenses of verbs and grammatical numbers to better match grammatical expectations.
Ringger and Allen (1996) use statistical infor-mation to construct a language model that quanti-fies the likelihood of word sequences, and a noisy channel model that predicts errors made by an ASR. They perform error detection and correction at the same time based on these models, which are trained using the words expected in the domain.
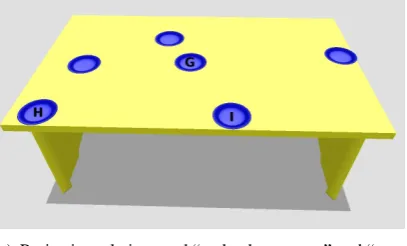
de-(a) Projective relations and “end, edge, corner” and “cen-ter” of a table
[image:2.595.317.522.60.188.2](b) Colour, size, positional relation and intervening object in a room
Figure 1: Two of the scenarios used to construct our corpus.
tected, all the characters in it are deemed to be wrong. Correction is then performed using a list of candidate alternatives for each erroneous char-acter to generate a list of word hypotheses, and a linguistic model based on mutual information and trigrams to select the best word hypothesis.
Like these researchers, we offer corpus-based techniques to detect ASR errors. However, we em-ploy features of the ASR output, rather than actual words or expectations from the context. By do-ing this, we hope to avoid over-fittdo-ing to domain-specific words and expectations.
3 The Corpus
Error detection performance was evaluated using the corpus constructed by Kleinbaueret al.(2013). The corpus originally comprised 432 free-form descriptions spoken by26trial subjects to refer to
12designated objects in four scenarios (three ob-jects per scenario, where a scenario contains be-tween 8 and 16 objects; two scenarios appear in Figure 1). Half of the participants were native En-glish speakers, and half were non-native. All the speakers were proficient in English, but the non-native speakers had a foreign accent, and some had idiosyncratic turns of phrase.
We manually filtered out 32 descriptions that were broken up by the ASR due to pauses made by the speakers, leaving 400descriptions, which comprise 3,128 words in total, and 118 unique words. The descriptions, which varied in length and complexity, had an average length of 10 words and a median length of 8 words, with the longest description containing 21 words. Sample descrip-tions are: “the green plate next to the screwdriver at the top of the table”, “the large pink ball in the middle of the room”, “the plate in the corner of the table”, and “the picture on the wall”.
The ASR produced up to 50 alternative textual
interpretations for each spoken description, ranked in descending order of probability. In total,4,249
texts, with33,927words (706unique) were gen-erated. It is worth noting that more alternatives, with a higher average WER for the tranked op-tions, were generated for non-native speakers than for native speakers.
We used the Levenshtein distance to align each alternative produced by the ASR with the refer-ence (correct) description. The words in the al-ternative were then labeled as follows: Correct, Inserted – absent from the reference interpreta-tion,Replaced – an incorrect word instead of the reference word, andDeleted – a placeholder for a reference word that is not in the alternative. The Inserted and Replaced words comprise theWrong
class (Deleted words cannot be modeled).
4 Experimental Design
In this section, we discuss the classifiers we con-sidered, our feature sets, and evaluation methods.
Classifiers. We investigated two classifiers to decide whether a word in a text produced by the ASR is correct: Decision Trees (DT) (Quinlan, 1993) and Naïve Bayes classifiers (NB) (Domin-gos and Pazzani, 1997) (cs.waikato.ac.nz/ml/ weka/).1For NB, we used equal-width binning to discretize continuous features (Catlett, 1991; Ker-ber, 1992).
Features. The target classes are Correct or
Wrong, and three types of features were computed for each wordwin a text: word based (5), sentence based (6), and phoneme based (2).
Word-based features. (1) Part of Speech (PoS)
as determined by the Stanford PoS Tagger
[image:2.595.80.284.63.186.2](nlp.stanford.edu/software/tagger.shtml); (2) Stop Word as determined by the list in webconfs.com/stop-words.php; (3)Position of win the text, defined as a nominal feature taking one of the values Beginning, Middle or End; (4)Timetaken by the speaker to pronounce word w (in fraction of a second); and (5) Confidence Scoregiven to wordwby the ASR.
Sentence-based features. (6) Repetition Count
– number of alternatives where w is re-peated; (7) Repetition Ratio (equivalent to purity score (Zhou et al., 2006)) –Repetition Count di-vided by the total number of alternatives; (8) Re-placement Ratio – number of alternatives which, when aligned with the current alternative, labelw with “R”, divided by the total number of alterna-tives; (9)Insertion Ratio– number of alternatives which, when aligned with the current one, labelw with “I”, divided by the total number of alterna-tives; (10)Rankof the alternative containingwin the ASR output; and (11)Sentence Length– num-ber of words in the current alternative.
Phoneme-based features(according to the CMU Pronunciation Dictionary, speech.cs.cmu.edu/ cgi-bin/cmudict). (12) Broad Sound Groups (BSGs) – a vector of length 8that represents the number of times each BSG occurs in wordw, e.g., the word “problem” has 2 vowels, 2 stops, 2 liq-uids, and 1 nasal; and (13) Phonemes – a vector of length 39 that represents the number of times a phonetic symbol appears in w’s phonetic tran-scription.
We experimented with the following sets of fea-tures: (1) Word + Sentence features, (2) BSGs, and (3)Phonemes. These features were computed for the current word (C), which is being classi-fied, and for the previous, current and next word (PCN). For example, the following vector is pro-duced when all 58 features are used for the cur-rent word (the first and last word in an alternative have missing features forP andN respectively): f1, . . . , f5
| {z }
Word
, f6, . . . , f11
| {z }
Sentence
, f12, . . . , f19
| {z }
BSGs
, f20, . . . , f58
| {z }
Phonemes .
[image:3.595.308.526.93.243.2]Sets of features that included actual words pro-duced accuracies of over 95%, but were unlikely to generalize. This was evident by inspecting the generated decision tree, which was shallow and wide. In fact, whenw was used, most other fea-tures were ignored. Consequently, we decided not to include the actual words in our feature sets.
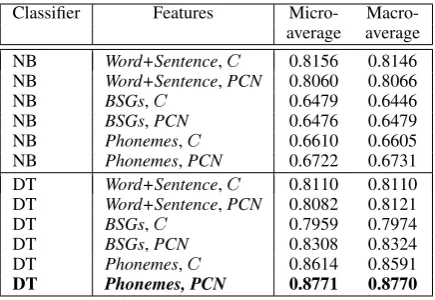
Table 1: Accuracy of DT versus NB: Different fea-ture combinations.
Classifier Features Micro- Macro-average average NB Word+Sentence,C 0.8156 0.8146 NB Word+Sentence,PCN 0.8060 0.8066
NB BSGs,C 0.6479 0.6446
NB BSGs,PCN 0.6476 0.6479
NB Phonemes,C 0.6610 0.6605
NB Phonemes,PCN 0.6722 0.6731 DT Word+Sentence,C 0.8110 0.8110 DT Word+Sentence,PCN 0.8082 0.8121
DT BSGs,C 0.7959 0.7974
DT BSGs,PCN 0.8308 0.8324
DT Phonemes,C 0.8614 0.8591
DT Phonemes, PCN 0.8771 0.8770
Evaluation method. We employed 13-fold cross validation to train and test our corpus, where each fold comprises descriptions spoken by one native English speaker and one non-native speaker (Section 3). The per-speaker split ensures that sen-tences spoken by one trial subject do not appear in both training and test sets; and the native/non-native pairing balances the test sets, in the sense that they are of similar size, and ASR performance is similar for all sets (Section 3).
5 Results
Table 1 shows the results of our initial tests, which compare the performance of DT with that of NB in terms of micro- and macro-averaged accuracy (recall that the majority class ofCorrectwords is 66%, Section 1). The odd-numbered rows contain the results for the three sets of features computed only forC, and the even-numbered rows contain the results for PCN. The statistically significant best result is boldfaced (statistical significance was calculated using the Paired Student’s t-test).
As seen in Table 1, compared to C, PCN has a mixed effect on NB’s performance, depending on the base features: PCN yields a statistically significant drop in accuracy for Word+Sentence
(p-value=0.03), no statistically significant change forBSGs, and an improvement forPhonemes( p-value=0.015). The results are more consistent for DT: there is no significant difference in perfor-mance betweenCandPCNforWord + Sentence, but PCN yields statistically significant improve-ments for the other feature sets (p-value≤0.05).
There were no statistically significant differ-ences in accuracy between DT and NB for
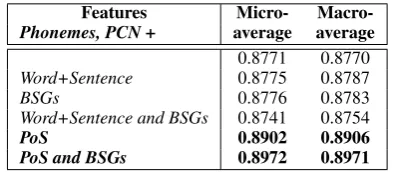
Table 2: Accuracy comparison for DT with
Phonemesplus different feature combinations.
Features Micro- Macro-Phonemes, PCN+ average average
0.8771 0.8770
Word+Sentence 0.8775 0.8787
BSGs 0.8776 0.8783
Word+Sentence and BSGs 0.8741 0.8754
PoS 0.8902 0.8906 PoS and BSGs 0.8972 0.8971
yielded a better performance than C for DT. Hence, our next tests are carried out using DT with
PCNonly.
Table 2 shows the results of combining
Phonemes, which give the best accuracy (Table 1), with three feature sets: Word+Sentence, BSGs
and PoS. The last two rows in Table 2 (bold-faced) show the feature sets that yield the high-est (statistically equivalent) accuracies. These re-sults, which were obtained with PoS, with and without BSGs, are significantly better than those achieved whenWord + Sentencefeatures orBSGs
were used (p-value ≤ 0.05). Also, combining
Phonemes with Word+Sentence, BSGs and both
Word+Sentence andBSGs does not yield signifi-cant performance changes.
The most significant features in the best-performing decision trees are (in descending or-der): presence of the phonemes TH and Z, num-ber of occurrences ofN(≤1 versus 1<), whether
PoS=JJ (adjective), and whether the next word contains a stop BSG(at level 5 in the tree). This indicates that certain phonemes are prone to ASR mis-interpretation — an insight that has signifi-cant implications for the next stage of the ASR process, which consists of proposing replacements for words that are classified as Wrong. For ex-ample, we could create a confusion matrix be-tween error-prone phonemes produced by the ASR and likely replacement phonemes, and suggest re-placement words that include these hypothesized phonemes (Thomas et al., 1997; Zhou et al., 2006). It is worth noting that the ASR’sConfidence Score
was not used in the best-performing DTs. In fact, we observed that this score is often inconsistent with theCorrect/Wrongclass of a word.
As mentioned in Section 4, using the actual words as a classification feature yielded deci-sion trees that over-fitted the data. Thus, it is possible that a similar effect takes place when
Phonemes are used. Additional tests on differ-ent datasets should be conducted to rule out this
Table 3: Accuracy comparison for DT withBSGs
plus different feature combinations.
Features Micro- Macro-BSGs, PCN+ average average
0.8308 0.8324
Word+Sentence 0.8640 0.8626 PoS 0.8639 0.8632
possibility. Notice, however, thatBSGswithPCN
yield a creditable performance (third last row in Table 1), which improves statistically signifi-cantly (p-value << 0.01) when BSGs are com-bined with PoS and Word+Sentence (Table 3). This is noteworthy because BSGs are abstrac-tions ofPhonemes, and hence are less likely than
Phonemesto fit a small number of words. Further, a correction procedure similar to that suggested for
Phonemeswould be applicable forBSGs.
6 Conclusions and Future Work
We have proposed a supervised learning method to predict the correctness of words in an ASR output. Our best classifier yields 89% accuracy. However, these results were obtained on a rela-tively small corpus with a limited vocabulary (Sec-tion 3). Hence, further tests with larger, more di-verse corpora are needed to verify our results.
As mentioned in Section 3, we aligned the al-ternatives returned by the ASR with the reference text in order to label the words in each alterna-tive. In addition, we aligned the alternatives with each other to compute multi-alternative features, such as Repetition countand Replacement ratio. In doing so, we implicitly assumed that there is a one-to-one mapping between the words in an al-ternative and those in the reference text, and also between the words in alternatives generated for the same spoken description. However this assump-tion is not always valid: we have observed cases where one word has been split into two words by the ASR, or a few words have been merged into one. Ringger and Allen (1996) have proposed a statistical solution to this problem, but unfortu-nately their method relies heavily on the vocab-ulary on which the system was trained. This prob-lem will be addressed in the future.
The methods offered in this paper do not distin-guish between aWrongword andNoise(sighs or hesitations that are often mis-heard by the ASR as “and”, “on” or “in”). In the future, we propose to retrain our system to deal with three classes, viz
[image:4.595.80.277.101.187.2]Acknowledgments
This research was supported in part by grants DP110100500 and DP120100103 from the Aus-tralian Research Council. The authors thank Ma-sud Moshtaghi for his help with statistical issues.
References
A. Black, S. Burger, A. Conkie, H. Hastie, S. Keizer, O. Lemon, N. Merigaud, G. Parent, G. Schubiner, B. Thomson, J.D. Williams, K. Yu, S. Young, and M. Eskenazi. 2011. Spoken dialog challenge 2010: Comparison of live and control test results. In Pro-ceedings of the 11th SIGdial Conference on Dis-course and Dialogue, pages 2–7, Portland, Oregon.
A.G. Brooks and C. Breazeal. 2006. Working with robots and objects: Revisiting deictic reference for achieving spatial common ground. InProceedings of the 1st ACM SIGCHI/SIGART Conference on Human-robot Interaction, pages 297–304, Salt Lake City, Utah.
J. Catlett. 1991. On changing continuous attributes into ordered discrete attributes. InEWSL-91 – Pro-ceedings of the European Working Session on Learn-ing, pages 164–178, Porto, Portugal.
P. Domingos and M. Pazzani. 1997. On the optimal-ity of the simple Bayesian classifier under zero-one loss. Machine Learning, 29:103–130.
P. Gorniak and D. Roy. 2005. Probabilistic grounding of situated speech using plan recognition and refer-ence resolution. In ICMI’05 – Proceedings of the 7th International Conference on Multimodal Inter-faces, pages 138–143, Trento, Italy.
R. Kerber. 1992. ChiMerge: Discretization of numeric attributes. InAAAI92 – Proceedings of the 10th Na-tional Conference on Artificial Intelligence, pages 123–128, San Jose, California.
Th. Kleinbauer, I. Zukerman, and S.N. Kim. 2013. Evaluation of theScusi?spoken language interpre-tation system – A case study. In IJCNLP2013 – Proceedings of the 6th International Joint Confer-ence on Natural Language Processing, pages 225– 233, Nagoya, Japan.
J.D. Lafferty, A. McCallum, and F.C.N. Pereira. 2001. Conditional Random Fields: Probabilistic models for segmenting and labeling sequence data. In ICML’2001 – Proceedings of the 18th International Conference on Machine Learning, pages 282–289, Williamstown, Massachusetts.
R. López-Cózar and D. Griol. 2010. New technique to enhance the performance of spoken dialogue sys-tems based on dialogue states-dependent language models and grammatical rules. InProceedings of In-terspeech 2010, pages 2998–3001, Makuhari, Japan.
T. Pellegrini and I. Trancoso. 2010. Improving ASR error detection with non-decoder based features. In Proceedings of Interspeech 2010, pages 1950–1953, Makuhari, Japan.
J. R. Quinlan. 1993. C4.5: Programs for Machine Learning. Morgan Kaufmann Publishers, San Ma-teo, California.
E. Ringger and J.F. Allen. 1996. A fertility chan-nel model for post-correction of continuous speech recognition. InICSLP-96 – Proceedings of the 4th International Conference on Spoken Language Pro-cessing, pages 897–900, Philadelphia, Pennsylvania.
T.N. Sainath, B. Ramabhadran, M. Picheny, D. Na-hamoo, and D. Kanevsky. 2011. Exemplar-based sparse representation features: From TIMIT to LVCSR. IEEE Transactions on Audio, Speech and Language Processing, 19(8):2598–2613.
K. Sugiura, N. Iwahashi, H. Kashioka, and S. Naka-mura. 2009. Bayesian learning of confidence mea-sure function for generation of utterances and mo-tions in object manipulation dialogue task. In Pro-ceedings of Interspeech 2009, pages 2483–2486, Brighton, United Kingdom.
I.E. Thomas, I. Zukerman, I. Oliver, D. Albrecht, and B. Raskutti. 1997. Lexical access for speech under-standing using Minimum Message Length encoding. InUAI’97 – Proceedings of the 13th Annual Confer-ence on Uncertainty in Artificial IntelligConfer-ence, pages 464–471, Providence, Rhode Island.