433
2D QR Barcode Recognition Using Texture Features and Neural
Network
Priyanka Gaur
1, Shamik Tiwari
2 1M.Tech, Department of CSE, MUST, Rajasthan, India
2
Asst. Professor, Department of CSE, MUST, Rajasthan, India
Abstract - Barcode is a representation of information which is non human readable. Barcode can be characterized into two
categories 1-dimensional barcode and 2-dimensional barcode. Quick Response (QR) code is popular type of two dimensional barcode. Information stored in QR code is in the form of white and black dots. The stored information is related to the product to which it is attached. This information can be retrieved by capturing the image of QR code using today’s mobile phones which comes with a camera and internet connection. Image processing provides various techniques to process this captured image. This research paper presents a novel method for QR barcode recognition using the texture features and neural network. All the operations are performed on the MATLAB platform. Performance of proposed methodology is evaluated using a database of QR code images. ZXing library is also used for recognition purpose which shows the satisfactory results.
Key Words: QR Barcode, Texture Features, Neural Network, MATLAB, ZXing library.
1. INTRODUCTION
QR barcode or quick response code is the 2-dimensional barcode, which capable of handling all type of data like numeric, alphanumeric, binary etc [1]. The encoding scheme used by the QR code is depends on the positioning of its elements white and black dots in a matrix. The size [2] of QR code is depends on its version which range from version 1 to version 40.QR codes also have the error correction capability. This helps in restoration of data if the code is dirty or damaged. At the place of traditional barcode scanner, now image processing based barcode readers are used [3]. This new class of service enables users to online product lookup if the product number can be retrieved from a camera image of the barcode. So we can say that, today’s mobile phone can also be used as barcode reader [4] together with the internet access and taking pictures and videos. But the main problem using this technique is that captured barcode image may be of low quality if is not captured correctly so the decoder can refuse to give output. Image processing provides possibilities for resolving this problem. Using the technologies of image processing, recognition of barcode region is easy and the processed image or segmented barcode is more suitable for any decoder software than direct mobile captured image. Various image processing techniques are proposed by some authors like Johann et al. [5] proposed a algorithm which locates the barcode region using scan line of brightness values. In [6] Liu et al presents a method of barcode recognition which is based on the gradient features and DCT transform. Wang et al.[7] uses a method for 2d barcode localization. This method for Data Matrix barcode localization based on boundary tracking and Radon transform. Yang et al.[8] proposed a techniques in which they first locates the two parallel boundary lines of barcode boundary and edge tracing is used for final barcode segmentation. Gaur et al. [9] uses a technique for barcode recognition which is based on the morphological operations and edge detection. This research paper presents a novel
technique for recognition of QR barcode which depends on texture feature analysis and neural network classifier. Figure 1 shows the example of 2D QR barcode.
Fig. 1. QR code barcode pattern.
2. TEXTURE FEATURES
Texture is a description of the spatial arrangement of color or intensities in an image or a selected region of an image [10].Generally speaking, textures are complex visual patterns composed of entities, or sub patterns that have characteristic brightness, color, slope, size, etc. Texture consists of texture primitives or elements called texels.
2.1 Feature Extraction using texture analysis
434 2.1.1 Texture Analysis
Texture can be defined as a regular repetition of an element or pattern on a surface [11]. For example let an image is a function f(x, y) of two space variables x and y, x=0, 1… N-1 and y=0, 1… M-1. And the total no intensity levels in image is G so, function f(x, y) can take the intensity values i=0,1…..G-1.
Now we take the advantage of function of intensity level histogram which is a concise summary of the statistical information of an image [10]. The histogram function shows (for each intensity level) the number of pixels in the whole image, which have this intensity. This is calculated by:
h(i)=
(1)
Where (j,i) is the Kronecker delta function which measures the measure of flatness of the histogram.
j,i)= (2)
Histogram contains the first-order statistical information about the image, since its calculation involves only one pixel. For calculation of the approximate probability density of occurrence of the intensity levels, values h(i) is divided by number of pixels in the image. Equation 2 represents this calculation:
p(i)= h(i)/NM,
(3)Where i=0,1,2,…… G-1.
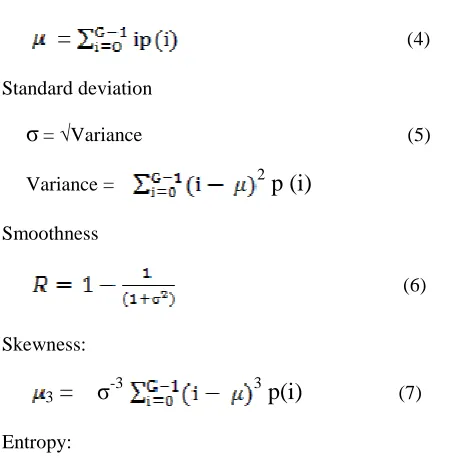
This p(i) value then used to calculate first-order statistical properties (feature value)of the image with the help of stastical function defined by Equations (4-9).
Mean
=
(4)
Standard deviation
σ
= √Variance (5)Variance =
2
p (i)
Smoothness
(6)
Skewness:
3
= σ
-3 3p(i)
(7)Entropy:
(8)
Energy
(9)
The mean calculates the average of intensity of the image, whereas the variance describes the variation of intensity around the mean. Relative smoothness of a region is computed by the smoothness(R). The skewness is zero if the histogram is symmetrical about the mean, and is otherwise either positive or negative depending whether it has been skewed above or below the mean. The entropy is a measure the randomness and energy is of histogram uniformity.
3. ARTIFICIAL NEURAL NETWORK
[image:2.595.35.260.553.782.2]Artificial Neural Network (ANN) [12] is the network made up of artificial interconnected group of neurons. ANN uses a computational model which requires a learning process. This learning process based on connection approach of the neurons. In the field of image processing ANN is used due to its characteristics e.g. its learning ability, adaptivity, massive parallelism, low energy consumption, fault tolerance and many more [12]. ANN is the solution to many image processing field’s problems like recognition, classification, clustering. The basic architecture of a neuron presented in the figure 2.This architecture of neuron is the basis for designing artificial neural network.
Fig. 2. A neuron model
This neuronal model consists of three elements:
1. Input: Input to the neuron from external environment is a
vector x=[x1, x2 . . . xn] which are associated with the weight
or strength wi . The weight can be positive or negative. The
positive weight responsible for excitation of node output and the negative weight inhibit the node output. The weight value represented by the w1, w2 . . . wn.
2. Summing Junction: Summing junction is consists of an
adder for summing the input signals. The output of the summing junction gives the final processed input represented by equation:
Wn
W2
W1
∑
F
Summing Junction
Y
Synaptic Weights
Inputs
X1
X2
xn
Activation Function
Bk(Bias)
435
(10)
3. Activation Function: An activation function (e.g. Threshold, linear etc.) is used for limiting the amplitude of the output of a neuron. The output y of a neuron can be represented by the equation:
(11)
Where f is the activation function and bk is the bias input or
fixed input for a neuron.
The proposed work uses the neural network for barcode recognition. Process includes the training and testing which is performed after configuration of network.
4. PROPOSED METHODOLOGY
Fig. 3. Block diagram of proposed methodology.
Neural network training is done by using image blocks with and without barcode region. All barcode images used for training and testing divided into blocks for processing. Now, for each block
stat texture features are extracted. After that, Neural Network is trained and tested with these stat texture features of both positive sample (blocks with barcode region) and negative sample (non-barcode region) blocks. Now, this trained neural network can be used to locate the barcode in any image if present.
5. IMPLEMENTATION
Stage 1: Preprocessing
All the input images used for feature extraction, training and testing of neural network should be of same size. So, all the images are resized for further processing. The input image (Figure 4) is first resized equal to the size of images used for training of neural network.
Fig. 4. Barcode image captured by a mobile phone.
Stage 2: dividing image into blocks
The whole process is relies on both pixel level and block level processing. The block size of 80 × 70 pixels is chosen. If required, all four edges of the input image will be trimmed so that the image size is divisible by the block size. Same size of blocks is required so that the features of equal size blocks can be used to train the neural network.
For example figure 5 shows six non-overlapping blocks of equal size obtained by blocking process. The block denoted by a, b, c, d captures a part of the barcode, while the block denoted by e, f, g, h captures a part of the texts surrounding the barcode.
(a) (b) (c) (d)
(e) (f) (g) (h)
Test Sample Training Samples
Extraction of Statistical Moments
Features
Training of Neural Network
Trained Neural Network
Barcode Recognition using Neural Network Classifier
Extraction of Statistical Moments
Features Preprocessing
Dividing image into blocks
Input Barcode Images
Recognized Barcode Bounding box formation
around localized barcode region
436
Fig. 5. Some blocks of captured image shown in fig. 4. (a), (b) (c) and (d) are located within barcode region. (e), (f), (g) and (d) blocks are located
within other image region.
Stage 3: feature extraction
[image:4.595.30.291.224.423.2]After converting input image into same size blocks, statistic features of each block is extracted using statistical functions which are mean, standard deviation, smoothness, skewness, uniformity and entropy.(described by equations (4-9))
Table 1: Extracted features of two blocks
Feature Name Feature value of block consisting of barcode region
Feature value of block not consisting of barcode region
Mean 171.0315 218.3247
Standard
deviation 61.0195 2.0766
Smoothness 0.0541 6.6312
Skewness -0.9576 6.47835
energy 0.0293 0.1375
entropy 5.9650 3.0971
Stage 3: Training and testing
For training of neural network 10 2d barcode images are selected from database [13]. Then these images are divided into same size blocks. Total 56 blocks are then selected from one image in which 28 are positive sample (with barcode region) and 28 are negative sample (without barcode region). For each block six statistical features are extracted. So, from one image 168 features taken as positive sample and 168 features are taken as negative samples.
Extracted features are used to train the neural network, for positive samples (features of blocks consisting barcode region) neural network is trained by 1 and for negative samples (features of blocks consisting non-barcode region) it is trained by 0. So, that this trained neural network will give the value close to target output 1 for image region that contains barcode region and for other it will give the value close to target output 0.
Stage 4: Localization of barcode region
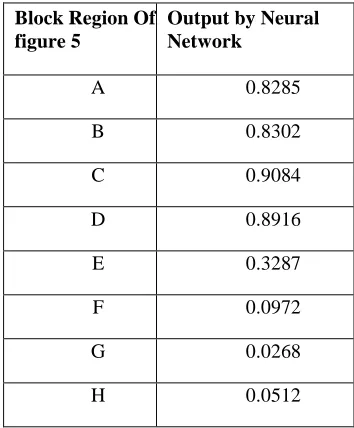
After training of neural network, some barcode images are tested for performance evaluation of neural network. For example result value obtained by neural network for the image blocks shown in figure 5 of the barcode image shown in figure 4 is given in Table 2:
Table 2: Output value of the block regions presented in figure 5 by trained Neural Network.
Block Region Of figure 5
Output by Neural Network
A 0.8285
B 0.8302
C 0.9084
D 0.8916
E 0.3287
F 0.0972
G 0.0268
H 0.0512
After obtaining output value for the whole image blocks from trained neural network with statistical features, the image is converted into binary image.
(a) (b)
Fig. 6. Extracted bar code region from input image. (a) input image (b) extracted barcode region.
Step 5: Segmentation of barcode region
After that thresholding process is applied to the image blokes, for this 0 is multiplied with block values for which neural network gives the output value less than 0.7 and other blokes will remained as it is. Then bounding box is formed for segmentation of barcode region.
6. RESULTS and PERFORMANCE EVALUATION
[image:4.595.315.564.367.471.2]For the experiment a dataset [13] of 2d barcode images is used. To evalute the performance 30 barcode images from dataset is selected. We also evalute performance for blure images. Gaussian blur is introduced with standard deviation in range 0.1 to 0.6 in selected barcode images.The final result is concluded in the table 3 and table 4.
Table 3: Segmentation results using neural network for selected samples
Images Barcode without blur
Barcodes with noise
Deformed Barcodes
Segmentation
[image:4.595.309.566.716.793.2]437 For the 30 images without blur, our method can detect
[image:5.595.35.282.176.256.2]almost all of them with the detection rate 96.66%, and detecion rate is 90% for the images with noise. For the 10 images with deformed barcode, our method also did very well, with detection rate achieving 80%.
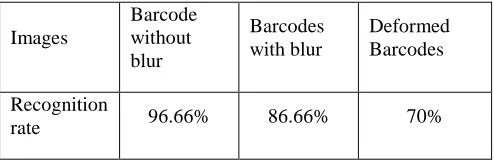
Table 4: Recognition results using neural for selected samples.
Images
Barcode without blur
Barcodes with blur
Deformed Barcodes
Recognition
rate 96.66% 86.66% 70%
For the decoding of the barcodes, open source library ZX-ing [14] is used. AccordZX-ing to ZXZX-ing decoder recognition rate of selected barcode samples is caculated as shown in Table 4. For the 30 images without noise, except for the detection failure, Zxing library can decode correctly all of them. For the images withblur 86.66% recognition rate is achived. Recorded recognition rate for the detected deformed barcode images is 70%.
7. CONCLUSION
This research work has presented recognition techniques for 2D QR barcode images The proposed method based on the feature extraction and neural network. This extract the stastical features such as mean, standard deviation, smoothness, skewness, energy and entropy of image at block level and test these feature values with trained neural network to identify barcode region. Based on the results of neural network barcode region is segmented and then applied to Zxing decoder for decoding. Generated results are satisfactory which can be improved in future if we use the wavelet and curvelet feature extraction technique.
REFERENCES
[1] Zelkowitz, Marvin, ed. Advances in Computers. Vol. 56. Access Online via Elsevier, 2002.
[2] Kato, Perth and Tan, "Pervasive 2D Barcodes for Camera Phone Applications", in IEEE Pervasive Computing: Mobile and Ubiquitous Systems, 2007, ©IEEE doi: 10.1109/MPRV.2007.80.
[3] URL: http://www.nationwidebarcode.com.
[4] Kuroki, Yoneoka, Satou and Takagi, "Bar-code recognition system using image processing", in Emerging Technologies and Factory Automation Proceedings, 1997 6th International Conference, Los Angeles, ©IEEE doi:10.1109/ETFA.1997.616333. [5] Johann C.,Rocholl, J.C., Klenk and Heidemann,
"Robust 1D Barcode Recognition on Mobile Devices", in Pattern Recognition (ICPR), 2010 20th International Conference, Istanbul , ©IEEE doi:10.1109/ICPR.2010.664 .
[6] Liu, Zhi, Lingna He, and Ronghua Liang., " Research on Segmentation Algorithm of 2D Color Barcode Based on Mobile Phone.", in 2010 3rd International Conference on Computer and Electrical Engineering
(ICCEE 2010) IPCSIT vol. 53 (2012), Singapore, doi: 10.7763/IPCSIT.2012. V53.No.1.1
[7] Meng Wang, Anan Liu, Zhaoxuan Yang and Feng Liu “Robust and Fast Localization Algorithm for Data Matrix Barcode” in Optoelectronics and Image Processing (ICOIP), 2010 International Conference, ©IEEE doi: 10.1109/ICOIP.2010.299.
[8] Huijuan Yang and Xudong Jiang, ”Accurate Localization of Four Extreme Corners For Barcode Images Captured by Mobile Phones”, in Image Processing (ICIP), 2010 17th IEEE International Conference, ©IEEE doi: 10.1109/ICIP.2010.5651603. [9] Priyanka Gaur, Shamik Tiwari, "Recognition of 2D
Barcode Images Using Edge Detection and Morphological Operation ", in International Journal of Computer Science and Mobile Computing, April- 2014.
[10] Tiwari, S., Shukla, V. P., Biradar, S., & Singh, A. ,”Texture Features based Blur Classification in Barcode Images”, in International Journal of Information Engineering & Electronic Business, 2013.
[11] https://courses.cs.washington.edu
[12] Haykin, Simon. Neural networks: a comprehensive foundation. Prentice Hall PTR, 1994.
[13] Szentandrási, István, Adam Herout, and Markéta Dubská. "Fast detection and recognition of QR codes in high-resolution images.", Proceedings of the 28th Spring Conference on Computer Graphics. ACM, 2012.
[14] S. Owen, “Zxing (“Zebra Crossing”),” 2013, https://code .google.com/p/zxing/.