Spotting the ‘Odd-one-out’: Data-Driven Error Detection and Correction
in Textual Databases
Caroline Sporleder, Marieke van Erp, Tijn Porcelijn and Antal van den Bosch ILK / Language and Information Science
Tilburg University, P.O. Box 90153, 5000 LE Tilburg, The Netherlands
{C.Sporleder,M.G.J.vanErp,M.Porcelijn,Antal.vdnBosch}@uvt.nl
Abstract
We present two methods for semi-automatic detection and correction of er-rors in textual databases. The first method (horizontal correction) aims at correct-ing inconsistent values within a database record, while the second (vertical correc-tion) focuses on values which were en-tered in the wrong column. Both methods are data-driven and language-independent. We utilise supervised machine learning, but the training data is obtained automat-ically from the database; no manual anno-tation is required. Our experiments show that a significant proportion of errors can be detected by the two methods. Further-more, both methods were found to lead to a precision that is high enough to make semi-automatic error correction feasible.
1 Introduction
Over the last decades, more and more information has become available in digital form; a major part of this information is textual. While some tex-tual information is stored in raw or typeset form (i.e., as more or less flat text), a lot is semi-structured in databases. A popular example of a textual database is Amazon’s book database,1
which contains fields for “author”, “title”, “pub-lisher”, “summary” etc. Information about collec-tions in the cultural heritage domain is also fre-quently stored in (semi-)textual databases. Exam-ples of publicly accessible databases of this type are the University of St. Andrews’s photographic
1http://www.amazon.com
collection2or the Nederlands Soortenregister.3 Such databases are an important resource for researchers in the field, especially if the contents can be systematically searched and queried. How-ever, information retrieval from databases can be adversely affected by errors and inconsistencies in the data. For example, a zoologist interested in finding out about the different biotopes (i.e., habi-tats) in which a given species was found, might query a zoological specimens database for the con-tent of the BIOTOPE column for all specimens
of that species. Whenever information about the biotope was entered in the wrong column, that par-ticular record will not be retrieved by such a query. Similarly, if an entry erroneously lists the wrong species, it will also not be retrieved.
Usually it is impossible to avoid errors com-pletely, even in well maintained databases. Errors can arise for a variety of reasons, ranging from technical limitations (e.g., copy-and-paste errors) to different interpretations of what type of infor-mation should be entered into different database fields. The latter situation is especially preva-lent if the database is maintained by several peo-ple. Manual identification and correction of er-rors is frequently infeasible due to the size of the database. A more realistic approach would be to use automatic means to identify potential errors; these could then be flagged and presented to a hu-man expert, and subsequently corrected hu-manually or semi-automatically. Error detection and correc-tion can be performed as a pre-processing step for information extraction from databases, or it can be interleaved with it.
In this paper, we explore whether it is
possi-2http://special.st-andrews.ac.uk/
saspecial/
ble to detect and correct potential errors in tex-tual databases by applying data-driven clean-up methods which are able to work in the absence of background knowledge (e.g., knowledge about the domain or the structure of the database) and instead rely on the data itself to discover inconsis-tencies and errors. Ideally, error detection should also be language independent, i.e., require no or few language specific tools, such as part-of-speech taggers or chunkers. Aiming for language in-dependence is motivated by the observation that many databases, especially in the cultural heritage domain, are multi-lingual and contain strings of text in various languages. If textual data-cleaning methods are to be useful for such databases, they should ideally be able to process all text strings, not only those in the majority language.
While there has been a significant amount of previous research on identifying and correcting er-rors in data sets, most methods are not particularly suitable for textual databases (see Section 2). We present two methods which are. Both methods are data-driven and knowledge-lean; errors are iden-tified through comparisons with other database fields. We utilise supervised machine learning, but the training data is derived directly from the database, i.e., no manual annotation of data is nec-essary. In the first method, the database fields of individual entries are compared, and improbable combinations are flagged as potential errors. Be-cause the focus is on individual entries, i.e.,rows
in the database, we call thishorizontal error cor-rection. The second method aims at a different type of error, namely values which were entered in the wrong column of the database. Potential errors of this type are determined by comparing the content of a database cell to (the cells of) all database columns and determining which column it fits best. Because the focus is on columns, we refer to this method asvertical error correction.
2 Related Work
There is a considerable body of previous work on the generic issue of data cleaning. Much of the research directed specifically at databases focuses on identifying identical records when two databases are merged (Hern´andez and Stolfo, 1998; Galhardas et al., 1999). This is a non-trivial problem as records of the same objects coming from different sources typically differ in their pri-mary keys. There may also be subtle differences
in other database fields. For example, names may be entered in different formats (e.g., John Smith
vs.Smith, J.) or there may be typos which make it difficult to match fields (e.g.,John Smith vs.Jon Smith).4
In a wider context, a lot of research has been dedicated to the identification of outliers in datasets. Various strategies have been proposed. The earliest work uses probability distributions to model the data; all instances which deviate too much from the distributions are flagged as out-liers (Hawkins, 1980). This approach is called
distribution-based. In clustering-based methods, a clustering algorithm is applied to the data and instances which cannot be grouped under any clus-ter, or clusters which only contain very few in-stances are assumed to be outliers (e.g., Jiang et al. (2001)). Depth-basedmethods (e.g., Ruts and Rousseeuw (1996)) use some definition of depth to organise instances in layers in the data space; outliers are assumed to occupy shallow layers.
Distance-based methods (Knorr and Ng, 1998) utilise ak-nearest neighbour approach where out-liers are defined, for example, as those instances whose distance to their nearest neighbour exceeds a certain threshold. Finally, Marcus and Maletic (2000) propose a method which learns association rules for the data; records that do not conform to any rules are then assumed to be potential outliers.
In principle, techniques developed to detect out-liers can be applied to databases as well, for in-stance to identify cell values that are exceptional in the context of other values in a given column, or to identify database entries that seem unlikely com-pared to other entries. However, most methods are not particularly suited for textual databases. Some approaches only work with numeric data (e.g., distribution-based methods), others can deal with categorical data (e.g., distance-based meth-ods) but treat all database fields as atoms. For databases with free text fields it can be fruitful to look at individual tokens within a text string. For instance, units of measurement (m,ft, etc.) may be very common in one column (such asALTITUDE) but may indicate an error when they occur in an-other column (such asCOLLECTOR).
4
3 Data
We tested our error correction methods on a database containing information about animal specimens collected by researchers at Naturalis, the Dutch Natural History Museum.5 The
database contains 16,870 entries and 35 columns. Each entry provides information about one or sev-eral specimens, for example, who collected it, where and when it was found, its position in the zoological taxonomy, the publication which first described and classified the specimen, and so on. Some columns contain fairly free text (e.g., SPE
-CIAL REMARKS), others contain textual content6 of a specific type and in a relatively fixed format, such as proper names (e.g., COLLECTOR or LO
-CATION), bibliographical information (PUBLICA
-TION), dates (e.g., COLLECTION DATE) or
num-bers (e.g.,REGISTRATION NUMBER).
Some database cells are left unfilled; just un-der 40% of all cells are filled (i.e., 229,430 cells). There is a relatively large variance in the number of different values in each column, ranging from three for CLASS (i.e., Reptilia, Amphibia, and a remark pointing to a taxonomic inconsistency in the entry) to over 2,000 for SPECIAL REMARKS,
which is only filled for a minority of the entries. On the other hand there is also some repetition of cell contents, even for the free text columns, which often contain formulaic expressions. For example, the strings no further data available or
(found) dead on roadoccur repeatedly in the spe-cial remarks field. A certain amount of repetition is characteristic for many textual databases, and we exploit this in our error correction methods.
While most of the entries are in Dutch or En-glish, the database also contains text strings in sev-eral other languages, such as Portuguese or French (and Latin for the taxonomic names). In principle, there is no limit to which languages can occur in the database. For example, thePUBLICATION col-umn often contains text strings (e.g., the title of the publication) in languages other than Dutch or English.
4 Horizontal Error Correction
The different fields in a database are often not statistically independent; i.e., for a given entry,
5http://www.naturalis.nl 6
We use the termtextual contentin the widest possible sense, i.e., comprising all character strings, including dates and numbers.
the likelihood of a particular value in one field may be dependent on the values in (some of) the other fields. In our database, for example, there is an interdependency between theLOCATIONand the COUNTRY columns: the probability that the COUNTRYcolumn contains the valueSouth Africa
increases if the LOCATION column contains the string Tafel Mountain (and vice versa). Similar interdependencies hold between other columns, such as LOCATIONand ALTITUDE, or COUNTRY
and BIOTOPE, or between the columns encoding a specimen’s position in the zoological taxonomy (e.g., SPECIESandFAMILY). Given enough data, many of these interdependencies can be deter-mined automatically and exploited to identify field values that are likely to be erroneous.
This idea bears some similarity to the approach by Marcus and Maletic (2000) who infer associ-ation rules for a data set and then look for out-liers relative to these rules. However, we do not explicitly infer rules. Instead, we trained TiMBL (Daelemans et al., 2004), a memory-based learner, to predict the value of a field given the values of other fields for the entry. If the predicted value differs from the original value, it is signalled as a potential error to a human annotator.
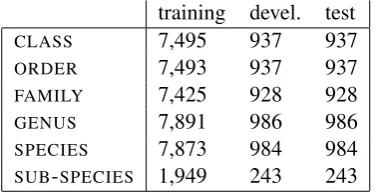
We applied the method to the taxonomic fields (CLASS, ORDER, FAMILY, GENUS, SPECIES and SUB-SPECIES), because it is possible, albeit some-what time-consuming, for a non-expert to check the values of these fields against a published zoo-logical taxonomy. We split the data into 80% train-ing set, 10% development set and 10% test set. As not all taxonomic fields are filled for all entries, the exact sizes for each data set differ, depending on which field is to be predicted (see Table 1).
num-ber of potential errors that get flagged (i.e., dis-agreements between TiMBL and the database) and thus, hopefully, lead to a higher error detection precision, i.e., less work for the human annotator who has to check the potential errors.
training devel. test
CLASS 7,495 937 937
ORDER 7,493 937 937
FAMILY 7,425 928 928
GENUS 7,891 986 986
SPECIES 7,873 984 984
SUB-SPECIES 1,949 243 243
Table 1: Data set sizes for taxonomic fields
We also used the development data to perform some feature selection. We compared (i) using the values of all other fields (for a given entry) as features and (ii) only using the other taxonomic fields plus the author field, which encodes which taxonomist first described the species to which a given specimen belongs.7 The reduced feature set was found to lead to better or equal performance for all taxonomic fields and was thus used in the experiments reported below.
For each taxonomic field, we then trained TiMBL on the training set and applied it to the test set, using the optimised parameter settings. Table 2 shows the value prediction accuracies for each taxonomic field and the accuracies achieved by two baseline classifiers: (i) randomly select-ing a value from the values found in the trainselect-ing set (random) and (ii) always predicting the (train-ing set) majority value (majority). The predic-tion accuracies are relatively high, even for the lowest fields in the taxonomy, SPECIESandSUB
-SPECIES, which should be the most difficult to pre-dict. Hence it is in principle possible to predict the value of a taxonomic field from the values of other fields in the database. To determine whether the taxonomic fields are exceptional in this respect, we also tested how well non-taxonomic fields can be predicted. We found that all fields can be pre-dicted with a relatively high accuracy. The low-est accuracy (63%) is obtained for the BIOTOPE
field. For most fields, accuracies of around 70%
7
The author information provides useful cues for the pre-diction of taxonomic fields because taxonomists often spe-cialise on a particular zoological group. For example, a tax-onomist who specialises on Ranidae(frogs) is unlikely to have published a description of a species belonging to Ser-pentes(snakes).
are achieved; this applies even to the “free text” fields likeSPECIAL REMARKS.
TiMBL random majority
CLASS 99.87% 50.00% 54.98%
ORDER 98.29% 1.92% 18.59%
FAMILY 98.02% 0.35% 10.13% GENUS 92.57% 10.00% 44.76% SPECIES 89.93% 0.20% 7.67%
SUB-SPECIES 95.03% 0.98% 21.35%
Table 2: Test set prediction accuracies for taxo-nomic field values (horizontal method)
To determine whether this method is suitable for semi-automatic error correction, we looked at the cases in which the value predicted by TiMBL differed from the original value. There are three potential reasons for such a disagreement: (i) the value predicted by TiMBL is wrong, (ii) the value predicted by TiMBL is correct and the original value in the database is wrong, and (iii) both val-ues are correct and the two terms are (zoological) synonyms. For the fields CLASS, ORDER, FAM
-ILY andGENUS, we checked the values predicted by TiMBL against two published zoological tax-onomies8 and counted how many times the pre-dicted value was the correct value. We did not check the two lowest fields (SUB SPECIES and SPECIES), as the correct values for these fields can only be determined reliably by looking at the spec-imens themselves, not by looking at the other tax-onomic values for an entry. For the evaluation, we focused on errorcorrectionrather than error detec-tion, hence cases where both the value predicted by TiMBL and the original value in the database were wrong, were counted as TiMBL errors.
Table 3 shows the results (the absolute numbers of database errors, synonyms and TiMBL errors are shown in brackets). It can be seen that TiMBL detects several errors in the database and predicts the correct values for them. It also finds several synonyms. For GENUS, however, the vast
ma-jority of disagreements between TiMBL and the database is due to TiMBL errors. This can be ex-plained by the fact that GENUS is relatively low
in the taxonomy (directly aboveSPECIES). As the values of higher fields only provide limited cues
8
disagreements database errors synonyms TiMBL errors
CLASS 2 50.00% (1) 0% (0) 50.00% (1)
ORDER 26 38.00% (10) 19.00% (5) 43.00% (11)
FAMILY 33 9.09% (3) 36.36% (12) 54.55% (18)
GENUS 135 5.93% (8) 4.44% (6) 89.63% (121)
Table 3: Error correction precision (horizontal method)
for the value of a lower field, the lower a field is in the taxonomy the more difficult it is to predict its value accurately.
So far we have only looked at the precision
of our error detection method (i.e., what propor-tion of flagged errors are real errors). Error de-tection recall (i.e., the proportion of real errors that is flagged) is often difficult to determine pre-cisely because this would involve manually check-ing the dataset (or a significant subset) for errors, which is typically quite time-consuming. How-ever, if errors are identified and corrected semi-automatically, recall is more important than pre-cision; a low precision means more work for the human expert who is checking the potential errors, a low recall, however, means that many errors are not detected at all, which may severely limit the usefulness of the system.
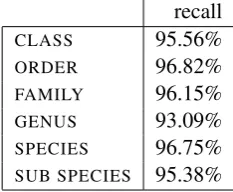
To estimate the recall obtained by the horizontal error detection method, we introduced errors arti-ficially and determined what percentage of these artificial errors was detected. For each taxonomic field, we changed the value of 10% of the entries, which were randomly selected. In these entries, the original values were replaced by one of the other attested values for this field. The new value was selected randomly and with uniform probabil-ity for all values. Of course, this method can only provide an estimate of the true recall, as it is possi-ble that real errors are distributed differently, e.g., some values may be more easily confused by hu-mans than others. Table 4 shows the results. The estimated recall is fairly high; in all cases above 90%. This suggests that a significant proportion of the errors is detected by our method.
5 Vertical Error Correction
While the horizontal method described in the pre-vious section aimed at correcting values which are inconsistent with the remaining fields of a database entry, vertical error correction is aimed at a different type of error, namely, text strings which were entered in the wrong column of the
recall
CLASS 95.56%
ORDER 96.82%
FAMILY 96.15%
GENUS 93.09%
SPECIES 96.75% SUB SPECIES 95.38%
Table 4: Recall for artificially introduced errors (horizontal method)
database. For example, in our database, informa-tion about the biotope in which a specimen was found may have been entered in theSPECIAL RE -MARKScolumn rather than the BIOTOPEcolumn.
Errors of this type are quite frequent. They can be accidental, i.e., the person entering the infor-mation inadvertently chose the wrong column, but they can also be due to misinterpretation, e.g., the person entering the information may believe that it fits theSPECIAL REMARKScolumn better than the BIOTOPEcolumn or they may not know that there is a BIOTOPE column. Some of these errors may also stem from changes in the database structure itself, e.g., maybe theBIOTOPE column was only added after the data was entered.9
Identifying this type of error can be recast as a text classification task: given the content of a cell, i.e., a string of text, the aim is to determine which column the string most likely belongs to. Text strings which are classified as belonging to a dif-ferent column than they are currently in, represent a potential error. Recasting error detection as a text classification problem allows the use of super-vised machine learning methods, as training data (i.e., text strings labelled with the column they be-long to) can easily be obtained from the database. We tokenised the text strings in all database fields10 and labelled them with the column they
9
Many databases, especially in the cultural heritage do-main, are not designed and maintained by database experts. Over time, such database are likely to evolve and change structurally. In our specimens database, for example, several columns were only added at later stages.
10
occur in. Each string was represented as a vec-tor of 48 features, encoding the (i) string itself and some of its typographical properties (13 features), and (ii) its similarity with each of the 35 columns (in terms of weighted token overlap) (35 features). The typographical properties we encoded were: the number of tokens in the string and whether it contained an initial (i.e., an individual capitalised letter), a number, a unit of measurement (e.g.,km), punctuation, an abbreviation, a word (as opposed to only numbers, punctuation etc.), a capitalised word, a non-capitalised word, a short word (<4 characters), a long word, or a complex word (e.g., containing a hyphen).
The similarity between a string, consisting of a set T of tokens t1. . . tn, and a column colx was defined as:
sim(T, colx) =
Pn
i=1ti×tf idfti,colx
|T|
where tf idfticolx is the tfidf weight (term fre-quency - inverse document frefre-quency, cf. (Sparck-Jones, 1972)) of token ti in column colx. This weight encodes how representative a token is of a column. The term frequency,tfti,colx, of a token tiin columncolx is the number of occurrences of
ti in colx divided by the number of occurrences of all tokens in colx. The term frequency is 0 if the token does not occur in the column. The in-verse document frequency, idfti, of a token ti is
the number of all columns in the database divided by the number of columns containingti. Finally, the tfidf weight for a termtiin columncolxis de-fined as:
tf idfti,colx =tfti,colx log idfti
A high tfidf weight for a given token in a given column means that the token frequently occurs in that column but rarely in other columns, thus the token is a good indicator for that column. Typ-ically tfidf weights are only calculated for con-tent words, however we calculated them for all tokens, partly because the use of stop word lists to filter out function words would have jeopar-dised the language independence of our method and partly because function words and even punc-tuation can be very useful for distinguishing dif-ferent columns. For example, prepositions such as
underoften indicateBIOTOPE, as inunder a stone.
Sabine Buchholz. The inclusion of multi-lingual abbrevi-ations in the rule set ensures that this tokeniser is robust enough to also cope with text strings in English and other Western European languages.
To assign a text string to one of the 35 database columns, we trained TiMBL (Daelemans et al., 2004) on the feature vectors of all other database cells labelled with the column they belong to.11 Cases where the predicted column differed from the current column of the string were recorded as potential errors.
We applied the classifier to all filled database cells. For each of the strings identified as potential errors, we checked manually (i) whether this was a real error (i.e., errordetection) and (ii) whether the column predicted by the classifier was the cor-rect one (i.e., error correction). While checking for this type of error is much faster than checking for errors in the taxonomic fields, it is sometimes difficult to tell whether a flagged error is a real er-ror. In some cases it is not obvious which col-umn a string belongs to, for example because two columns are very similar in content (such asLO
-CATION andFINDING PLACE), in other cases the content of a database field contains several pieces of information which would best be located in dif-ferent columns. For instance, the stringfound with broken neck near Karlobagarguably could be split between the SPECIAL REMARKS and the LOCA
-TION columns. We were conservative in the first case, i.e., we did not count an error as correctly identified if the string could belong to the origi-nal column, but we gave the algorithm credit for flagging potential errors where part of the string should be in a different column.
The results are shown in the second column ( un-filtered) in Table 5. The classifier found 836 poten-tial errors, 148 of these were found to be real er-rors. For 100 of the correctly identified errors the predicted column was the correct column. Some of the corrected errors can be found in Table 6. Note that the system corrected errors in both En-glish and Dutch text strings without requiring lan-guage identification or any lanlan-guage-specific re-sources (apart from tokenisation).
We also calculated the precision of error detec-tion (i.e., the number of real errors divided by the number of flagged errors) and the error correction accuracy (i.e., the number of correctly corrected errors divided by the number correctly identified errors). The error detection precision is relatively low (17.70%). In general a low precision means relatively more work for the human expert
check-11
string original column corrected column op boom ongeveer 2,5 m boven grond SPECIAL REMARKS BIOTOPE (on a tree about 2.5 m above ground)
25 km N.N.W Antalya SPECIAL REMARKS LOCATION
1700 M BIOTOPE ALTITUDE
gestorven in gevangenschap 23 september 1994 LOCATION SPECIAL REMARKS (died in captivity 23 September 1994)
roadside bordering secondary forest LOCATION BIOTOPE
Suriname Exp. 1970 COLLECTION NUMBER COLLECTOR (Surinam Expedition 1970)
Table 6: Examples of automatically corrected errors (vertical method)
unfiltered filtered
flagged errors 836 262
real errors 148 67
correctly corrected 100 54 precision error detection 17.70 % 25.57% accuracy error correction 67.57% 80.60%
Table 5: Results automatic error detection and cor-rection for all database fields (vertical method)
ing the flagged errors. However, note that the sys-tem considerably reduces the number of database fields that have to be checked (i.e., 836 out of 229,430 filled fields). We also found that, for this type of error, error checking can be done relatively quickly even by a non-expert; checking the 836 er-rors took less than 30 minutes. Furthermore, the correction accuracy is fairly high (67.57%), i.e., for most of the correctly identified errors the cor-rect column is suggested. This means that for most errors the user can simply choose the column sug-gested by the classifier.
In an attempt to increase the detection preci-sion we applied two filters and only flagged errors which passed these filters. First, we filtered out potential errors if the original and the predicted column were of a similar type (e.g., if both con-tained person names or dates) as we noticed that our method was very prone to misclassifications in these cases.12 For example, if the name M.S. Hoogmoed occurs several times in the COLLEC
-TORcolumn and a few times in theDONATOR
col-umn, the latter cases are flagged by the system as potential errors. However, it is entirely normal for a person to occur in both theCOLLECTORand the DONATORcolumn. What is more, it is impossible
12
Note, that this filter requires a (very limited) amount of background knowledge, i.e. knowledge about which columns are of a similar type.
to determine on the basis of the text string M.S. Hoogmoedalone, whether the correct column for this string in a given entry isDONATOR or COL
-LECTORor both.13 Secondly, we only flagged
er-rors where the predicted column was empty for the current database entry. If the predicted column is already occupied, the string is unlikely to belong to that column (unless the string in that column is also an error). The third column in Table 5 ( fil-tered) shows the results. It can be seen that de-tection precision increases to 25.57% and correc-tion precision to 80.60%, however the system also finds noticeably fewer errors (67 vs. 148).
Prec. Rec.
BIOTOPE 20.09% 94.00%
PUBLICATION 6.90% 100.00%
SPECIAL REMARKS 16.11% 24.00%
Table 7: Precision and Recall for three free text columns (vertical method)
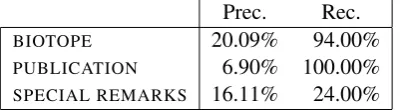
Estimating the error detection recall (i.e., the number of identified errors divided by the over-all number of errors in the database) would in-volve manually identifying all the errors in the database. This was not feasible for the database as a whole. Instead we manually checked three of the free text columns, namely,BIOTOPE,PUB
-LICATIONandSPECIAL REMARKS, for errors and
calculated the recall and precision for these. Ta-ble 7 shows the results. For BIOTOPE andPUB
-LICATION the recall is relatively high (94% and
100%, respectively), forSPECIAL REMARKSit is
much lower (24%). The low recall for SPECIAL REMARKSis probably due to the fact that this
col-13
umn is very heterogeneous, thus it is fairly difficult to find the true errors in it. While the precision is relatively low for all three columns, the number of flagged errors (ranging from 58 for PUBLICA
-TIONto 298 forSPECIAL REMARKS) is still small
enough for manual checking.
6 Conclusion
We have presented two methods for (semi-)automatic error detection and correc-tion in textual databases. The two methods are aimed at different types of errors: horizontal error correction attempts to identify and correct inconsistent values within a database record;
vertical error correctionis aimed at values which were accidentally entered in the wrong column. Both methods are data-driven and require little or no background knowledge. The methods are also language-independent and can be applied to multi-lingual databases. While we utilise super-vised machine learning, no manual annotation of training data is required, as the training set is obtained directly from the database.
We tested the two methods on an animal spec-imens database and found that a significant pro-portion of errors could be detected: up to 97% for horizontal error detection and up to 100% for ver-tical error detection. While the error detection pre-cision was fairly low for both methods (up to 55% for the horizontal method and up to 25.57% for the vertical method), the number of potential errors flagged was still sufficiently small to check manu-ally. Furthermore, the automatically predicted cor-rection for an error was often the right one. Hence, it would be feasible to employ the two methods in a semi-automatic error correction set-up where po-tential errors together with a suggested correction are flagged and presented to a user.
As the two error correction methods are to some extent complementary, it would be worthwhile to investigate whether they can be combined. Some errors flagged by the horizontal method will not be detected by the vertical method, for instance, val-ues which are valid in a given column, but incon-sistent with the values of other fields. On the other hand, values which were entered in the wrong col-umn should, in theory, also be detected by the hor-izontal method. For example, if the correct FAM
-ILY for Rana aurora is Ranidae, it should make no difference whether the (incorrect) value in the
FAMILYfield isBufonidae, which is a valid value
forFAMILYbut the wrong family forRana aurora, orAmphibia, which is not a valid value for FAM -ILYbut the correctCLASSvalue forRana aurora; in both cases the error should be detected. Hence, if both methods predict an error in a given field this should increase the likelihood that there is in-deed an error. This could be exploited to obtain a higher precision. We plan to experiment with this idea in future research.
Acknowledgments The research reported in this paper was funded by NWO (Netherlands Or-ganisation for Scientific Research) and carried out at the Naturalis Research Labs in Leiden. We would like to thank Pim Arntzen and Erik van Nieukerken from Naturalis for guidance and help-ful discussions. We are also gratehelp-ful to two anony-mous reviewers for useful comments.
References
A. Bagga. 1998.Coreference, Cross-Document Coref-erence, and Information Extraction Methodologies. Ph.D. thesis, Dept. of Computer Science, Duke Uni-versity.
W. Daelemans, J. Zavrel, K. van der Sloot, A. van den Bosch, 2004. TiMBL: Tilburg Memory Based Learner, version 5.1, Reference Guide, 2004. ILK Research Group Technical Report Series no. 04-02. H. Galhardas, D. Florescu, D. Shasha, E. Simon. 1999.
An extensible framework for data cleaning. Tech-nical Report RR-3742, INRIA TechTech-nical Report, 1999.
D. M. Hawkins. 1980. Identification of outliers. Chap-man and Hall, London.
M. A. Hern´andez, S. J. Stolfo. 1998. Real-world data is dirty: Data cleansing and the merge/purge prob-lem. Journal of Data Mining and Knowledge Dis-covery, 2:1–31.
M.-F. Jiang, S.-S. Tseng, C.-M. Su. 2001. Two-phase clustering process for outliers detection. Pattern Recognition Letters, 22:691–700.
E. M. Knorr, R. T. Ng. 1998. Algorithms for min-ing distance-based outliers in large datasets. In Pro-ceedings of the 24th International Conference on Very Large Data Bases (VLDB’98).
A. Marcus, J. I. Maletic. 2000. Utilizing association rules for identification of possible errors in data sets. Technical Report TR-CS-00-04, The University of Memphis, Division of Computer Science, 2000. I. Ruts, P. J. Rousseeuw. 1996. Computing depth
contours of bivariate point clouds. Computational Statistics and Data Analysis, 23:153–168.
K. Sparck-Jones. 1972. A statistical interpretation of term specificity and its application in retrieval. Jour-nal of Documentation, 28:11–21.