Mining Tables from Large Scale HTML Texts
Hsin-Hsi Chen, Shih-Chung Tsai and Jin-He Tsai
Department of Computer Science and Information Engineering National Taiwan University
Taipei, TAIWAN, R.O.C. E-mail: [email protected]
Abstract
Table is a very common presentation scheme, but few papers touch on table extraction in text data mining. This paper focuses on mining tables from large-scale HTML texts. Table filtering, recognition, interpretation, and presentation are discussed. Heuristic rules and cell similarities are employed to identify tables. The F-measure of table recognition is 86.50%. We also propose an algorithm to capture attribute-value relationships among table cells. Finally, more structured data is extracted and presented.
Introduction
Tables, which are simple and easy to use, are very common presentation scheme for writers to describe schedules, organize statistical data, summarize experimental results, and so on, in texts of different domains. Because tables provide rich information, table acquisition is useful for many applications such as document understanding, question-and-answering, text retrieval, etc. However, most of previous approaches on text data mining focus on text parts, and only few touch on tabular ones (Appelt and Israel, 1997; Gaizauskas and Wilks, 1998; Hurst, 1999a). Of the papers on table extractions (Douglas, Hurst and Quinn, 1995; Douglas and Hurst 1996; Hurst and Douglas, 1997; Ng, Lim and Koo, 1999), plain texts are their targets.
In plain text, writers often use special symbols, e.g., tabs, blanks, dashes, etc., to make tables. The following shows an example. It depicts book titles, authors, and prices.
title author price
Statistical Language Learning E.Charniak $30 Cross-Language Information Retrieval G. Grefenstette $115 Natural Language Information Retrieval T.Strzalkowski $144
When detecting if there is a table in free text, we should disambiguate the uses of the special symbols. That is, the special symbol may be a separator or content of cells. Previous papers employ grammars (Green and Krishnamoorthy, 1995), string-based cohesion measures (Hurst and Douglas, 1997), and learning methods (Ng, Lim and Koo, 1999) to deal with table recognition.
Because of the simplicity of table construction methods in free text, the expressive capability is limited. Comparatively, the markup languages like HTML provide very flexible constructs for writers to design tables. The flexibility also shows that table extraction in HTML texts is harder than that in plain text. Because the HTML texts are huge on the web, and they are important sources of knowledge, it is indispensable to deal with table mining on HTML texts. Hurst (1999b) is the first attempt to collect a corpus from HTML files, LATEX
files and a small number of ASCII files for table extraction. This paper focuses on HTML texts. We will discuss not only how to recognize tables from HTML texts, but also how to identify the roles of each cell (attribute and/or value), and how to utilize the extracted tables.
1 Tables in HTML
HTML table begins with an optional caption followed one or more rows. Each row is formed by one or more cells, which are classified into header and data cells. Cells can be merged across rows and columns. The following tags are used:
(1) <table ...> </table> (2) <tr ...> </tr> (3) <td ...> </td> (4) <th ...> </th>
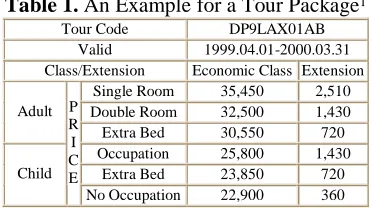
Table 1. An Example for a Tour Package1 Tour Code DP9LAX01AB
Valid 1999.04.01-2000.03.31 Class/Extension Economic Class Extension
Single Room 35,450 2,510 Double Room 32,500 1,430 Adult
Extra Bed 30,550 720 Occupation 25,800 1,430
Extra Bed 23,850 720 Child
P R I C E
No Occupation 22,900 360
They denote main wrapper, table row, table data, table header, and caption for a table. Table 1 shows an example that lists the prices for a tour. The interpretation of this table in terms of attribute-value relationships is shown as follows:
Attribute Value Tour Code DP9LAX01AB
Valid 1999.04.01-2000.03.31 Adult-Price-Single Room-Economic Class 35,450
Adult-Price-Double Room-Economic Class 32,500 Adult-Price-Extra Bed-Economic Class 30,550 Child-Price-Occupation-Economic Class 25,800 Child-Price-Extra Bed-Economic Class 23,850 Child-Price-No Occupation-Economic Class 22,900 Adult-Price-Single Room-Extension 2,510 Adult-Price-Double Room-Extension 1,430 Adult-Price-Extra Bed-Extension 720
Child-Price-Occupation-Extension 1,430 Child-Price-Extra Bed-Extension 720
Child-Price-No Occupation-Extension 360
Cell may play the role of attribute and/or value. Several cells may be concatenated to denote an attribute. For example, "Adult-Price-Single Room-Economic Class" means the adult price for economic class and single room. The relationships may be read in column wise or in row wise depending on the interpretation. For example, the relationship for "Tour Code:DP9LAX01AB" is in row wise. The prices for "Economic Class" are in column wise.
The table wrapper (<table> … </table>) is a useful cue for table recognition. The HTML text for the above example is shown as follows. The table tags are enclosed by a table wrapper.
<table border>
<tr>
<td COLSPAN="3">Tour Code</td>
<td COLSPAN="2">DP9LAX01AB</td>
</tr>
<tr>
<td COLSPAN="3">Valid</td>
<td COLSPAN="2">1999.04.01-2000.03.31</td>
</tr>
<tr>
1 This example is selected from http://www.china-
airlines.com/cdpks/los7-4.htm
<td COLSPAN="3">Class/Extension</td>
<td>Economic Class</td>
<td>Extension</td>
</tr>
<tr>
<td ROWSPAN="3">Adult</td>
<td ROWSPAN="6"><p>P</p>
<p>R</p>
<p>I</p>
<p>C</p>
<p>E</td>
<td>Single Room</td>
<td>35,450</td>
<td>2,510</td>
</tr>
<tr>
<td>Double Room</td>
<td>32,500</td>
<td>1,430</td>
</tr>
<tr>
<td>Extra Bed</td>
<td>30,550</td>
<td>720</td>
</tr>
<tr>
<td>Child</td>
<td>Occupation<</td>
<td>25,800</td>
<td>1,430</td>
</tr>
<tr>
<td>Extra Bed</td>
<td>23,850</td>
<td>720</td>
</tr>
<tr>
<td>No Occupation</td>
<td>22,900</td>
<td>360</td>
</tr>
</table>
However, a table does not always exist when table wrapper appears in HTML text. This is because writers often employ table tags to represent form or menu. That allows users to input queries or make selections.
2 Flow of Table Mining
The flow of table mining is shown as Figure 1. It is composed of five modules. Hypertext processing module analyses HTML text, and extracts the table tags. Table filtering module filters out impossible cases by heuristic rules. The remaining candidates are sent to table recognition module for further analyses. The table interpretation module differentiates the roles of cells in the tables. The final module tackles how to present and employ the mining results. The first two modules are discussed in the following paragraph, and the last three modules will be dealt with in the following sections in detail.
Figure 1. Flow of Table Mining
As specified above, table wrappers do not always introduce tables. Two filtering rules are employed to disambiguate their functions:
(1) A table must contain at least two cells to represent attribute and value. In other words, the structure with only one cell is filtered out.
(2) If the content enclosed by table wrappers contain too much hyperlinks, forms and figures, then it is not regarded as a table.
To evaluate the performance of table mining, we prepare the test data selected from airline information in travelling category of Chinese Yahoo web site (http://www.yahoo.com. tw). Table 2 shows the statistics of our test data.
Table 2. Statistics of Test Data Airlines China
Airline Eva Airline
Mandarin Airline
Singapore Airline
Fareast Airline
Sum
Number of Pages
694 366 142 110 60 1372
# of Wrappers
2075 568 184 163 228 3218 (2.35) Number of
Tables
751 98 23 40 6 918 (0.67)
Table 3. Performance of Filtering Rules China
Airline Eva Airline
Mandarin Airline
Singapore Airline
Fareast Airline
Sum
# of wrappers
2075 568 184 163 228 3218
Number of Tables
751 98 23 40 6 918
Number of Non-Tables
1324 470 161 123 222 2300
Total Filter
973 455 158 78 213 1877
Wrong Filter
15 0 0 3 2 20
Correct Rate
98.46% 100% 100% 96.15% 99.06% 98.93%
These four rows list the names of airlines, total number of web pages, total number of table wrappers, and total number of tables, respectively. On the average, there are 2.35 table wrappers, and 0.67 tables for each web page. The statistics shows that table tags are used quite often in HTML text, and only 28.53% are actual tables. Table 3 shows the results after we employ the filtering rules on the test data. The 5th row shows how many non-table candidates are filtered out by the proposed rules, and the 6th row shows the number of wrong filters. On the average, the correct rate is 98.93%. Total 423 of 2300 non-tables are remained.
3 Table Recognition
After simple analyses specified in the previous section, there are still 423 non-tables passing the filtering criteria. Now we consider the content of the cells. A cell is much shorter than a sentence in plain text. In our study, the length of 43,591 cells (of 61,770 cells) is smaller than 10 characters2. Because of the space
limitation in a table, writers often use shorthand notations to describe their intention. For
2 A Chinese character is represented by two bytes.
That is, a cell contains 5 Chinese characters on the average.
presentation of results table
interpretation
hypertext processing
table filtering table
example, they may use a Chinese character ("", dao4) to represent a two-character word "i" (dao4da2, arrive), and a character ("}", li2) to denote the Chinese word "}É" (li2kai1, leave). They even employ special symbols like > and
G to represent "increase" and "decrease".
Thus it is hard to determine if a fragment of HTML text is a table depending on a cell only. The context among cells is important.
Value cells under the same attribute names demonstrate similar concepts. We employ the following metrics to measure the cell similarity.
(1) String similarity
We measure how many characters are common in neighboring cells. If the number is above a threshold, we call the two cells are similar.
(2) Named entity similarity
The metric considers semantics of cells. We adopt some named entity expressions defined in MUC (1998) such as date/time expressions and monetary and percentage expressions. A rule-based method similar to the paper (Chen, Ding, and Tsai, 1998) is employed to tell if a cell is a specific named entity. The neighboring cells belonging to the same named entity category are similar.
(3) Number category similarity
Number characters (0-9) appear very often. If total number characters in a cell exceeds a threshold, we call the cell belongs to the number category. The neighboring cells in number category are similar.
We count how many neighboring cells are similar. If the percentage is above a threshold, the table tags are interpreted as a table. The data after table filtering (Section 2) is used to evaluate the strategies in table recognition. Tables 4-6 show the experimental results when the three metrics are applied incrementally.
Precision rate (P), recall rate (R), and F-measure (F) defined below are adopted to measure the performance.
[image:4.595.304.521.351.464.2]Table 4 shows that string similarity cannot capture the similar concept between neighboring cells very well. The F-measure is 55.50%. Table 5 tries to incorporate more semantic features, i.e., categories of named entity. Unfortunately, the result does not meet our expectation. The performance only increases a little. The major reason is that the keywords (pm/am, $, %, etc.) for date/time expressions and monetary and percentage expressions are usually omitted in table description. Table 6 shows that the F-measure achieves 86.50% when number category is used. Compared with Tables 4 and 5, the performance is improved
Table 4. String Similarity China
Airline Eva Airline
Mandarin Airline
Singapore Airline
Fareast Airline
Sum
Number of Tables
751 98 23 40 6 918
Tables Proposed
150 41 7 17 5 220
Correct 134 39 7 14 3 197 Precision
Rate
89.33% 95.12% 100% 82.35% 60% 89.55%
Recall Rate 17.84% 39.80% 30.43% 35.00% 50% 21.46% F-measure 53.57% 67.46% 65.22% 58.68% 55% 55.50%
Table 5. String or Named Entity Similarity China
Airline Eva Airline
Mandarin Airline
Singapore Airline
Fareast Airline
Sum
Number of Tables
751 98 23 40 6 918
Tables Proposed
151 42 7 17 5 222
Correct 135 40 7 14 3 199 Precision
Rate
89.40% 95.24% 100% 82.35% 60% 89.64%
Recall Rate 17.98% 40.82% 30.43% 35.00% 50% 21.68% F-measure 53.69% 68.03% 65.22% 58.68% 55% 55.66%
Table 6. String, Named Entity, or Number Category Similarity
China Airline
Eva Airline
Mandarin Airline
Singapore Airline
Fareast Airline
Sum
Number of Tables
751 98 23 40 6 918
Tables Proposed
668 60 16 41 6 791
Correct 627 58 14 32 4 735 Precision
Rate
93.86% 96.67% 87.50% 78.05% 66.67% 92.92%
Recall Rate 83.49% 59.18% 60.87% 80.00% 66.67% 80.07% F-measure 88.88% 77.93% 74.19% 79.03% 66.67% 86.50% ated
ystemGener rOfTablesS
TotalNumbe
erated sSystemGen rrectTable
NumberOfCo P=
Tables rOfCorrect TotalNumbe
erated sSystemGen rrectTable
NumberOfCo R=
2 R P
drastically.
4 Table Interpretation
As specified in Section 1, the attribute-value relationship may be interpreted in column wise or in row wise. If the table tags in questions do not contain COLSPAN (ROWSPAN), the problem is easier. The first row and/or the first column consist of the attribute cells, and the others are value cells. Cell similarity guides us how to read a table. We define row (or column) similarity in terms of cell similarity as follows. Two rows (or columns) are similar if most of the corresponding cells between these two rows (or columns) are similar.
A basic table interpretation algorithm is shown below. Assume there are n rows and m columns. Let cij denote a cell in i
th
row and jth column.
(1) If there is only one row or column, then the problem is trivial. We just read it in row wise or column wise. (2) Otherwise, we start the similarity
checking from the right-bottom position, i.e., cnm. That is, the n
th
row and the mth column are regarded as base for comparisons.
(3) For each row i (1 ≤ i < n), compute the similarity of the two rows i and n. (4) Count how many pairs of rows are
similar.
(5) If the count is larger than (n-2)/2, and the similarity of row 1 and row n is smaller than the similarity of the other row pairs, then we say this table can be read in column wise. In other words, the first row contains attribute cells.
(6) The interpretation from row wise is done in the similar way. We start checking from mth column, compare it with each column j (1 ≤ j < m), and count how many pairs of columns are similar.
(7) If neither “row-wise” nor “column-wise” can be assigned, then the default is set to “row wise”.
Table 6 is an example. The first column contains attribute cells. The other cells are statistics of an experimental result. We read it in row wise. If COLSPAN (ROWSPAN) is used, the table interpretation is more difficult. Table 1 is a typical example. Five COLSPANs and two ROWSPANs are used to create a better layout. The attributes are formed hierarchically. The following is an example of hierarchy.
Adult --- Price --- Double Room
--- Single Room
--- Extra Bed
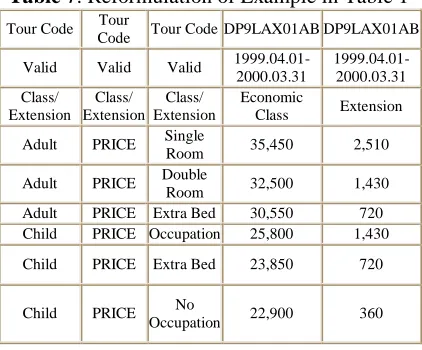
Here, we extend the above algorithm to deal with table interpretation with COLSPAN (ROWSPAN). At first, we drop COLSPAN and ROWSPAN by duplicating several copies of cells in their proper positions. For example, COLSPAN=3 for “Tour Code” in Table 1, thus we duplicate “Tour Code” at columns 2 and 3. Table 7 shows the final reformulation of the example in Table 1. Then we employ the above algorithm with slight modification to find the reading direction.
[image:5.595.307.518.556.731.2]The modification is that spanning cells are boundaries for similarity checking. Take Table 7 as an example. We start the similarity checking from the right-bottom cell, i.e., 360, and consider each row and column within boundaries. The cell “1999.04.01- 2000.03.31” is a spanning cell, so that 2nd row is a boundary. “Price” is a spanning cell, thus 2nd column is a boundary. In this case, we can interpret the table tags in both row wise and column wise.
Table 7. Reformulation of Example in Table 1
Tour Code Tour
Code Tour Code DP9LAX01AB DP9LAX01AB
Valid Valid Valid 1999.04.01- 2000.03.31
1999.04.01- 2000.03.31 Class/
Extension Class/ Extension
Class/ Extension
Economic
Class Extension
Adult PRICE Single
Room 35,450 2,510
Adult PRICE Double
Room 32,500 1,430 Adult PRICE Extra Bed 30,550 720 Child PRICE Occupation 25,800 1,430
Child PRICE Extra Bed 23,850 720
Child PRICE No
After that, a second cycle begins. The starting points are moved to new right-bottom positions, i.e., (3, 5) and (9, 3). In this cycle, boundaries are reset. The cells DP9LAX01AB” and “Adult” (“Child”) are spanning cells, so that 1st row and 1st column are new boundaries. At this time, “row-wise” is selected.
In final cycle, the starting positions are (2,5) and (9, 2). The boundaries are 0th row and 0th column. These two sub-tables are read in row wise.
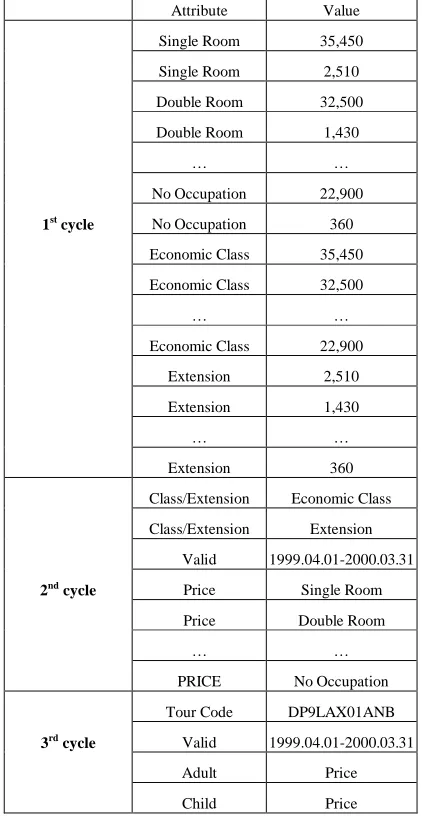
5 Presentation of Table Extraction
The results of table interpretation are a sequence of attribute-value pairs. Consider the tour example. Table 8 shows the extracted pairs. We can find the following two phenomena:
(1) A cell may be a value of more than one attribute.
(2) A cell may act as an attribute in one case, and a value in another case. We can concatenate two attributes together by using phenomenon (1). For example, “35,450” is a value of “Single Room” and “Economic Class”, thus “Single Room-Economic Class” is formed. Besides that, we can find attribute hierarchy by using phenomenon (2). For example, “Single Room” is a value of “Price”, and “Price” is a value of “Adult”, so that we can create a hierarchy “Adult-Price-Single Room”.
Merging the results from these two phenomena, we can create the interpretations that we listed in Section 1. For example, from the two facts:
“35,450” is a value of “Single Room-Economic Class”, and
“Adult-Price-Single Room” is a hierarchical attribute,
we can infer that 35,450 is a value of “Adult-Price-Single Room-Economic Class”.
[image:6.595.303.514.123.531.2]In this way, we can transform unstructured data into more structured representation for further applications. Consider an application in question and answering. Given a query like “how much is the price of a double room for an adult”, the keywords are “price”, “double
Table 8 The Extracted Attribute-Value Pairs
Attribute Value
Single Room 35,450
Single Room 2,510
Double Room 32,500
Double Room 1,430
… …
No Occupation 22,900
1st cycle No Occupation 360
Economic Class 35,450
Economic Class 32,500
… …
Economic Class 22,900
Extension 2,510
Extension 1,430
… …
Extension 360
Class/Extension Economic Class
Class/Extension Extension
Valid 1999.04.01-2000.03.31
2nd cycle Price Single Room
Price Double Room
… …
PRICE No Occupation
Tour Code DP9LAX01ANB
3rd cycle Valid 1999.04.01-2000.03.31
Adult Price
Child Price
room”, and “adult”. After consulting the database learning from HTML texts, two values, 32,500 and 1,430 with attributes economic class and extension, are reported. With this table mining technology, knowledge that can be employed is beyond text level.
Conclusion
recognition is 86.50%.
There are still other spaces to improve performance. The cues from context of tables and the traversal paths of HTML pages may be also useful. In the text surrounding tables, writers usually explain the meaning of tables. For example, which row (or column) denotes what kind of meanings. From the description, we can know which cell may be an attribute, and along the same row (column) we can find their value cells. Besides that, the text can also show the semantics of the cells. For example, the table cell may be a monetary expression that denotes the price of a tour package. In this way, even money marker is not present in the table cell, we can still know it is a monetary expression.
Note that HTML texts can be chained through hyperlinks like “previous” and “next”. The context can be expanded further. Their effects on table mining will be studied in the future. Besides the possible extensions, another research line that can be considered is to set up a corpus for evaluation of attribute-value relationship. Because the role of a cell (attribute or value) is relative to other cells, to develop answering keys is indispensable for table interpretation.
References
Appelt, D. and Israel, D. (1997) "Tutorial Notes on Building Information Extraction Systems," Tutorial on Fifth Conference on Applied Natural Language
Processing, 1997.
Chen, H.H.; Ding Y.W.; and Tsai, S.C. (1998) "Named Entity Extraction for Information Retrieval," Computer Processing of Oriental
Languages, Special Issue on Information Retrieval
on Oriental Languages, Vol. 12, No. 1, 1998, pp.75-85.
Douglas, S.; Hurst, M. and Quinn, D. (1995) "Using Natural Language Processing for Identifying and Interpreting Tables in Plain Text," Proceedings of
Fourth Annual Symposium on Document Analysis and Information Retrieval, 1995, pp. 535-545.
Douglas, S. and Hurst, M. (1996) "Layout and Language: Lists and Tables in Technical Documents," Proceedings of ACL SIGPARSE
Workshop on Punctuation in Computational Linguistics, 1996, pp. 19-24.
Gaizauskas, R. and Wilks, Y. (1998) " Information Extraction: Beyond Document Retrieval,"
Computational Linguistics and Chinese Language Processing, Vol. 3, No. 2, 1998, pp. 17-59.
Green, E. and Krishnamoorthy, M. (1995) "Recognition of Tables Using Grammars,"
Proceedings of the Fourth Annual Symposium on Document Analysis and Information Retrieval,
1995, pp. 261-278.
Hurst, M. and Douglas, S. (1997) "Layout and Language: Preliminary Experiments in Assigning Logical Structure to Table Cells," Proceedings of
the Fifth Conference on Applied Natural Language Processing, 1997, pp. 217-220.
Hurst, M. (1999a) "Layout and Language: Beyond Simple Text for Information Interaction - Modeling the Table," Proceedings of the 2nd International
Conference on Multimodal Interfaces, Hong Kong,
January 1999.
Hurst, M. (1999b) "Layout and Language: A Corpus of Documents Containing Tables," Proceedings of
AAAI Fall Symposium: Using Layout for the Generation, Understanding and Retrieval of Documents, 1999.
Mikheev, A. and Finch, S. (1995) "A Workbench for Acquisition of Ontological Knowledge from Natural Text," Proceedings of the 7th Conference
of the European Chapter for Computational Linguistics, 1995, pp. 194-201.
MUC (1998) Proceedings of 7th Message
Understanding Conference, http://www.muc.saic.
com /proceedings/proceedings_index.html.
Ng, H.T.; Lim, C.Y. and Koo, J.L.T. (1999) "Learning to Recognize Tables in Free Text,"
Proceedings of the 37th Annual Meeting of ACL,