Experimental and theoretical studies of Notch
signaling–mediated spatial pattern
Thesis by
Amit Lakhanpal
In Partial Fulfillment of the Requirements
for the Degree of
Doctor of Philosophy
California Institute of Technology
Pasadena, California
2014
c
2014
Amit Lakhanpal
iii
Acknowledgments
Nothing of this work would have been possible without the support of my adviser, Michael Elowitz,
for which I am very grateful. More than just that, his mentorship has been invaluable, including
the excellent opportunity to work on all stages of the research process — finding a good problem,
working out a program, grantwriting, working through iterations of experiments and analysis, writing
up papers, going through peer review — and benefit from his expertise in each of them. I also owe
a great debt of gratitude to David Sprinzak, who was in essence as a second adviser to me while he
was a postdoc in the lab, and remained a strong source of support throughout. Their example is
one from which I am very glad to have had the opportunity to learn.
It has also been my good fortune to have shared my time in the lab with some extraordinary
people. Among them is our “Delta Force” of Lauren LeBon, Sandy Nandagopal, and Leah Santat, a
group with which I am proud to have worked so closely and for whose advice and support over the
years I am thankful. Joe Levine, Fred Tan, and Jon Young, even if their tastes in model systems
tended to run in different directions, were particularly good partners in fun-for-fun’s-sake to lighten
the atmosphere on occasion.
Outside of the lab, I truly appreciated the the warm and welcoming TACIT community through
which I had the chance to meet some truly fantastic people who were a source of tremendous support.
Finally, my graduate studies have been supported by the Fannie and John Hertz Foundation, for
v
Abstract
Notch signaling acts in many diverse developmental spatial patterning processes. To better
under-stand why this particular pathway is employed where it is and how downstream feedbacks interact
with the signaling system to drive patterning, we have pursued three aims: (i) to quantitatively
measure the Notch system’s signal input/output (I/O) relationship in cell culture, (ii) to use the
quantitative I/O relationship to computationally predict patterning outcomes of downstream
feed-backs, and (iii) to reconstitute a Notch-mediated lateral induction feedback (in which Notch signaling
upregulates the expression of Delta) in cell culture. The quantitative Notch I/O relationship revealed
that in addition to thetrans-activation between Notch and Delta on neighboring cells there is also a strong, mutualcis-inactivation between Notch and Delta on the same cell. This feature tends to amplify small differences between cells. Incorporating our improved understanding of the signaling
system into simulations of different types of downstream feedbacks and boundary conditions lent us
several insights into their function. The Notch system converts a shallow gradient of Delta
expres-sion into a sharp band of Notch signaling without any sort of feedback at all, in a system motivated
by theDrosophila wing vein. It also improves the robustness of lateral inhibition patterning, where signal downregulates ligand expression, by removing the requirement for explicit cooperativity in
the feedback and permitting an exceptionally simple mechanism for the pattern. When coupled to
a downstream lateral induction feedback, the Notch system supports the propagation of a signaling
front across a tissue to convert a large area from one state to another with only a local source of
initial stimulation. It is also capable of converting a slowly-varying gradient in parameters into a
sharp delineation between high- and low-ligand populations of cells, a pattern reminiscent of smooth
induc-tion feedback architecture modified with the addiinduc-tion of an autoregulatory positive feedback loop,
vii
Contents
Acknowledgments iv
Abstract v
1 Introduction 1
2 Cis-interactions between Notch and Delta generate mutually exclusive signalling
states 8
3 Patterning consequences of mutual cis-inhibition 69
3.1 Mutual Inactivation of Notch Receptors and Ligands Facilitates Developmental
Pat-terning . . . 69
3.2 Mutual inactivation of Notch and Delta permits a simple mechanism for lateral
inhi-bition patterning . . . 113
3.3 Mutualcis-inactivation in the Notch-Delta signaling system affects lateral induction patterning . . . 123
4 Engineering and characterization of a synthetic Notch signaling-mediated lateral
induction feedback circuit in cell culture 143
Chapter 1
Introduction
Integral to most modern definitions of ‘life’ is the capacity to reproduce. Complex multicellular
or-ganisms, in order to satisfy this imperative, cycle between the single-cell zygotic state and the adult
form. Developmental biology addresses the mechanisms by which a single cell under suitably
sup-portive conditions can reliably proceed to generate a functional, fully-formed multicellular organism.
The developmental trajectory must include growth in the number of cells by division, specialization
of cellular function by differentiation, and proper ordering of those processes in space and time by
means of some regulation. Such regulation frequently arises from communication between initially
equivalent cells which, under the influence of a feedback network, coordinate to achieve a spatially
patterned outcome. Our primary interest in this work is to understand the basis of spatial
pattern-ing by studypattern-ing the interactions between intercellular signalpattern-ing systems and intracellular feedback
networks, using bothin silico computation and in vitro experimental methods.
The modern body of knowledge in a wide variety of developmental spatial and temporal patterns
is vast, with ancient origins in the description of macroscopically-discernible stages of embryological
development [1]. Over time advances in the state of technology allowed progressively more refined
observational and eventually experimental approaches. Microscopy and the cell theory of biology
made visible early steps in establishing body plan [2], and transplantation experiments [3] began
to reveal the important role of interactions between different types of cells in initiating patterning
processes. Eventually knowledge of the genetic basis of biological activity led to the search for genetic
2
wild type patterning outcomes, so that the outcome of mutagenesis can be compared against normal.
Screens involving visible features (such as the number and polarity of segments in an embryo in the
seminal Drosophila work of N¨usslein-Volhard and Wieschaus [5]) identified many determinants of spatial pattern, and have been complemented over time with improvements in imaging techniques
allowing more detailed probes of structure formation processes. This has been especially crucial
with respect to dynamic patterns of gene expression that were inaccessible in realtime (or otherwise)
before effective fluorescent imaging. In addition, progressively greater sophistication in manipulating
the genomes of model organisms has enabled a wider spectrum of genetic perturbations, allowing
control over the timing, spatial distribution, and strength of mutant alleles that has been critical
in understanding how components of signaling systems and regulatory networks interact to drive
spatial pattern.
As much as approaches to studying development have evolved over time, they remain
fundamen-tally tied to studying patterns in the context where they arise naturally. This has many advantages,
especially with respect to physiological relevance, but there are also important limitations. When
manipulating an endogenous pathway it is not possible to make claims of sufficiency for any
pro-posed mechanism, because in natural systems every component is embedded in a dense interaction
network. The specificity of a phenomenon to a particular organism, or its generality across species,
cannot be rigorously assessed exclusively in natural systems. Especially in development, when a
process of interest might be one of many occurring simultaneously in a highly dynamic environment,
the natural context may be exceedingly difficult to measure or manipulate. Part of the promise
of synthetic approaches to biology is to overcome such challenges [6]. If a proposed mechanism
for a phenomenon, such as reasonably stable oscillations, can successfully capture the desired
be-havior when implemented using components orthogonal to the host organism [7,8], it constitutes a
proof of sufficiency. Successfully transplanting a proposed regulatory network architecture into an
in vitro system also offers support for cross-species generality. Synthetic approaches to reconstruct behaviors have been recently employed beyond prokaryotes in mammalian cell culture [9]. These
reconstituting putative minimal regulatory networks in mammalian cell culture.
As mentioned earlier, communication between cells is required for the kind of bottom-up spatial
patterning events observed throughout development. A small number of signaling pathways are
employed for this purpose in development, among which is the Notch signaling pathway [10]. The
first observed phenotype due to a mutation in the gene that would come to be known as Notch
arose in Drosophila, where the allele in question generated malformed wings with notches along their margin [11,12]. Further studies of Drosophila with mutant Notch alleles showed an effect on the distribution of cell types [13], in particular between neurons and ectoderm, suggesting a role
in cell fate determination. Work in what would prove to be the Notch ortholog inC. elegans [14], lin-12, provided evidence that the action of Notch was partly cell non-autonomous [15] — that it
normally depended on interactions with a neighboring cell. Searches inDrosophila for mutations in other genes with similarity to the Notch phenotype proved successful, including the identification of
Delta (so named for the thickening of wing veins in Delta heterozygotes). Delta was established to
be a ligand for Notch by a variety of evidence including gene dosage mosaic analysis [16]. From these
early experiments elucidating the roles of Notch signaling in specific model systems, knowledge of
the signaling system’s importance due to its frequent use throughout development, its conservation
across species, and its complexity via additional regulators of signaling has grown considerably
[10,17].
Notch refers to a family of single-pass transmembrane receptors (ranging from one member in
Drosophila to four in mammals) with a series of EGF-like repeats in the extracellular part and an intracellular part containing nuclear localization signals and a trans-activating domain [18]. The
canonical partners of the Notch family are the transmembrane DSL (Delta/Serrate/Lag-2) ligands
— Delta and Serrate in Drosophila, Delta-like(Dll)1/3-4 and Jagged1-2 in mammals [18]. The extracellular EGF-like repeats of Notch receptors and DSL ligands interact intrans on the surfaces of neighboring cells, which generates a force [19] exposing a site on the receptor to a cleavage event
that ultimately leads to release of the receptor intracellular domain and its trafficking into the
4
cell can also bind incis, which has an inhibitory effect on signaling [20].
Notch signaling is implicated in a wide variety of spatial patterning processes including the
specification of neural and epidermal cells from neuroectoderm [21], organization of sensory regions in
the inner ear [22], wing vein boundary sharpening inDrosophila[23], and smooth muscle specification surrounding artery walls [24]. In neural specification the Notch system engages a type of feedback
known as ‘lateral inhibition’ in which Notch signaling downregulates Delta expression, which leads
to an alternating spatial pattern of Notch activity (referred to as a lateral inhibition pattern). In
theDrosophila wing vein, the boundary between vein and intervein cells is sharpened in a Notch-dependent process. The specification of smoooth muscle surrounding the walls of some arteries is a
‘lateral induction’ process, in which Notch signaling activates expression of ligand. In each of these
cases, the combination of (i) a signaling system, (ii) a downstream regulatory feedback, and (iii)
specific initial conditions drive the system to a patterned outcome.
Our first step toward synthetically reconstituting developmental spatial pattern was to choose a
signaling system and characterize its properties relevant to patterning. We chose the Notch signaling
system, and decided that in order to gain insight into why the Notch system is used in specific
natural patterning processes and to rationally compose synthetic pattern-generating feedbacks it
was necessary to quantitatively understand the relationship between ligand levels (in cis and in trans) and the system’s signal output. In spite of the system’s developmental importance and the vast literature relating to it, such a measurement had not been reported. The results of our
measurement of the system input/output relationship for the Notch1/Dll1 pair have been published
[25], and appear as Chapter 2 of this thesis. My contributions to the work were principally in
data analysis and computations relating to the interpretation of the data, including its potential
developmental relevance.
Second, we have taken the insights into the Notch system from its ligand response profile and
applied them to a variety of spatial patterns known to employ Notch signaling. This computational
work comprises the content of Chapter 3. Its first section, published with my contribution as equal
formation and lateral inhibition motivated by specific developmental processes. The second section
expands on an exceptionally elegant mechanism for lateral inhibition that I conceived during our
analysis of the Notch signaling response function data [27]. Lastly, the third section presents my
unpublished work on the potential for patterning with a lateral induction feedback.
Third, we have sought to implement a pattern-forming feedback downstream of the Notch
signal-ing system in mammalian cell culture. Chapter 4 describes an attempt to synthetically reconstitute
lateral induction signaling in CHO-K1 cells, a standard mammalian cell culture line. It also reports
on the effect of rewiring the feedback circuit to incorporate an additional auto-activating positive
feedback. Ultimately, taken together we quantitatively characterize the signaling behavior of the
Notch system, computationally assess the significance of this behavior combined with feedbacks
in spatial patterning processes, and attempt to reconstitute the lateral induction behavior in cell
culture.
References
1. Needham, J.A History of Embryology. (The University Press, Cambridge, UK, 1959).
2. De Felici, M. & Siracusa, G. The rise of embryology in Italy: from the Renaissance to the early
20th century. Int J Dev Biol 44, 515-521 (2000).
3. De Robertis, E.M. Spemann’s organizer and self-regulation in amphibian embryos. Nat Rev Mol Cell Biol 7, 296-302 (2006).
4. Ernst, S.G. Offerings from an Urchin. Developmental Biology 358, 285-294 (2011).
5. N¨usslein-Volhard C. & Wieschaus E. Mutations affecting segment number and polarity in
Drosophila. Nature 287, 795-801 (1980).
6. Sprinzak, D. & Elowitz, M.B. Reconstruction of genetic circuits. Nature 438, 443-448 (2005).
6
8. Elowitz, M.B. & Leibler, S. A synthetic oscillatory network of transcriptional regulators. Na-ture 405, 335-338 (2000).
9. Weber W. & Fussenegger M. Synthetic gene networks in mammalian cells. Curr Opin Biotech-nol 21, 690-696 (2010).
10. Bray S.J. Notch signaling: a simple pathway becomes complex. Nat Rev Mol Cell Bio 7, 678-689 (2006).
11. Dexter, J.S. The analysis of a case of continuous variation in Drosophila by a study of its
linkage. The American Naturalist 48, 712-758 (1914).
12. Morgan, T.H. & Bridges C.B. Sex-linked inheritance in Drosophila. (Carnegie Institution, Washington D.C., 1916).
13. Poulson D.F. Chromosomal deficiencies and the embryonic development of Drosophila melanogaster.
PNAS 23, 133-137 (1937).
14. Greenwald, I. lin-12, a nematode homeotic gene, is homologous to a set of mammalian proteins
that includes epidermal growth factor. Cell 43, 583-590 (1985).
15. Greenwald, I. Notch and the awesome power of genetics. Genetics 191, 655-669 (2012).
16. Heitzler, P. & Simpson, P. The choice of cell fate in the epidermis of Drosophila. Cell 64, 1083-1092 (1991).
17. Guruharsha, K.G., Kankel M.W. & Artavanis-Tsakonas S. The Notch signaling system: recent
insights into the complexity of a conserved pathway. Nat Rev Gen 13, 654-666 (2012).
18. Radtke, F., Schweisguth, F. & Pear, W. The Notch ‘gospel’. EMBO Rep 6, 1120-1125 (2005).
19. Musse, A.A., Meloty-Kapella, L. & Weinmaster, G. Notch ligand endocytosis: Mechanistic
basis of signaling activity. Seminars in Cell & Developmental Biology 23, 429-436 (2012).
20. D’Souza, B., Meloty-Kapella, L. & Weinmaster, G. Canonical and Non-Canonical Notch
21. Kunisch M., Haenlin M., & Campos-Ortega J.A. Lateral inhibition mediated by the Drosophila
neurogenic gene delta is enhanced by proneural proteins. PNAS 91, 10139-10143 (1994).
22. Kiernan A.E. Notch signaling during cell fate determination in the inner ear. Semin Cell Dev Biol 24, 470-479 (2013).
23. Huppert, S.S., Jacobsen, T.L. & Muskavitch, M.A. Feedback regulation is central to
Delta-Notch signalling required for Drosophila wing vein morphogenesis. Development 124, 3283 -3291 (1997).
24. Manderfield, L.J.et al. Notch activation of Jagged1 contributes to the assembly of the arterial wall. Circulation 125, 314-323 (2012).
25. Sprinzak, D. et al. Cis-interactions between Notch and Delta generate mutually exclusive signalling states. Nature 465, 86-90 (2010).
26. Sprinzak, D., Lakhanpal, A., LeBon, L., Garcia-Ojalvo, J. & Elowitz, M.B. Mutual Inactivation
of Notch Receptors and Ligands Facilitates Developmental Patterning. PLoS Comput Biol 7, e1002069 (2011).
27. Lakhanpal, A., Sprinzak, D., & Elowitz, M.B. Mutual inactivation of Notch and Delta permits
8
Chapter 2
Cis
-interactions between Notch
and Delta generate mutually
exclusive signalling states
This chapter has been published1 in identical form, save for differences between journal and thesis
formatting requirements. My contribution as described in the published manuscript was to the data
analysis, and in providing input for writing the paper. I also contributed significantly to the analysis
of the potential pattern-related consequences of thecis-inhibition feature reported in the paper.
Abstract
The Notch-Delta signalling pathway allows communication between neighbouring cells during
de-velopment [1]. It has a critical role in the formation of ‘fine-grained’ patterns, generating distinct
cell fates among groups of initially equivalent neighbouring cells and sharply delineating
neighbour-ing regions in developneighbour-ing tissues [2-5]. The Delta ligand has been shown to have two activities:
it transactivates Notch in neighbouring cells and cis-inhibits Notch in its own cell. However, it remains unclear how Notch integrates these two activities and how the resulting system facilitates
pattern formation. Here we report the development of a quantitative time-lapse microscopy
plat-form for analysing Notch-Delta signalling dynamics in individual mammalian cells, with the aim of
addressing these issues. By controlling both cis- and trans-Delta concentrations, and monitoring 1Sprinzak, D., Lakhanpal, A., LeBon, L., Santat, L.A., Fontes, M.E., Anderson, G.A., Garcia-Ojalvo, J., &
the dynamics of a Notch reporter, we measured the combined cis-trans input-output relationship in the Notch-Delta system. The data revealed a striking difference between the responses of Notch
to trans- andcis- Delta: whereas the response totrans-Delta is graded, the response to cis-Delta is sharp and occurs at a fixed threshold, independent oftrans-Delta. We developed a simple math-ematical model that shows how these behaviours emerge from the mutual inactivation of Notch
and Delta proteins in the same cell. This interaction generates an ultrasensitive switch between
mutually exclusive sending (high Delta/low Notch) and receiving (high Notch/low Delta) signalling
states. At the multicellular level, this switch can amplify small differences between neighbouring
cells even without transcription-mediated feedback. This Notch-Delta signalling switch facilitates
the formation of sharp boundaries and lateral-inhibition patterns in models of development, and
provides insight into previously unexplained mutant behaviours.
Letter
Notch and Delta are single-pass transmembrane protein families found in metazoan species. Delta
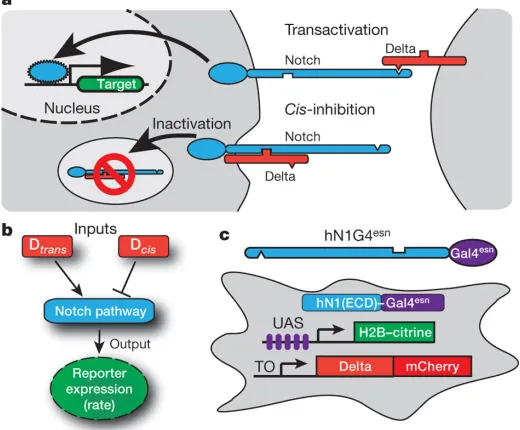
in one cell can bind to, and transactivate, Notch in a neighbouring cell. This interaction results in
proteolytic release of the Notch intracellular domain, which translocates to the nucleus and activates
target genes6 (Fig. 1a). Delta also has a second role, inhibiting Notch activity in its own cell (cis -inhibition) [7-10]. Cis-inhibition has been shown to involve direct interaction of the two proteins [11], but current understanding is incomplete [12].
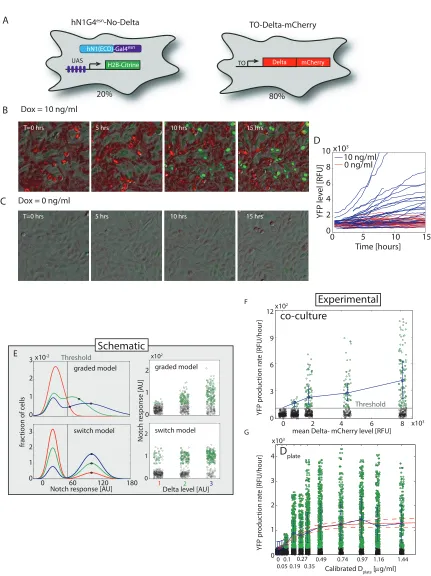
To understand how concentrations ofcis- andtrans-Delta are integrated by the Notch pathway (Fig. 1b), we constructed cell lines that allowed us to modulate the concentrations of cis- and trans-Delta independently, and to monitor quantitatively the transcriptional response of a Notch reporter (Fig. 1c and Supplementary Fig. 1). These cell lines stably expressed Notch receptors and
corresponding yellow fluorescent protein (YFP) reporters of Notch activity (Supplementary Figs 1
and 2). They also contained a doxycycline-inducible chimaeric rat Dll1-mCherry fusion gene
(Delta-mCherry; Supplementary Fig. 3). In our main cell line, hN1G4esn, the intracellular domain of human
10
[13], to avoid activation of endogenous Notch targets [14-16]. A second cell line, hN1, containing the
full-length human NOTCH1 was analysed as a control (Supplementary Fig. 1). Notch messenger
RNA expression levels in these cells were comparable to those observed in early T-cell progenitors
where Notch is active [17] (Supplementary Information).
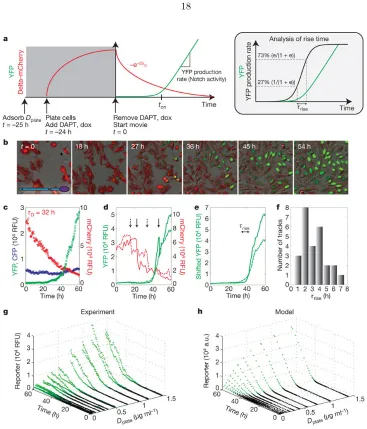
We first asked how Notch activity depends on the concentration of trans-Delta. We adsorbed fusion proteins, consisting of immunoglobin-G (IgG) fused to the extracellular domain of human
DLL1 (Deltaext), to the surface of plates at different concentrations, denoted D
plate (Fig. 2a and
Supplementary Fig. 4) [18,19], and recorded time-lapse movies of Notch activation. Before the
start of each movie (t <0), we inhibited Notch activation using theγ-secretase inhibitorN-[N -(3,5-difluorophenacetyl)-L-alanyl]-S-phenylglycine t-butyl ester (DAPT). At t= 0, DAPT was washed out, allowing the fluorescent reporter to accumulate at a rate determined by Notch activity (Fig.
2b, c and Supplementary Movie 1). The YFP production rate showed a graded response to Dplate,
well-fitted by a Hill function with a modest Hill coefficient (Fig. 2d).A similar response was observed
in the hN1 cell line (Supplementary Figure 1). This graded response was not due to the use of
plate-bound ligands: when cells expressing only Delta were co-cultured with cells expressing only Notch,
we observed a similarly graded dependence of Notch activity on the level of Delta expression, but
with greater variability (Supplementary Fig. 5).
We next set out to quantify the response of Notch to varying concentrations ofcis-Delta in the hN1G4esn cell line. We used a scheme in which Delta-mCherry was expressed in a pulse before
the start of the movie and subsequently allowed to dilute, effectively titrating its concentration
[20] (Fig. 3a). These experiments were performed at low cell density, where relatively weak
inter-cellular activation of Notch is observed (Supplementary Fig. 6), and transactivation was induced
predominantly by Dplate. At the beginning of the movie, Notch reporter expression was fully
inhib-ited by high Delta- mCherry concentrations (Fig. 3b and Supplementary Movie 2). Subsequently,
Delta-mCherry concentrations gradually declined on a timescale ofτD= 32±2.5 h, consistent with
dilution by cell growth and division (Fig. 3c). Atton≈40 h, we observed a sharp onset of reporter
in individual cell lineages (Fig. 3d-f and Supplementary Fig. 13). Similar behaviour was observed
in the hN1 cell line (Supplementary Fig. 7)
To quantify the sharpness of cis-inhibition, we computed the rise time, denoted τrise, required for Notch activity to increase by a factor of e in individual cells (Fig. 3e and Fig. 3a, inset).
The distribution of τrise showed a median of 2.6 h, which is considerably less than τD (Fig. 3f).
For comparison, an equivalently sharp Hill function of cis-Delta would require a Hill coefficient of τD/τrise<12.
We repeated the experiment for a variety of Dplate values, allowing us to directly measure the
integrated response of Notch across the two-dimensional input space ofcis- andtrans-Delta concen-trations (Fig. 3g and Supplementary Fig. 14). Activation occurred at a similar value of ton and,
therefore, a similarcis-Delta concentration, regardless of Dplate, as indicated by the fixed position of the transition from black to green points in Fig. 3g. In addition, the activation remained sharp
at all Dplate values for which it could be clearly measured.
Thus, an explanation for the observed cis- and trans-signal integration must simultaneously account for the three key features of the experimental data: a graded response totrans-Delta (Fig. 2d), a sharp response tocis-Delta (Fig. 3c-f) and a fixed threshold forcis-inhibition across varying concentrations of trans-Delta (Fig. 3g). We show here that a simple model can explain these observations in a unified way (Box 1 and Fig. 3h). The model’s key assumption is that Notch
and Delta in the same cell mutually inactivate each other. As shown in Box 1, strong enough
mutual inactivation can produce an ultrasensitive switch between two mutually exclusive signalling
states: cells can be in a predominantly ‘sending’ state, with high Delta concentration and low Notch
concentration, or a ‘receiving’ state, with high Notch concentration and low Delta concentration,
but cannot be in both states at the same time. Alternative models that do not include mutual
inactivation fail to account for the observed data (Supplementary Fig. 8).
The three features described above emerge naturally in this model. First, in the absence of
12
causes an excess of either protein to strongly diminish the activity of the other. Finally, the switching
point occurs when Notch andcis-Delta concentrations are comparable, and is therefore only weakly dependent ontrans-Delta.
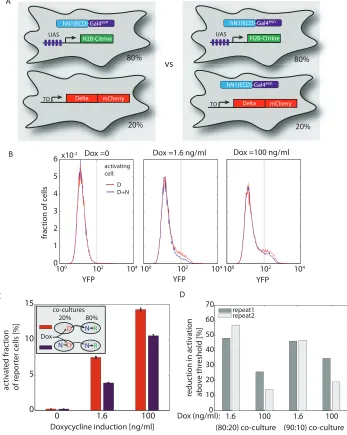
The mutual-inactivation model predicts cis-inhibition, not just of Notch by Delta but also of
Delta by Notch. This interaction is supported by results in other systems [12,21,22]. We tested this
prediction in our system using a transactivation assay based on co-culture of Delta-expressing sending
cells with Notch reporter cells. Expression of Notch in the Delta-expressing cells reduced their ability
to transactivate, as predicted (Supplementary Fig. 9). The exact biochemical mechanism of mutual
inactivation remains unclear, but we observed no sharp drop in the total cellular Delta-mCherry
fluorescence during switching, suggesting that the inactive complex may be stable in these conditions
(Fig. 3c, d).
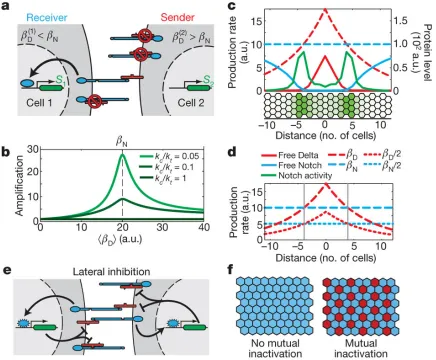
This signalling switch has important implications for multicellular patterning. To understand
these implications, consider two neighbouring cells that produce Notch and Delta at constant rates
(Fig. 4a). A slight excess of Notch production in one cell and a slight excess of Delta production in
its neighbour can generate a strong signalling bias in one direction: the first cell becomes a receiver
and the second becomes a sender. In this way, a small difference in production rates between cells
is amplified into a much larger difference in Notch activity (Fig. 4b). This amplification does not
require transcriptional regulation or feedback.
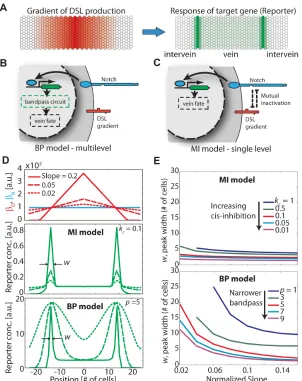
The send-receive signalling switch can facilitate formation of sharp boundaries. For example, in
Drosophila Notch and Delta sharply delineate wing vein boundaries [4,5]. In this system, Delta
pro-duction is initially expressed in a graded profile transverse to the vein. Eventually, Notch signalling
is restricted to two sharp side bands on either side of the vein axis.
As a simplified model, we simulated the development of a field of cells with a graded rate of
Delta production and a uniform rate of Notch production (Fig. 4c). The mutual-inactivation model
generated sharply defined side bands of Notch signalling at positions where the two production
rates intersect, that is, where sender and receiver cells are next to each other (Fig. 4c). Moreover,
Although Notch and Delta are individually haploinsufficient (causing thicker veins), the Notch+/−
Delta+/−double mutant restores the wild-type phenotype [23]. This suppression of the single-mutant
phenotypes in the double mutant emerges automatically in the model because proportional rescaling
of the Notch and Delta production rates does not move their intersection points (Fig. 4d). This
suppression is maintained across a broad range of parameter values and persists even with additional
feedbacks (Supplementary Fig. 10c), but is difficult to explain in other models (Supplementary Fig.
10a and Supplementary Information).
The send-receive signalling switch can also facilitate lateral-inhibition patterning. When Notch
transcriptionally downregulates Delta expression, the resulting intercellular positive-feedback loop
can generate ‘checkerboard’ patterns of Notch activity [24,25] (Fig. 4e). Without mutual
inactiva-tion, pattern formation requires a minimum Hill coefficient of n = 2, or higher, in the regulatory
feedback loop (Fig. 4f, left, and Supplementary Information). Although we cannot rule out such
cooperativity, or additional feedback loops, no evidence for strongly cooperative transactivation was
observed here or previously (Fig. 2d and Supplementary Fig. 1). In contrast, mutual inactivation
allows patterning even without cooperativity, by introducing a sharp response to changes in Delta
expression (Fig. 4f, right). In addition, for strong enoughcis-inhibition, mutual inactivation allows cells with high Delta concentrations to coexist next to one another in the steady state, leading to a
broader range of possible patterns (Supplementary Fig. 17). Finally, we note that low concentrations
of free Notch and Delta exist in sender and, respectively, receiver cells for finite mutual-inactivation
strengths (Supplementary Fig. 11). The resulting signalling between like cells (senders or receivers)
can have a role in lateral-inhibition patterning dynamics.
Modeling Box
Here we describe a simple model of Notch-Delta interactions that explains the experimental data
and provides insight into developmental patterning processes. The model involves several reactions.
First, during intercellular signalling, Notch in one cell binds to extracellular Delta, of concentration
14
domain [6]. Similarly, Notch in a neighbouring cell,Ntrans, can bind to Delta. Second, Notch binds
irreversibly to Delta in the same cell to form a stable, inactive, complex, which is effectively removed
from the system [12]. Finally, Notch and Delta are produced at constant rates, and degraded and/or
diluted at a constant rate, in addition to being removed through the interactions described above.
These reactions can be expressed as a set of ordinary differential equations for the concentrations
of free Notch, N, and free Delta, D, in an individual cell. An additional equation represents the
intracellular domain of Notch,S, which activates expression of the fluorescent reporter gene:
dN
dt =βN −γN− DN
kc −
DtransN kt
dD
dt =βD−γD− DN
kc −
DNtrans kt
dS dt =
DtransN
kt −γSS
HereDtransrepresents Dplatein Figs 2 and 3, but could also represent Delta concentration in one or
more neighbouring cells (Supplementary Information). Similarly,D in these equations corresponds
to cis-Delta in the experiments, and βN and βD denote the production rates of Notch and Delta, respectively. The combined degradation and dilution rate, γ, is assumed for simplicity to be the
same for Notch and Delta, and γS is the rate of decay of S. We write kc and kt to denote the
strengths of cis-inhibition and transactivation, respectively. See Supplementary Information for a more detailed description.
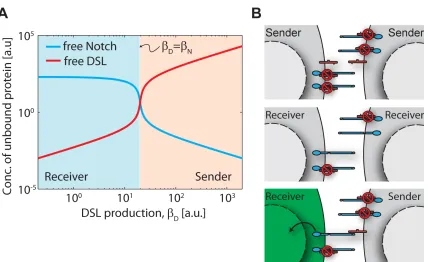
In the steady state, mutual inactivation leads to a switch between two qualitatively distinct
behaviours, depending on the relative production rates of Delta and Notch. When βD > βN,
ex-cess Delta effectively inactivates almost all Notch, allowing cells to send, but not efficiently receive,
signals. Conversely, when βD < βN, excess Notch effectively inactivates Delta, allowing cells to
receive, but not efficiently send, signals. Thus, the system approaches two mutually exclusive
sig-nalling states: high Delta/low Notch (‘sending’; pink shading in Figure), and high Notch/low Delta
(‘receiving’; blue shading in Figure). We note that this switch is not bistable.
a relatively small change inβDorβN can lead to a much larger change in signalling (Supplementary
Fig. 11). Related biochemical kinetics occur in bacterial small RNA and protein sequestration
[27-29]. In Fig. 3, ultrasensitivity occurs dynamically in response to the decay of the total Delta
16
18
Figure 4: The mutual-inactivation model in multicellular patterning. a, Signal amplification. The two interacting cells have the same amount of Notch (here, two molecules) but different amounts of Delta (one or three molecules). Owing to the cis-interaction between Notch and Delta, signalling is strongly biased to cell 1. b, Notch amplifies differences between cells. Signal amplification, (S1/S2−1)/(β
(2)
D /β
(1)
D −1), for two interacting cells, with different Delta production rates,β (2)
D =
1.35βD(1)(see model in Supplementary Information). Thexaxis shows the average Delta production rate,hβDi= (β
(2)
D +β
(1)
20
Methods Summary
We assembled genetic constructs and cell lines by standard methods (Supplementary Table 1).
All cell lines used in the main text (Supplementary Table 2) were derived from
T-REx-CHO-K1(Invitrogen). Cell lines were constructed by sequential rounds of Lipofectamine 2000 (Invitrogen)
transfection and selection. We isolated stably transfected clones by limiting dilution or FACS.
Time-lapse microscopy was performed with cells plated on 24-well glass-bottom plates (MatTek).
For plate-bound Delta experiments, IgG-Deltaextwas adsorbed to the plate together with 5µg ml−1
hamster fibronectin (Innovative Research) before cell plating. Before imaging, cells were switched to
a low-fluorescence medium, consisting of 5% FBS inαMEM lacking riboflavin, folic acid, phenol red
and vitamin B12. Movies were acquired using an Olympus IX81-ZDC microscope, equipped with an
environmental chamber at 37◦C supplying 5% CO2, a ×20, numerical-aperture-0.7 objective, and
automated acquisition software (METAMORPH (version 7.5.6.0), Molecular Devices).
We obtained western blots for Gal4 using standard protocols. Blots were probed using rabbit
anti-Gal4 DBD primary antibody (sc-577, Santa Cruz Biotechnology; 1:200) followed by incubation with
horseradish peroxidaselabelled anti-rabbit IgG secondary antibody (Amersham; 1:2,000). Bands
were quantified using a VersaDoc gel imaging system (Bio-Rad). Quantitative PCR with reverse
transcription was performed using standard protocols based on the RNeasy kit (Qiagen) and the
iScript cDNA synthesis kit (Bio-Rad).
We analysed co-culture experiments for YFP fluorescence using a FACScalibur flow cytometer
(Becton Dickinson) and standard protocols. Movies were analysed in several stages. First, individual
cell nuclei were identified in CFP images using a custom algorithm (MATLAB, MathWorks R2007a)
based on edge detection and thresholding of constitutively expressed H2B-cerulean fluorescence.
Then, for analysis of single-cell expression trajectories, individual nuclei were tracked across frames
using custom software (MATLAB, C) based on the softassign algorithm (Supplementary
Informa-tion). All single-cell trajectories were validated manually. For further details, see Supplementary
References
1. Artavanis-Tsakonas, S., Rand, M. D. & Lake, R. J. Notch signaling: cell fate control and signal
integration in development. Science 284, 770-776 (1999).
2. Goodyear, R. & Richardson, G. Pattern formation in the basilar papilla: evidence for cell
rearrangement. J. Neurosci. 17, 6289-6301 (1997).
3. Heitzler, P. & Simpson, P. The choice of cell fate in the epidermis of Drosophila. Cell 64, 1083-1092 (1991).
4. Huppert, S. S., Jacobsen, T. L. & Muskavitch, M. A. Feedback regulation is central to
Delta-Notch signalling required for Drosophila wing vein morphogenesis. Development 124, 3283-3291 (1997).
5. de Celis, J. F., Bray, S. & Garcia-Bellido, A. Notch signalling regulates veinlet expression and
establishes boundaries between veins and interveins in the Drosophila wing. Development 124, 1919-1928 (1997).
6. Bray, S. J. Notch signalling: a simple pathway becomes complex. Nature Rev. Mol. Cell Biol. 7, 678-689 (2006).
7. de Celis, J. F. & Bray, S. Feed-back mechanisms affecting Notch activation at the dorsoventral
boundary in the Drosophila wing. Development 124, 3241-3251 (1997).
8. Micchelli, C. A., Rulifson, E. J. & Blair, S. S. The function and regulation of cut expression
on the wing margin of Drosophila: Notch, Wingless and a dominant negative role for Delta
and Serrate. Development 124, 1485-1495 (1997).
9. Klein, T., Brennan, K. & Arias, A. M. An intrinsic dominant negative activity of serrate that
is modulated during wing development in Drosophila. Dev. Biol. 189, 123-134 (1997).
10. Miller, A. C., Lyons, E. L. & Herman, T. G. cis-Inhibition of notch by endogenous delta biases
22
11. Cordle, J. et al. A conserved face of the Jagged/Serrate DSL domain is involved in Notch trans-activation and cis-inhibition. Nature Struct. Mol. Biol. 15, 849-857 (2008).
12. Matsuda, M. & Chitnis, A. B. Interaction with Notch determines endocytosis of specific Delta
ligands in zebrafish neural tissue. Development 136, 197-206 (2009).
13. Kakidani, H. & Ptashne, M. GAL4 activates gene expression in mammalian cells. Cell 52, 161-167 (1988).
14. Struhl, G. & Adachi, A. Nuclear access and action of notch in vivo. Cell 93, 649-660 (1998).
15. Aster, J. C.et al. Essential roles for ankyrin repeat and transactivation domains in induction of T-cell leukemia by Notch1. Mol. Cell. Biol. 20, 7505-7515 (2000).
16. Yang, L. T. et al. Fringe glycosyltransferases differentially modulate Notch1 proteolysis in-duced by Delta1 and Jagged1. Mol. Biol. Cell 16, 927-942 (2005).
17. Rothenberg, E. V., Moore, J. E. & Yui, M. A. Launching the T-cell-lineage developmental
programme. Nature Rev. Immunol. 8, 9-21 (2008).
18. Varnum-Finney, B.et al. Immobilization of Notch ligand, Delta-1, is required for induction of notch signaling. J. Cell Sci. 113, 4313-4318 (2000).
19. Wang, S.et al. Notch receptor activation inhibits oligodendrocyte differentiation. Neuron 21, 63-75 (1998).
20. Rosenfeld, N., Young, J. W., Alon, U., Swain, P. S. & Elowitz, M. B. Gene regulation at the
single-cell level. Science 307, 1962-1965 (2005).
21. Jacobsen, T. L., Brennan, K., Arias, A. M. & Muskavitch, M. A. Cis-interactions between
Delta and Notch modulate neurogenic signalling in Drosophila. Development 125, 4531-4540 (1998).
22. Shaye, D. D. &Greenwald, I. LIN-12/Notch trafficking and regulation of DSL ligand activity
23. de Celis, J. F. & Bray, S. J. The Abruptex domain of Notch regulates negative interactions
between Notch, its ligands and Fringe. Development 127, 1291-1302 (2000).
24. Collier, J. R., Monk, N. A., Maini, P. K. & Lewis, J. H. Pattern formation by lateral inhibition
with feedback: a mathematical model of Delta-Notch intercellular signalling. J. Theor. Biol. 183, 429-446 (1996).
25. Plahte, E. Pattern formation in discrete cell lattices. J. Math. Biol. 43, 411-445 (2001).
26. Melen, G. J., Levy, S., Barkai, N. & Shilo, B. Z. Threshold responses to morphogen gradients
by zero-order ultrasensitivity. Mol. Syst. Biol. 1, doi:10.1038/ msb4100036 (2005).
27. Levine, E., Zhang, Z., Kuhlman, T. & Hwa, T. Quantitative characteristics of gene regulation
by small RNA. PLoS Biol. 5, e229 (2007).
28. Buchler, N. E. & Louis, M. Molecular titration and ultrasensitivity in regulatory networks. J. Mol. Biol. 384, 1106-1119 (2008).
24
Supplementary Information
Construct Name Promoter Gene Mammalian Selection Role in this work
pEV‐UAS‐H2B‐citrine UAS H2B‐citrine Zeocin Reporter for
hN1‐Gal4esn
pEV‐12xCSL‐H2B‐ citrine
12xCSL H2B‐citrine Zeocin Reporter for
hN1
pcDNA3‐hN1‐mod1 CMV hNotch1 Neomycin hN1 construct
pcDNA3‐hN1‐ mcherry
CMV hN1‐mcherry Neomycin hN1 construct
(used) pCDNA3‐hNECD –
Gal4esn
CMV hNECD –
Gal4esn
Neomycin hN1‐Gal4esn
construct pcDNA5/TO‐hNICD‐
Gal4esn
CMV‐TO hNICD‐Gal4esn Hygromycin hNICD‐Gal4esn
pcDNA5/TO‐Delta‐ mcherry
CMV‐TO Delta‐mcherry Hygromycin Inducible
Delta‐mCherry
pcDNA5/TO‐Gal4esn CMV‐TO Gal4esn Hygromycin Inducible Gal4esn
pCS‐H2B‐cerulean CMV H2B‐cerulean ‐ Segmentation color
pcDNA6‐UAS‐H2B‐ citrine
UAS H2B‐citrine Blasticidin Reporter in dual
reporter line pEV‐12xCSL‐H2B‐
mcherry
12xCSL H2B‐mcherry Zeocin Reporter in dual
reporter line
Stable Cell Line Parental Line Transfected Construct Antibiotic Selection
T‐REx‐CHO‐K1
hN1G4esn hN1G4esn‐No‐Delta pcDNA5‐TO‐Dl‐mCherry
Zeocin (400 ug/ml), Blasticidin (10 ug/ml),
26
Stable Cell Line Parental Line Transfected Construct Antibiotic Selection T‐REx‐CHO‐K1
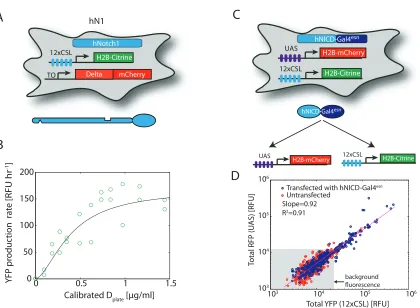
(C) Total RFP fluorescence versus total YFP fluorescence for transfected (blue circles) or untransfected
(red circles) cells shows a co‐linear response of the two reporters to the fusion activator (plotted on a
log‐log scale). A linear regression fit shows a slope of 0.92 (R2=0.91), corresponding to a nearly linear
relation between the two reporters (red line). Background fluorescence (gray area) is due to basal
leakiness of reporters. Note that, due to the finite transfection efficiency of the transient transfection,
only some of the cells contain the fusion activator. Data points are extracted from fluorescence images
Figure S2: The Gal4esn‐UAS transcription factor‐promoter interaction shows no cooperativity. This
figure describes a measurement of the relationship between Gal4esn concentration and the
transcriptional activity of its target UAS promoter. As in Fig. 3A and ref. 2, the approach involves
events, the “lost” fluorescence after division is replaced (computationally) after each cell division event
(dashed line and arrows). The slope of the resulting (dashed) trace is directly related to the activity of
4
Figure S2: The Gal4esn‐UAS transcription factor‐promoter interaction shows no cooperativity. This
figure describes a measurement of the relationship between Gal4esn concentration and the
transcriptional activity of its target UAS promoter. As in Fig. 3A and ref. 2, the approach involves
events, the “lost” fluorescence after division is replaced (computationally) after each cell division event
28
29
Figure S2: The Gal4esn‐UAS transcription factor‐promoter interaction shows no cooperativity. This
figure describes a measurement of the relationship between Gal4esn concentration and the
transcriptional activity of its target UAS promoter. As in Fig. 3A and ref. 2, the approach involves
events, the “lost” fluorescence after division is replaced (computationally) after each cell division event
(dashed line and arrows). The slope of the resulting (dashed) trace is directly related to the activity of
human‐IgG conjugated to Alexa488 (Invitrogen). Fluorescence levels were measured using a plate reader
(Wallac 1420, Perkin‐Elmer). As seen in the figure, the binding of IgG‐Deltaext starts to saturate at
cells with increasing Delta. (F) Experimental analysis of Notch reporter activation in individual cells (YFP
production rates) at different levels of mean Delta‐mCherry induction. The green circles correspond to
figure describes a measurement of the relationship between Gal4esn concentration and the
transcriptional activity of its target UAS promoter. As in Fig. 3A and ref. 2, the approach involves
events, the “lost” fluorescence after division is replaced (computationally) after each cell division event
(dashed line and arrows). The slope of the resulting (dashed) trace is directly related to the activity of
Figure S3: TO‐Delta‐mCherry cells trans‐activate as efficiently as OP9‐Delta cells. We compared the
relative abilities of the TO‐Delta‐mCherry cell line, the OP9‐Delta cell line, and Dplate to trans‐activate
Notch. Stromal OP9 cells stably expressing mDll1 (OP9‐Delta) and control OP9 cells not expressing Delta1
(both are a generous gift from Ellen Rothenberg) and inducible CHO TO‐Delta‐mCherry cells were co‐
cultured with hN1G4esn‐No‐Delta cells (containing Notch and a reporter only—see Fig. S5). Cells were
30
Figure S4: Calibration of plate bound Delta. Plates were incubated with different concentrations of IgG‐
Deltaext (see methods for complete protocol). We determined the relationship between the
concentration of IgG‐Deltaext used during incubation and the amount of IgG‐Deltaext actually adsorbed
to the plate using a fluorescence binding assay. Right after incubation, plates were treated with anti‐
human‐IgG conjugated to Alexa488 (Invitrogen). Fluorescence levels were measured using a plate reader
(Wallac 1420, Perkin‐Elmer). As seen in the figure, the binding of IgG‐Deltaext starts to saturate at
cells with increasing Delta. (F) Experimental analysis of Notch reporter activation in individual cells (YFP
production rates) at different levels of mean Delta‐mCherry induction. The green circles correspond to
Figure S4: Calibration of plate bound Delta. Plates were incubated with different concentrations of IgG-Deltaext (see methods for complete protocol). We determined the relationship between the concentration of IgG-Deltaext used during incubation and the amount of IgG-Deltaext actually ad-sorbed to the plate using a fluorescence binding assay. Right after incubation, plates were treated with anti-human-IgG conjugated to Alexa488 (Invitrogen). Fluorescence levels were measured us-ing a plate reader (Wallac 1420, Perkin-Elmer). As seen in the figure, the bindus-ing of IgG-Deltaext starts to saturate at concentrations bigger than 2ug/ml and is well-fit by the Michaelis-Menten curve
Dplate= 1+Dnominal/KDnominal , withK= 2.78 and whereDnominalis the concentration of IgG-Deltaextused
31
Figure S4: Calibration of plate bound Delta. Plates were incubated with different concentrations of IgG‐
Deltaext (see methods for complete protocol). We determined the relationship between the
concentration of IgG‐Deltaext used during incubation and the amount of IgG‐Deltaext actually adsorbed
to the plate using a fluorescence binding assay. Right after incubation, plates were treated with anti‐
human‐IgG conjugated to Alexa488 (Invitrogen). Fluorescence levels were measured using a plate reader
(Wallac 1420, Perkin‐Elmer). As seen in the figure, the binding of IgG‐Deltaext starts to saturate at
cells with increasing Delta. (F) Experimental analysis of Notch reporter activation in individual cells (YFP
32
33
be recycled back after interaction with Notch (See theoretical supplementary for derivation and
parameters). Note that, unlike the simulations based on the mutual inactivation model (Fig. 3H), here
shown) providing evidence that Notch does not induce Delta degradation. Experimental procedure:
Cells were co‐cultured at the indicated ratios and plated at 1x10⁵ cells/ml. Cells were subjected to a 12
Figure S6: Induction at Dplate=0 is small compared to higher Dplatelevels. (A) Filmstrips comparing activation of hN1G4esncells at Dplate=0 and Dplate=1.16µg/ml (Fig. 2B). No induction is observed
at Dplate=0. (B) Filmstrips comparing activation of hN1G4esncells induced with a doxycycline pulse
at Dplate=0 and Dplate=1.16ug/ml (Fig. 2B). Only very few cells are induced in this case compared
34
be recycled back after interaction with Notch (See theoretical supplementary for derivation and
parameters). Note that, unlike the simulations based on the mutual inactivation model (Fig. 3H), here
shown) providing evidence that Notch does not induce Delta degradation. Experimental procedure:
Cells were co‐cultured at the indicated ratios and plated at 1x10⁵ cells/ml. Cells were subjected to a 12
Figure S7: The hN1 cell line also shows an ultrasensitive response. hN1 cells show delayed turn-on in Notch signaling in response to slow decay of Delta-mCherry. Protocol is as described in Fig. 3A.
11 be recycled back after interaction with Notch (See theoretical supplementary for derivation and parameters). Note that, unlike the simulations based on the mutual inactivation model (Fig. 3H), here shown) providing evidence that Notch does not induce Delta degradation. Experimental procedure: Cells were co‐cultured at the indicated ratios and plated at 1x10⁵ cells/ml. Cells were subjected to a 12
36
13
38
15
maximally induce the additional Notch production (supplementary theory section). Only intermediate values of knn change the spatial pattern (i.e. broaden it) without destroying its qualitative shape. Within different cell lineages. Delta‐mCherry concentrations were estimated from total Delta‐mCherry fluorescence levels by assuming linear growth in cell volume during each cell cycle. The Delta‐mCherry
40
Dplate=0 ug/ml Dplate=0.74 ug/ml
hN1G4esn -No-Delta hN1G4esn -NO-Delta
hN1G4esn , No Dox
maximally induce the additional Notch production (supplementary theory section). Only intermediate values of knn change the spatial pattern (i.e. broaden it) without destroying its qualitative shape. Within different cell lineages. Delta‐mCherry concentrations were estimated from total Delta‐mCherry fluorescence levels by assuming linear growth in cell volume during each cell cycle. The Delta‐mCherry
41
maximally induce the additional Notch production (supplementary theory section). Only intermediate values of knn change the spatial pattern (i.e. broaden it) without destroying its qualitative shape. Within different cell lineages. Delta‐mCherry concentrations were estimated from total Delta‐mCherry fluorescence levels by assuming linear growth in cell volume during each cell cycle. The Delta‐mCherry
smoothed and its maximal slope was measured. Black and green points represent the values of individual slopes falling below or above a threshold, respectively. Note that the fraction of activated (green) points, but not their median value, increases over time, consistent with a switch‐like model (Fig. 5e). The threshold value was determined from the early time points where cells are off. A few segments far from the switching point were filtered out, corresponding to saturating fluorescence levels or varying YFP expression at very late times (YFP curves in (b)). Similar filtering did not affect the distribution of trans‐activation rates (Fig S5g). Blue circles represent the medians of the individual above‐threshold (green) slopes in 30 hour bins. Error bars represent the 25th to 75th percentiles of each distribution. Comparison with trans‐Delta distributions (Figs. S5e,f,g) shows that the response to cis‐Delta agrees with a threshold like model.
Figure S14: Initial Delta‐mCherry levels correlate with turn‐on time. (A) Notch signaling response was measured for varying Delta‐mCherry induction levels. The experimental setup was similar to the scheme
Figure S15: Distribution of activated cells at different Dplate shows graded response. Distributions of
hN1G4esn cells after onset of induction (t=50 hours) in Figure 3G. Activated cells (green circles) respond
Figure S16: Effect of finite lifetimes and expression delays in the model. Time traces of Notch (blue), Delta (red), and the reporter (green) obtained from numerical simulations of the cis‐inhibition model.
42
far from the switching point were filtered out, corresponding to saturating fluorescence levels or varying
YFP expression at very late times (YFP curves in (b)). Similar filtering did not affect the distribution of
doxycycline concentrations, as indicated in (B). Increased induction levels correspond to higher Delta‐
mCherry induction (B) and corresponding delays in the turn‐on time (A). When doxycycline is not
removed from the media (darkest green), cells show a negligible response to Dplate. (C) Here, ton was
calculated for the data in (A) and (B). For each Delta‐mCherry induction level (same legend as in (B)),
the Delta‐mCherry fluorescence at the start of the movie (t=0) and at ton are plotted. These data show
that the time of Notch activation, ton, varies with the initial level of Delta‐mCherry expression, but occurs
at an approximately constant Delta‐mCherry concentration, as expected from the experimental scheme
in Fig. 3A. Note that fluorescence levels differ in this figure from those in Fig. S13 due to variations in
optical parameters (e.g. lamp intensity) between the two experiments.
Figure S15: Distribution of activated cells at different Dplate shows graded response. Distributions of
hN1G4esn cells after onset of induction (t=50 hours) in Figure 3G. Activated cells (green circles) respond
19 far from the switching point were filtered out, corresponding to saturating fluorescence levels or varying YFP expression at very late times (YFP curves in (b)). Similar filtering did not affect the distribution of
doxycycline concentrations, as indicated in (B). Increased induction levels correspond to higher Delta‐ mCherry induction (B) and corresponding delays in the turn‐on time (A). When doxycycline is not removed from the media (darkest green), cells show a negligible response to Dplate. (C) Here, ton was
calculated for the data in (A) and (B). For each Delta‐mCherry induction level (same legend as in (B)), the Delta‐mCherry fluorescence at the start of the movie (t=0) and at ton are plotted. These data show
that the time of Notch activation, ton, varies with the initial level of Delta‐mCherry expression, but occurs
at an approximately constant Delta‐mCherry concentration, as expected from the experimental scheme in Fig. 3A. Note that fluorescence levels differ in this figure from those in Fig. S13 due to variations in optical parameters (e.g. lamp intensity) between the two experiments.
Figure S15: Distribution of activated cells at different Dplate shows graded response. Distributions of hN1G4esn cells after onset of induction (t=50 hours) in Figure 3G. Activated cells (green circles) respond
44
far from the switching point were filtered out, corresponding to saturating fluorescence levels or varying
YFP expression at very late times (YFP curves in (b)). Similar filtering did not affect the distribution of
Figure S14: Initial Delta‐mCherry levels correlate with turn‐on time. (A) Notch signaling response was
measured for varying Delta‐mCherry induction levels. The experimental setup was similar to the scheme
shown in Fig. 3A. Cells were grown on fixed Dplate=0.74 ug/ml and subjected to 12 hour pulses of varying doxycycline concentrations, as indicated in (B). Increased induction levels correspond to higher Delta‐
mCherry induction (B) and corresponding delays in the turn‐on time (A). When doxycycline is not
removed from the media (darkest green), cells show a negligible response to Dplate. (C) Here, ton was calculated for the data in (A) and (B). For each Delta‐mCherry induction level (same legend as in (B)),
the Delta‐mCherry fluorescence at the start of the movie (t=0) and at ton are plotted. These data show that the time of Notch activation, ton, varies with the initial level of Delta‐mCherry expression, but occurs at an approximately constant Delta‐mCherry concentration, as expected from the experimental scheme
in Fig. 3A. Note that fluorescence levels differ in this figure from those in Fig. S13 due to variations in
optical parameters (e.g. lamp intensity) between the two experiments.
Figure S15: Distribution of activated cells at different Dplate shows graded response. Distributions of
hN1G4esn cells after onset of induction (t=50 hours) in Figure 3G. Activated cells (green circles) respond
Figure S16: Effect of finite lifetimes and expression delays in the model. Time traces of Notch (blue),
Delta (red), and the reporter (green) obtained from numerical simulations of the cis‐inhibition model.
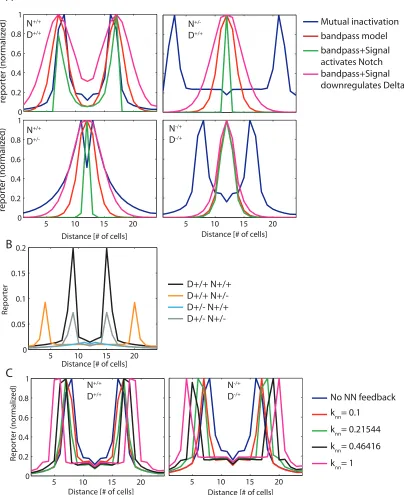
Figure S17: Lateral inhibition model with mutual inactivation (See theoretical supplementary section)
facilitates broader range of patterns. Increasing the strength of mutual inactivation (reduced ݇) enables
21 www.nature.com/nature
SUPPLEMENTARY INFORMATION
doi: 10.1038/nature08959
No mutual
k
c=0.55
k
c=0.1
k
c=0.05
Increasing mutual inactivation
inactivation
Figure S17
9
logarithmic derivative of the Signal with respect to the total amount of Delta at any given time instant, is mostly unchanged. The sensitivity coefficient, shown in the bar plot for the different cases presented in plots A‐C, increases at most 30% for the smallest lifetimes, and is effectively constant in the presence of delay in the reporter expression.
Figure S17: Lateral inhibition model with mutual inactivation (See theoretical supplementary section) facilitates broader range of patterns. Increasing the strength of mutual inactivation (reduced ݇) enables patterning (second panel), as well as the formation of alternative patterns in which cells with high Delta levels can stably co‐exist next to each other (third and fourth panels). Such alternative patterns cannot be achieved using standard lateral inhibition model (even in the presence of cooperative feedback).
‐‐‐‐‐‐‐‐‐‐‐‐‐‐‐‐‐‐‐‐‐‐‐‐‐‐‐‐‐‐‐‐‐‐‐‐‐‐‐‐‐‐‐‐‐‐‐‐‐‐‐‐‐‐‐‐‐‐‐‐‐‐‐‐‐‐‐‐‐‐‐‐‐‐‐‐‐‐‐‐‐‐‐‐‐‐‐‐‐‐‐‐‐‐‐‐‐‐‐‐‐‐‐‐‐‐‐‐‐‐‐‐‐‐‐‐‐‐‐‐‐‐‐‐‐‐‐‐‐‐‐‐‐
Supplementary Movies
Movie S1: Trans‐activation of hN1G4esn by plate bound Delta. Movie used to generate filmstrip in Fig. 2B.
Movie S2: Effect of cis‐Delta on hN1G4esn activation. Movie used to generate filmstrip in Fig. 3B.
Movie S3: Trans‐activation of hN1G4esn‐No‐Delta by co‐culture with Delta‐expressing cells. Movie used
to generate filmstrip in Fig S5.
46
Supplementary Methods
Description of genetic constructs
All genetic constructs used in this paper were constructed using standard cloning and PCR
tech-niques. All constructs were fully sequenced and the maps, sequences and construction details are
available upon request. We provide below a description of the sources for vectors and DNA fragments
used, as well as the main construction steps.
Reporter plasmids pEV-UAS-H2B-Citrine and pEV-12xCSL-H2B-Citrine were constructed as
follows: The backbone vector pEV was constructed in the lab by amplifying pSecTagA without the
secretion tag Murine Ig kappa-chain V-J2-C (Invitrogen, V900-20) and religating it with the SacII
restriction site. The UAS-H2B-citrine and 12xCSL-H2B-Citrine were amplified or subcloned from
earlier constructs and they contain the following DNA fragments: H2B-citrine originally obtained
from pCS H2B citrine (a gift from Sean Megason and Scott Fraser[4]). UAS was obtained from
ULyn-GFP (a gift from Scott Fraser[5]). 12xCSL was amplified from 12xCSL DsRedExpress (a gift
from Urban Lendahl[6]).
pcDNA3-hN1-mod1 was constructed by first adding an NheI site to pcDNA3 hN1 (a gift from
Jon Aster[7]). To add this NheI site we amplified the DNA fragment between the NotI to the
XhoI site and included the NheI site in the reverse primer. The resulting amplicon was ligated into
pcDNA3-hNI cut with the same restriction sites. This modified plasmid was then used to create
pcDNA3-hN1-mCherry by inserting mCherry originally amplified from pFA6-link-mcherry-SpHis5
(a gift from Roger Tsien and Kurt Thorn[8,9]) into the NheI and XhoI sites.
pcDNA3-hNECD-Gal4esn was constructed by cutting pcDNA3-hN1-mod1 withNotI and XhoI to remove hNICD. Gal4esnwas constructed by PCR amplification fromSaccharomyces cerevisiae as described in Ptashne et al [10]. Gal4esn amplified with NotI andSalI restriction sites was inserted into the cut vector in the sites above. We note here that Gal4esn was chosen over the more popular
Gal4-VP1