ELECTROCATALYSIS IN SOLID ACID FUEL CELLS
Thesis by Mary WC Louie
In Partial Fulfillment of the Requirements for the degree of
Doctor of Philosophy
California Institute of Technology Pasadena, California
2011
2011
Acknowledgements
This work would not have been possible without financial support from the National Science Foundation (NSF), DMR-0906543, and from the Caltech Center for the Science and Engineering of Materials, an NSF Materials Research Science and Engineering Center (DMR-0520565). Additional funding has been provided by the Gordon and Betty Moore Foundation (via the Caltech Center for Sustainable Energy Research) and by the Department of Defense Multidisciplinary University Research Initiative (W911NF-07-1-0410) administered by the Army Research Office. I have been fortunate enough to be supported by the NSF Graduate Research Fellowship Program, the Baker Hughes Scholarship from the Society of Women Engineers, and the Ludo Frevel Crystallography Scholarship from the International Center for Diffraction Data.
I am grateful to my thesis advisor, Professor Sossina Haile, who has been a wonderful mentor both professionally and personally. She works tirelessly to provide all the resources her group members need to be productive, and all the while, her office door is always open and her patience, endless. I have always left her office with more clarity than when I entered. For these reasons, I owe a great portion of graduate career to Sossina.
I thank my thesis committee members, Professors Kaushik Bhattacharya, Konstantinos Giapis and William Goddard. Professor Bhattacharya first exposed me to the theory of martensite in ME260, and since then, I have had a good deal of fun pondering the implications of crystallographic compatibility on solid acid compounds. I have also shared many projects with Professor Giapis, including microplasmas and electrosprays. I thank him for the advice and support he has given me throughout the years. I would also like to acknowledge Professor David Goodwin for his time as a member of my candidacy committee.
There are many individuals to whom I owe my gratitude for their contributions to my research at Caltech. I am grateful to Calum Chisholm for our exchanges about anything and everything related to solid acid fuel cells and for his enthusiasm and energy. I thank Yoshihiro Yamazaki for our discussions on hydrogen transport and for letting me “borrow” his textbooks. Ayako Ikeda has been an invaluable resource; I thank her for the information she provides me regarding the stability of solid acid compounds. For the AFM work, Brian Sayers and Shijie Wu assisted a great deal with troubleshooting and instrumentation. I also would like to acknowledge Mikhail Kislitsyn for his work on the structural and thermal characterization of CRDP compounds, as well as Diana Smirnova and Manuj Swaroop who worked on initial twinning calculations for CDP in ME260.
years but also made our office fun. I am grateful to David Boyd for discussions and help with oxygen plasmas and Raman spectroscopy, Yong Hao for point electrode calculations, and Ali Saramat for our collaboration on nanoparticle synthesis. Peter Babilo never hesitated to offer a confused first-year student a helping hand in the lab. Nick Brunelli was a patient teacher; I am grateful to him for our many discussions early in my graduate career. I cannot thank William Chueh and Wei Lai enough for their many,
many (somewhat underappreciated) hours spent writing LabVIEW programs from which the Haile group benefits on a daily basis. I would also like to acknowledge the hard work of the undergraduate students who have worked with me over the years: Tewodros Mamo, Helen Telila, Lauren Baranowski, Sarah Howell, and Xiuyuan Li.
The Haile lab is great group to work with; every member has always been ready to lend a hand to others. I also cannot forget the supportive staff on campus, including Rosie Sanchez, Kathy Bubash, Fenton Harvey, Fran Matzen, Irene Loera, Mike Vondrus, Mike Roy, Rick Gerhart and Rick Germond.
me advice; at times, I think she knows me better than I do. And finally, Lisa Cowan is a dear friend, without whom I would not have survived my early years here.
I consider myself lucky to have entered Caltech with a great chemical engineering class; they managed to make my first year of classes and exams, I dare say, fun. In particular, Yvonne Chen, Diana Smirnova, and Havala Pye have become my good friends. I will miss our girls’ game nights, not to mention repeatedly losing to Yvonne in bowling. Also, Diana kept me sane with our long runs and long conversations. Yvonne was my roommate for almost three years and is like a sister to me; to this day, she lends her patient ear for my ramblings.
I was fortunate enough to befriend many wonderful individuals: Puneet Chhabra, Glenn Garrett, Amy Fu, Peter Agbo, Arthur Chan, Eric Olmon, Chethana Kulkarni, Andrew Metcalf, and Nick Heinz. I also have not forgotten Alem and Hanu who always manage to put a smile on my face.
Abstract
Solid state electrochemical reactions play a crucial role in many energy conversion devices, yet the pathways of many reactions remain unknown. The elusiveness of the reaction mechanisms is due, in part, to the complexity of electrochemical reactions; because electrochemical reactions require the interaction of many species (e.g., ions, electrons, and adsorbates) across multiple phases (e.g., electrolyte, catalyst, and gas phases), elucidation of the reaction pathway can quickly become complicated. In this work, we develop and utilize model catalyst | electrolyte systems, that is, structures of reduced complexity, to study electrode reactions in solid acid fuel cells which operate at intermediate temperatures of ~ 250 ºC. We employ AC impedance spectroscopy to explore the reaction pathway for hydrogen electro-oxidation over Pt thin films sputter-deposited atop the proton-conducting solid acid electrolyte CsH2PO4. We observed that hydrogen electro-oxidation occurs by diffusion of hydrogen through Pt, taking advantage of the entire Pt | CsH2PO4 interfacial area rather than being confined to the triple-phase sites. This insight opens up new avenues for developing high performance electrodes with low Pt loadings by eliminating the requirement that Pt-based electrodes be comprised of high triple-phase site densities long considered to be critical for Pt electrocatalysis. Indeed, even for flat, planar electrodes of very thin Pt films, we obtained a Pt utilization that is significantly higher than in typical composite electrodes.
voltammetry and AC impedance spectroscopy. Not only did we find the electrochemical activity for oxygen electro-reduction to vary dramatically across the electrolyte surface but the current-voltage data, when analyzed in the Butler-Volmer framework, exhibited a strong counter-correlation between two key kinetic parameters, the exchange coefficient and exchange current. Specifically, the exchange current spanned five orders of magnitude while the exchange coefficient ranged between 0.1 and 0.6. Such a correlation has not been observed before and points to the power of atomic force microscopy for electrochemical characterization at electrolyte | metal | gas boundaries in general.
Table of Contents
Chapter 1 Introduction………... ... 1
1.1 Overview ... 1
1.2 Fuel Cells ... 1
1.2.1 Fuel Cell Basics ... 2
1.2.2 Overpotentials in Fuel Cells ... 4
1.2.3 Component Requirements ... 6
1.2.4 Types of Fuel Cells ... 8
1.3 Solid Acid Fuel Cells ... 10
1.3.1 Solid Acid Compounds ... 10
1.3.2 CsH2PO4 as an Electrolyte: Benefits and Challenges ... 13
1.3.3 Solid Acid Fuel Cell Performance ... 16
1.4 Electrode Reactions in Solid Acid Fuel Cells ... 17
1.4.1 Hydrogen Electro-oxidation and Oxygen Electro-reduction ... 17
1.4.2 Electrochemical Reaction Pathways ... 18
Chapter 2 Experimental Methods………. ... 22
2.1 AC Impedance Spectroscopy ... 22
2.1.1 Basic Principles ... 22
2.1.2 Data Analysis: Equivalent Circuit Models ... 26
2.1.3 Data Analysis: Physical Models ... 32
2.1.4 Experimental Corrections ... 34
2.2 Potential Sweep (DC) Methods ... 35
2.4 Scanning Probe Microscopy for Electrochemistry ... 38
2.4.1 Atomic Force Microscopy ... 39
2.4.2 Electrical Atomic Force Microscopy ... 42
2.5 Cell Geometries for Probing Solid State Electrochemistry ... 43
2.5.1 Symmetric vs. Asymmetric Gas Environments ... 43
2.5.2 Electrode Symmetry and Geometry ... 46
2.5.3 Electrode Microstructure ... 50
2.6 Solid Acid Compounds for Electrode Studies: Challenges ... 51
2.6.1 Water Solubility ... 51
2.6.2 Mechanical Properties ... 52
2.6.3 Superprotonic Phase Transition ... 52
2.6.4 Thermal and Chemical Stability ... 54
Chapter 3 Hydrogen Electro-oxidation over Thin Film Pt Electrodes ... 55
3.1 Introduction ... 56
3.2 Experimental ... 57
3.2.1 Sample Preparation ... 57
3.2.2 Characterization ... 58
3.3 Results and Discussion ... 61
3.3.1 Film Morphology and Structure ... 61
3.3.2 Impedance Response: Effect of Platinum Film Dimension ... 65
3.3.3 Impedance Response: Impact of Gold Overlayers ... 70
3.3.4 Diffusion Analysis ... 71
3.3.5 Ultra-thin Platinum Films ... 74
3.4 Implications for Electrode Design ... 76
Chapter 4 Oxygen Electro-reduction at Nano-Pt | CsHSO4 ... 80
4.1 Introduction ... 82
4.2 Experimental ... 85
4.2.1 Half-cell Fabrication ... 85
4.2.2 Experimental Conditions ... 86
4.2.3 Measurement Conditions ... 87
4.2.4 Data Analysis ... 88
4.3 Results and Discussion ... 89
4.3.1 Cyclic Voltammetry ... 89
4.3.2 Impedance Spectroscopy ... 92
4.3.3 Analysis of Oxygen Electro-reduction Kinetics ... 96
4.3.4 Heterogeneity of Electrochemical Kinetics ... 100
4.4 Summary ... 105
Chapter 5 Phase Transformation Hysteresis in Solid Acid Compounds ... 107
5.1 Introduction ... 109
5.2 Theory of Crystallographic Compatibility ... 111
5.3 Experimental ... 116
5.3.1 Synthesis and Fabrication ... 116
5.3.2 Characterization ... 117
5.3.3 Determination of Eigenvalues ... 119
5.4 Results and Discussion: Cs1–xRbxH2PO4 ... 119
5.4.1 Phase and Chemical Characterization ... 119
5.4.2 Conductivity and Phase Transformation Hysteresis ... 123
5.5 Results and Discussion: Microstructure of CsH2PO4 and CsHSO4 ... 128
5.5.1 Microcrack Formation ... 128
5.5.2 Microstructure of Single-crystal Surfaces ... 130
5.5.3 In situ Imaging of CsHSO4 ... 134
5.6 Summary and Outlook ... 138
Appendix A Derivations………... ... 141
A.1 Kinetics of Electrode Reactions: Butler-Volmer Equation ... 141
A.2 Finite-Length Warburg with Reversible Bounds ... 146
A.3 Reaction Mechanism ... 152
A.3.1 Hydrogen Adsorption as a Rate-Limiting Step ... 154
A.3.2 Hydrogen Absorption as a Rate-Limiting Step ... 155
A.3.3 Hydrogen Diffusion as a Rate-Limiting Step ... 156
A.3.4 Charge Transfer as a Rate-Limiting Step ... 157
Appendix B Reactivity of Candidate Electrocatalysts with CsH2PO4 ... 158
B.1 Motivation ... 158
B.2 Experimental ... 160
B.2.1 Sample Preparation and Heat Treatment ... 160
B.2.2 Characterization ... 160
B.3 Results and Discussion ... 160
Appendix C Platinum Thin Film Anodes………. ... 164
C.1 Experimental Setup ... 164
C.2.1 Before and After Electrochemical Characterization ... 165
C.2.2 Film Structure and Impedance Response of Sub-5 nm Films ... 168
C.2.3 Mechanical Integrity: 375 nm vs. Sub-8 nm Films ... 172
C.2.4 Effect of Mechanical Pressure from Current Collector ... 175
C.3 Non-electrode Impedance Responses ... 177
C.3.1 Origin of Spurious Electrical Effects ... 177
C.3.2 Appearance of Constriction Effect ... 178
C.3.3 Evidence of Constriction Effect ... 180
C.4 Layered Pt-Au Film Electrodes ... 183
C.5 Electrolyte Effects: Cs0.25Rb0.75H2PO4 vs. CsH2PO4 ... 188
C.5.1 150 nm Platinum Films ... 189
C.5.2 7.5 nm Platinum Films ... 191
C.6 Effect of Environmental Parameters ... 193
C.7 Role of the Superprotonic Phase Transition in Electrode Kinetics ... 199
C.7.1 Temperature Dependence ... 199
C.7.2 Platinum Film Geometry Dependence ... 201
C.7.3 Temperature Cycling and Crack Formation ... 202
Appendix D Hydrogen Electro-oxidation over Palladium Thin Films ... 207
D.1 Experimental ... 207
D.2 Results and Discussion ... 209
D.2.1 Palladium Film Characteristics ... 209
D.2.2 Characteristics of Impedance Spectra ... 214
D.2.3 Effect of Palladium Film Geometry ... 216
D.2.4 Effect of Environmental Parameters ... 217
D.2.6 10 nm Palladium Films ... 221
D.2.7 Comparison to Platinum ... 222
D.3 Summary ... 223
D.4 Recommendations for Future Studies ... 224
Appendix E Nickel Thin Films ... 225
Appendix F Pt | CsHSO4 by Atomic Force Microscopy ... 229
F.1 Experimental Details ... 229
F.1.1 Instrumentation and Setup ... 229
F.1.2 Sample Heating ... 230
F.2 Data Analysis ... 232
F.2.1 Open- and Short-Circuit Corrections ... 232
F.2.2 Measurement Stability ... 236
F.2.3 Analysis of Cyclic Voltammograms ... 238
F.2.4 Effect of Force on Electrochemical Measurements ... 239
F.3 Nano-Pt | CsHSO4 vs. Wire-Pt | CsH2PO4 ... 240
F.4 Platinum Oxide Reduction at Pt | CsHSO4 ... 242
F.4.1 Experimental ... 242
F.4.2 Results and Discussion ... 243
F.5 Oxygen Electro-Reduction at Pt | Single-crystal CsHSO4 ... 246
F.5.1 Experimental ... 246
F.5.2 Results and Discussion ... 249
Appendix G Pt | Ba3–xKxHx(PO4)2 by Atomic Force Microscopy ... 254
G.1 Introduction ... 254
G.3 Results and Discussion ... 257
G.3.1 Ba3–xKxHx(PO4)2 Characteristics ... 257
G.3.2 Fabrication of Microscale Ba3–xKxHx(PO4)2 Half-cells ... 258
G.3.3 Oxygen Electro-reduction at Pt | Ba3–xKxHx(PO4)2 ... 261
G.3.4 Troubleshooting ... 264
G.4 Recommendations for Future Studies ... 266
Appendix H Pd | CsHSO4 by Atomic Force Microscopy ... 268
H.1 Experimental ... 268
H.2 Results and Discussion ... 269
H.2.1 Oxygen Electro-reduction ... 269
H.2.2 Transient Behavior of Pd | CsHSO4 ... 274
H.2.3 Palladium Oxidation ... 276
H.2.4 Stability of Pd | CsHSO4 ... 277
H.3 Summary ... 278
Appendix I Crystallographic Compatibility in Cs1–xRbxH2PO4 ... 280
I.1 Visualization of the Cubic-to-Monoclinic Transformation in CsH2PO4 ... 280
I.2 Calculation of Transformation Matrix ... 282
I.3 Calculation of Compatible Variant Pairs: Twinning Modes ... 283
I.4 Calculation of the Austenite-Martensite Interface ... 285
I.5 Results for CsH2PO4 ... 287
Appendix J Microstructure of Solid Acid Compounds: Supplemental ... 292
J.1 Additional Images ... 292
Appendix K Pt | CsH2PO4 | Au as a Mixed Potential Hydrogen Sensor ... 294
K.1 Introduction ... 294
K.3 Experimental ... 297
K.4 Results and Discussion ... 298
K.4.1 Sensor Response ... 298
K.4.2 Variability in the Sensor Response ... 303
K.5 Summary and Recommendations ... 304
List of Figures
Figure 1.1 Schematic of a fuel cell based on a proton-conducting electrolyte ... 3
Figure 1.2 Fuel cell polarization curve and overpotentials. ... 5
Figure 1.3 Schematic of a typical composite electrode ... 8
Figure 1.4 Arrhenius plot of proton conductivity showing the superprotonic phase transition of select solid acid compounds ... 11
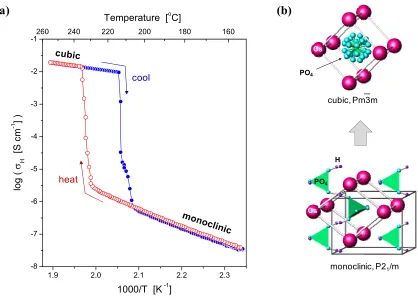
Figure 1.5 Superprotonic phase transition in CsH2PO4: Proton conductivity and corresponding unit cells. ... 12
Figure 1.6 Proton conduction mechanism in CsH2PO4. ... 13
Figure 1.7 Cartoon of triple-phase boundary pathways. ... 19
Figure 1.8 Comparison of triple-phase and two-phase boundary pathways ... 21
Figure 2.1 Basics of AC impedance ... 25
Figure 2.2 Nyquist representation of impedance response. ... 25
Figure 2.3 Depiction of ion movement due to an alternating electric field ... 26
Figure 2.4 Impedance spectrum for three serial RC sub-circuits and comparision of RQ and RC response... 30
Figure 2.5 Equivalent circuit for three serial electrochemical ... 31
Figure 2.6 Schematic for Warburg diffusion ... 33
Figure 2.7 Potential profile for cyclic voltammetry ... 36
Figure 2.8 Cyclic voltammograms for some common circuit elements ... 37
Figure 2.9 Atomic force micoscope probes: tip and cantilever description ... 40
Figure 2.10 Operation of atomic force microscopy. ... 41
Figure 2.12 Electrode geometries for solid state electrochemical measurements ... 48
Figure 2.13 Requirements of asymmetric electrode geometries ... 49
Figure 2.14 Different electrode microstructures for a catalyst-electrolyte system ... 51
Figure 2.15 Fuel cell open-circuit voltage with temperature cycling ... 53
Figure 3.1 XRD pattern of Pt film on a CsH2PO4 substrate ... 61
Figure 3.2 Representative SEM micrographs of Pt films. ... 63
Figure 3.3 Schematic of the Pt | CsH2PO4 | Pt system ... 63
Figure 3.4 SEM micrographs of Pt grain size for various film thicknesses. ... 64
Figure 3.5 XRD patterns showing correlation of grain size with Pt film thickness ... 65
Figure 3.6 Impedance spectra for Pt film electrodes of different thicknesses ... 66
Figure 3.7 Plots of Pt film electrode resistance as a function of film geometry ... 68
Figure 3.8 Dependence of pH2 reaction order and activation energy on film thickness ... 69
Figure 3.9 Schematic of the Au | Pt | CsH2PO4 | Pt | Au cell ... 71
Figure 3.10 Impedance spectra: Au | Pt | CsH2PO4 | Pt | Au vs. Pt | CsH2PO4 | Pt ... 71
Figure 3.11 Extracted hydrogen diffusivity as a function of film ... 74
Figure 3.12 Area-normalized electrode resistance of Pt films as function of thickness ... 76
Figure 4.1 Schematic of nano-electrode setup using an atomic force microscope .... 83
Figure 4.2 Cyclic voltammograms: Au | CsHSO4 vs. Pt | CsHSO4 ... 90
Figure 4.3 AC impedance spectra for Pt | CsHSO4 as a function of overpotential .... 93
Figure 4.4 Impedance spectra for Pt | CsHSO4 at –1.0 and –0.9 V ... 93
Figure 4.6 Tafel plot for Pt | CsHSO4. ... 98
Figure 4.7 Image of typical CsHSO4 surface by SEM and AFM ... 101
Figure 4.8 Tafel plots and extracted i0 and α values as a function of position ... 103
Figure 4.9 Semi-log plot of i0 as a function of α, showing correlation ... 103
Figure 5.1 Schematic of austenite-to-martensite transformation for CsH2PO4 ... 113
Figure 5.2 Room temperature XRD patterns of Cs1–xRbxH2PO4 ... 120
Figure 5.3 XRD patterns for CsH2PO4 as a function of temperature ... 122
Figure 5.4 Thermal expansion of CsH2PO4: lattice parameters and cell volume ... 122
Figure 5.5 Temperature dependence of the proton conductivity of CsH2PO4 ... 124
Figure 5.6 Reproducibility of Cs1–xRbxH2PO4 upon repeated temperature cycling . 124 Figure 5.7 Phase transition temperature and hysteresis width as functions of Rb content. ... 126
Figure 5.8 Middle eigenvalue, λ2, as a function of Rb content, and hysteresis width as a function of λ2. ... 127
Figure 5.9 SEM images of cracks in CsH2PO4 and CsHSO4 after heat treatment ... 129
Figure 5.10 Optical clarity of CsH2PO4 and CsHSO4 crystals after heat treatment. .. 129
Figure 5.11 SEM images of polished CsH2PO4 crystal before and after heat treatment. ... 131
Figure 5.12 SEM images of fractured CsH2PO4 crystal before and after heat treatment ... 131
Figure 5.13 SEM images of fractured CsH2PO4 crystal after heat treatment ... 131
Figure 5.15 SEM images of polished CsHSO4 crystal before and after heat treatment. ... 133 Figure 5.16 Topography of fractured CsHSO4 crystal at elevated temperatures ... 135 Figure 5.17 Topography of fractured CsHSO4 crystal as function of temperature. ... 137 Figure 5.18 Plot of phase transition hysteresis as a function of middle eigenvalue
and volume change for three classes of solid acid compounds. ... 140
Figure A.1 Effect of potential on free energy profiles for charge transfer reaction .. 143
Figure A.2 Effect of exchange current on the current-overpotential behavior. ... 145
Figure A.3 Warburg diffusion: schematic of diffusion of species through a film .... 147
Figure A.4 Two-phase boundary pathway for hydrogen electro-oxidation. ... 153
Figure B.1 Plot of Gibbs free energy for metal oxide formation at 240 ºC in air for various metal oxides. ... 159
Figure B.2 Plot of Gibbs free energy of select metal carbides and nitrides in air at 240 ºC ... 163
Figure C.1 Drawing of test station for symmetric cell measurements. ... 165
Figure C.2 SEM micrographs of 375 nm Pt films on top of CsH2PO4 before and after electrochemical characterization. ... 166
Figure C.3 SEM micrographs of 75 nm Pt films on top of CsH2PO4 before and after electrochemical characterization ... 167
Figure C.4 SEM micrographs of 7.5 nm Pt films on top of CsH2PO4 before and after electrochemical characterization. ... 167
Figure C.6 SEM micrographs of sub-5 nm thin Pt films before and after electrochemical characterization ... 170
Figure C.7 Nyquist spectra for 1.5, 3, and 4.5 nm thick Pt films and the corresponding area-normalized electrode resistances in comparison to thicker films ... 171
Figure C.8 SEM micrographs of the undersides of as-deposited 4.5 and 7.5 nm Pt films ... 174
Figure C.9 SEM micrographs of the undersides of as-deposited 1.5, 3, and 4.5 nm Pt films. ... 174
Figure C.10 Cross-section image showing delamination of an intact 375 nm Pt film from CsH2PO4 ... 174 Figure C.11 SEM micrographs of a 375 nm Pt film deposited onto CsH2PO4, after
electrochemical testing, showing buckling ... 175
Figure C.12 Pt film quality, after electrochemical characterization, as a function of film thickness and mechanical pressure applied to the cell ... 176
Figure C.13 The constriction effect: ion movement at various frequencies. ... 178
Figure C.14 Impedance spectra: Solartron 1250 vs. 1260 FRA. ... 180
Figure C.15 Representative impedance spectra for a Pt | CsH2PO4 | Pt showing no effect of pH2 on ohmic offset and high frequency arc. ... 182
Figure C.16 Temperature dependence of the ohmic offset and the width of the high frequency arc ... 183
Figure C.17 Impedance response of Pt-Au layered thin film electrode system ... 185
Figure C.18 Impedance spectra of a Au | CsH2PO4 | Au symmetric cell ... 188 Figure C.19 Nyquist plot for 150 nm Pt films on CsH2PO4 and Cs0.25Rb0.75H2PO4
Figure C.20 Nyquist plots for 7.5 nm Pt films on CsH2PO4 and Cs0.25Rb0.75H2PO4 electrolytes ... 193
Figure C.21 pH2 and pH2O dependence plots for Pt | CsH2PO4 | Pt (75 nm). ... 196
Figure C.22 pH2 and pH2O dependence plots for Pt | CsH2PO4 | Pt (7.5 nm). ... 196 Figure C.23 Arrhenius behavior of Pt | CsH2PO4 | Pt (75 nm) ... 198 Figure C.24 Arrhenius behavior of Pt | CsH2PO4 | Pt (7.5 nm) ... 198
Figure C.25 Pt | CsH2PO4 | Pt across the phase transition: plot of cell temperature and resistance as functions of time, and corresponding Arrhenius plot. 200
Figure C.26 Dependence of electrode resistance on film geometry below the phase transition temperature ... 202
Figure C.27 Effect of the superprotonic phase transition on cracking in polycrystalline CsH2PO4 discs, with application of mechanical pressure ... 203
Figure C.28 The effect of the superprotonic phase transition on cracking in polycrystalline CsH2PO4 discs without application of mechanical pressure applied ... 204
Figure C.29 Impedance spectra for Pt | CsH2PO4 | Pt symmetric cells (7.5 and 150 nm Pt) before and after a cool-heat cycle through the phase transition. ... 206
Figure C.30 Effect of thermal cycling on the impedance response of Pt | CsH2PO4 | Pt symmetric cell ... 206
Figure D.1 XRD pattern of 100 nm Pd films on top of CsH2PO4 before and after electrochemical characterization ... 210
Figure D.2 SEM images of the cross sections of Pd | CsH2PO4 | Pd cells. ... 210 Figure D.3 SEM micrographs of 10 nm Pd films deposited on top of CsH2PO4
Figure D.4 SEM micrographs of 100 nm Pd films deposited on top of CsH2PO4 before and after electrochemical characterization ... 212
Figure D.5 SEM micrographs of 100 nm Pd films deposited on top of CsH2PO4: lateral variation in film structure ... 213
Figure D.6 Impedance spectrum for a Pd | CsH2PO4 | Pd cell (100 nm Pd films) .... 214 Figure D.7 Equivalent circuit model for the Pd | CsH2PO4 | Pd symmetric cell. ... 215 Figure D.8 Select impedance spectra for 100, 200, and 300 nm thick Pd films ... 216
Figure D.9 Plots of the electrode resistances as functions of film diameter. ... 217
Figure D.10 Plots of the area-normalized electrode resistances as functions of film thickness. ... 217
Figure D.11 Representative plots for extracting pH2 reaction order and activation energy ... 218
Figure D.12 Impedance spectra for the Pd-Au thin film system: Pd | CsH2PO4, Au | Pd | CsH2PO4, and Pd | Au | CsH2PO4. ... 221
Figure D.13 Impedance spectra for Pd | CsH2PO4 | Pd cell (10 nm Pd films). ... 222
Figure E.1 SEM micrographs of Ni films deposited on top of CsH2PO4 before and after electrochemical characterization ... 226
Figure E.2 Images of 100 nm Ni films after heat treatment compared to those after electrochemical characterization ... 227
Figure E.3 XRD patterns of 100 nm Ni films on top CsH2PO4 before and after testing. ... 228
Figure E.4 XRD patterns of as-deposited 400 nm Ni films on top CsH2PO4 fabricated by thermal evaporation and by sputter deposition. ... 228
Figure F.1 Photographs of experimental setup for electrochemical AFM. ... 230
Figure F.3 Analysis of the temperature gradient across CsHSO4 in AFM ... 232
Figure F.4 Illustration of how stray capacitance affects two arbitrary processes. .... 233
Figure F.5 Open-circuit impedance response as a function of the current range selected in instrumentation ... 234
Figure F.6 Representative Nyquist and Bode-Bode plots before and after open-circuit correction. ... 235
Figure F.7 Short-circuit measurement for a Pt-coated AFM probe in contact with Au foil ... 236
Figure F.8 AFM image of a CsHSO4 surface: effect of thermal drift ... 237
Figure F.9 Measurement stability: two impedance spectra collected with frequency sweeps in opposite directions ... 238
Figure F.10 Cyclic voltammograms for Pt | CsHSO4 at various scan rates and the corresponding α values ... 239
Figure F.11 Effect of force and of probe withdrawal/reapproach on cyclic voltammograms for Pt | CsHSO4. ... 240
Figure F.12 i0-α correlation: Pt | CsHSO4 vs. Pt | CsH2PO4 ... 242
Figure F.13 Pt oxide reduction peak as a function of chemical and electrochemical oxidation time ... 245
Figure F.14 Pt oxide reduction peak voltage, current and area as a function of chemical and electrochemical oxidation time. ... 246
Figure F.15 Cyclic voltammograms for a Pt probe in contact with as-grown CsHSO4 single-crystal surface ... 248 Figure F.16 Cyclic voltammograms for a Pt probe in contact with single-crystal
CsHSO4, contaminated with acidic solution ... 249
Figure F.18 Tafel plots for Pt | fractured CsHSO4 and i0-α correlation ... 251
Figure F.19 AFM topography image of a single-crystal CsHSO4 surface ... 253
Figure F.20 AFM images of CsHSO4 crystal surfaces showing damage caused by probe ... 253
Figure G.1 Schematic of experimental setup for electrochemical AFM measurements of Ba3–xKxHx(PO4)2 electrolytes. ... 257 Figure G.2 SEM images: Ba3–xKxHx(PO4)2 powder vs. CsHSO4 powder ... 258 Figure G.3 SEM images of Ba3–xKxHx(PO4)2 platelets on a Pt-coated Si wafer ... 259
Figure G.4 SEM images showing wafer-to-wafer transfer of Ba3–xKxHx(PO4)2 platelets ... 261
Figure G.5 Electrochemical AFM measurements at Pt | Ba3–xKxHx(PO4)2 and corresponding cyclic voltammograms ... 262
Figure G.6 Cyclic voltammograms for Pt | Ba3–xKxHx(PO4)2 obtained by wafer-to-wafer platelet transfer ... 263
Figure G.7 Short-circuit measurements on Pt-coated silicon wafer ... 264
Figure G.8 Raman spectrum for Ba3–xKxHx(PO4)2 platelets deposited on Si wafer . 266 Figure H.1 Cyclic voltammograms and impedance spectra for nano-Pd | CsHSO4 . 270 Figure H.2 Electrode resistances plotted as functions of overpotential, and Tafel
plot for the Pd | CsHSO4 system ... 272
Figure H.3 Variation of Tafel plot with position across a CsHSO4 surface ... 273
Figure H.4 i0-αcorrelation: Pd | CsHSO4 vs. Pt | CsHSO4 ... 273
Figure H.5 Polycrystalline CsHSO4 damaged by AFM probe ... 274
Figure H.6 Transient features in the cyclic voltammograms of Pd | CsHSO4 ... 275 Figure H.7 Behavior of reduction peaks in Pd | CsHSO4 as a function of chemical
Figure H.8 Spatial (and time) dependence of Pd | CsHSO4 response ... 278
Figure I.1 Visualization of the phase transformation in CsH2PO4 ... 281
Figure I.2 Schematic of parallel twins separating two alternating variants ... 284
Figure I.3 Schematic of the interface between austenite and two variants of martensite ... 286
Figure J.1 SEM images of CsH2PO4 crystal before and after heat treatment ... 292
Figure J.2 SEM images of a polished CsH2PO4 crystal after heat treatment ... 292
Figure J.3 Twins in CsHSO4: SEM image after heat treatment and AFM image at superprotonic conditions. ... 293
Figure K.1 Schematic polarization curves for determining mixed potentials in Au | CsH2PO4 | Pt hydrogen sensor ... 296 Figure K.2 Plot of open-circuit voltage as a function of time for a
Pt | CsH2PO4 | Au sensor at 235 ºC for various pH2 ... 299 Figure K.3 Mixed potential response of Pt | CsH2PO4 | Au sensor at 235 ºC
plotted against pH2 ... 300 Figure K.4 Schematic showing how mass transport effects can result in a large
change in mixed potential for a small change in gas composition.. ... 301 Figure K.5 Mixed potential response of multiple Pt | CsH2PO4 |Au sensors at
235 ºC plotted against pH2.. ... 302 Figure K.6 Plot of open-circuit voltage as a function of time for a
List of Tables
Table 1.1 Common fuel cell types and their primary characteristics ...9
Table 2.1 Impedance response of frequently encountered circuit elements. ...27
Table 2.2 Impedance response of frequently encountered sub-circuits. ...28
Table 2.3 Impedance response for bounded and unbounded Warburg diffusion ...33
Table 3.1 Experimentally-determined parameters for hydrogen transport in Pt ...74
Table 3.2 Comparison of platinum-based anodes for solid acid fuel ...79
Table 4.1 Conducting AFM probes employed in this study ...88
Table 5.1 Lattice parameters and chemical compositions for Cs1–xRbxH2PO4 ...120
Table 5.2 Thermal expansion parameters for CsH2PO4 ...123
Table B.1 Reactivity of CsH2PO4 with metal oxides at 150 ºC and 240 ºC ...162 Table B.2 Reactivity of CsH2PO4 with metal nitrides and carbides at 240 ºC. ...163 Table C.1 Summary of parameters extracted from the low frequency arc generated
by addition of Au films to the Pt | CsH2PO4...186 Table C.2 Comparison of fitted parameters for 150 nm Pt films on CsH2PO4 and
Cs0.25Rb0.75H2PO4. ...191 Table C.3 Comparison of fitted parameters for 7.5 nm Pt films on CsH2PO4 and
Cs0.25Rb0.75H2PO4. ...193 Table C.4 pH2 and pH2O dependences of electrolyte-related processes. ...194 Table D.1 Pd thin films: area-normalized resistance, pH2 and pH2O reaction order
Table I.4 Allowed twinning modes of CsH2PO4 martensite ...289 Table I.5 CsH2PO4 martensite variant pairs that can form an interface with the
List of Acronyms
ACIS alternating current impedance spectroscopy AFC alkali fuel cell
AFM atomic force microscopy
BKHP barium potassium hydrogen phosphate, Ba3–xKxHx(PO4)2 CDP cesium dihydrogen phosphate, CsH2PO4
CHS cesium hydrogen sulfate, CsHSO4
CRDPn cesium rubidium dihydrogen phosphate, Cs1–xRbxH2PO4, where n = 100x CV cyclic voltammetry
dFLW distributed finite-length Warburg EDS energy dispersive spectroscopy FRA frequency response analyzer MCFC molten carbonate fuel cell OCV open-circuit voltage PAFC phosphoric acid fuel cell RMS root mean square
SAFC solid acid fuel cell
PEMFC polymer electrolyte membrane or proton exchange membrane fuel cell SEM scanning electron microscopy
Chapter 1
Introduction
1.1 Overview
Solid acid fuel cells (SAFCs) based on CsH2PO4 electrolyte membranes have the
unique advantage of operating at warm temperatures near 250 ºC. They were first
demonstrated in the laboratory in 20041 and today have been scaled to stacks of 1.4 kW.2
Despite the rapid development of SAFCs, durability and cost, both of which pertain to the
performance of the electrodes, are the key challenges which must be overcome in order
for SAFCs to become technologically relevant.3 Thus, the overall objective of this work
is to gain a fundamental understanding of electrochemical pathways in SAFCs using
model electrode systems and newly developed characterization tools.
In this chapter, we present a brief introduction of fuel cells and, in particular, the
current status of SAFCs. We describe the basics of electrocatalysis in solid state
electrochemical systems and how an improved understanding of electrochemical reaction
kinetics can drastically advance the SAFC technology.
1.2 Fuel Cells
The need for clean, reliable and secure energy is one of the most important
challenges of this century. As such, many technologies are being pursued to address this
challenge. Among these, fuel cells stand to play a significant role in any renewable
energy cycle because they can efficiently convert fuels to electricity. Fuel cells are
combustion engines, they intake fuel continuously without a need to recharge, but like
batteries, they convert chemical energy directly to electricity. Consequently, fuel cells
can operate with higher efficiencies and lower emissions of greenhouse gases per unit of
fuel input compared to combustion engines which are limited by the Carnot efficiency.
Furthermore, they have no moving parts so they are silent during operation and have the
potential to operate with longer lifetimes. Finally, it has been shown that fuel cells can be
scaled up to large sizes without loss in power density. Due to these advantages, fuel cells
have been pursued for decades for both mobile and stationary power generation.
1.2.1 Fuel Cell Basics
A simple schematic of a fuel cell, based on a proton-conducting electrolyte, is
shown in Figure 1.1. For a fuel cell operating on hydrogen as the fuel and oxygen as
oxidant, the driving force for conversion of energy is the Gibbs free energy of the
reaction,
2(g) 2(g) 2 (g)
2H O 2H O (1.1)
The direct reaction of hydrogen and oxygen gases cannot occur because a
gas-impermeable membrane separates the two reactants. In order to utilize the energy stored
in the chemical bonds, electrochemical reactions occur at the electrodes and the resulting
ions (protons in this case) are transported through the electrolyte membrane, with
concurrent electron transport through an external circuit to do useful work. Specifically,
at the anode, hydrogen is electrochemically oxidized to protons and electrons, while at
the cathode, oxygen is electrochemically reduced to form water. The half-cell reactions
2(g)
anode: 2H 4H4e (1.2)
2(g) 2 (g)
cathode: O 4H4e2H O (1.3)
The two half-cell reactions, (1.2) and (1.3), sum to the net reaction (1.1). The standard
Gibbs free energy of the reaction, Grxn
, as written in Equation (1.1), is –483 kJ mol–1 at
25 ºC, where the superscript “o” refers to standard conditions of 1 atm of the reactants
and products.
Figure 1.1 A simple schematic of a fuel cell based on a proton-conducting electrolyte membrane.
This chemical potential driving force for water formation, Grxn , can be related to
the electrochemical potential via the relation
Grxn
TE T
nF
(1.4)
where E° is the standard Nernst potential of the fuel cell (or the theoretical open-circuit
voltage), n denotes the number of electrons transferred in the reaction (e.g., n = 4 in this
case), and F is the Faraday constant (96,485 C mol–1). The standard Nernst potential
corresponding to Equations (1.1)–(1.3) can be computed to be 1.25 V. To compute the
Nernst potential at more realistic conditions, one can readily show that 2H2→4H++ 4e
-H+ e -e
-O2+ 4H++ 4e-→2H2O
AN O D E CAT HO DE EL EC T R O L Y T E
22 2
2( ) 2( ) ( )
ln
c H O
eq a c
H O
p RT
E T E T
nF p p
(1.5)
where Eeq is the equilibrium/theoretical Nernst potential, pi is the partial pressure of
species i at the anode (a) or cathode (c), and R and T have their usually meanings. Values
for Grxn
T are tabulated for various reactions (or can be computed from the formationenergies for the reactants and products).
1.2.2 Overpotentials in Fuel Cells
Fuel cells are evaluated by their power output, and therefore it is desirable to
maintain a high cell voltage under large current loads. However, the voltage across a fuel
cell during operation is less than that predicted by the Nernst voltage because of
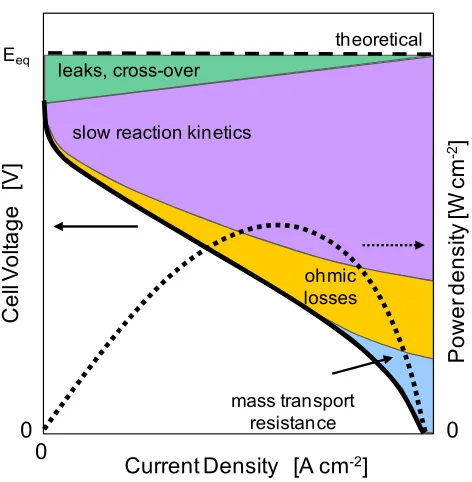
irreversible losses as current is drawn from the cell. Figure 1.2 is a schematic of
representative polarization and power density curves and depicts the four common
sources of voltage losses, or overpotentials. The overpotential, ηi, is best described as a
drop in voltage (from equilibrium) which is used to drive a specific process. The cell
voltage at any current density, j, can be expressed as
eq L act iR DE j E (1.6)
ηL is the voltage loss due to gas leaks across the electrolyte or partial electronic
conductivity of the electrolyte.ηact is the activation overpotential due to slow kinetics at
the electrodes, that is, the driving force required to push reactions over its activation
barrier. ηiR is the overpotential due to ohmic resistances, primarily from ion transport
through the electrolyte, and is characterized by a linear regime in the polarization curve.
for example, due to the depletion of reactants at the electrodes faster than they can be
supplied. The ultimate goal is to minimize all the overpotentials and shift the polarization
curve toward Eeq.
The relative contribution of each overpotential in Equation (1.6) and how it varies
with current density depend on the fuel cell type and the materials used therein. For
example, low-temperature fuel cells typically have large activation overpotentials while
high temperature fuel cells such as SOFCs have a larger contribution from ohmic loss and
[image:34.612.207.443.324.565.2]cross-over.
Figure 1.2 Schematic of a fuel cell polarization curve, with contributions of various overpotentials as indicated by the shaded regions. The power density (dotted line) is the product of the cell voltage and current density.
leaks, cross-over
ohmic losses
mass transport resistance slow reaction kinetics
Eeq
0
C
e
ll V
o
lta
g
e
[V
]
0
Current Density [A cm-2]
Power
de
nsi
ty [
W
cm
-2 ]
0
1.2.3 Component Requirements
In order to maintain a sufficiently high power density, or a sufficiently high cell
voltage, for a given current density (Figure 1.2), it is necessary to minimize
overpotentials. Cross-over effects can be reduced by an appropriate choice of the
electrolyte material, specifically one with minimal-to-no electronic conductivity, and by
optimizing its fabrication so as to obtain high density membranes with low porosity.
Proper sealing of the anode and cathode chambers is also required.
The thickness of the membrane should be reduced so as to minimize the total
voltage loss due to ion conduction since
iR
H L
jR j
(1.7)
where L is the membrane thickness and σH is the proton conductivity. In cases where the
electrolyte membrane must be very thin, the cell is fabricated to be electrode-supported,
meaning that either the anode or cathode is fabricated to be the structural support of the
assembly.
The activation overpotential is related to the rate at which the half-cell reactions
can occur at the electrodes and is often expressed as
0
ln
act
RT j
nF j
(1.8)
where j0 is the exchange current density which flows under zero overpotential, and α is
termed the exchange coefficient, an indicator of the electrochemical activity under
non-equilibrium conditions (i.e., at non-zero overpotentials). Equation (1.8) describes how
much voltage is required to attain a specific electrochemical current flow at the
required to attain sufficient currents. From the equation, one can see that larger values of
j0 and α are desirable for lowering ηact. The exchange current density, which is usually
normalized by the macroscopic electrode area, can be improved by increasing the number
of active sites per electrode area or by improving the intrinsic activity of the electrode.
On the other hand, the exchange coefficient is geometry-independent and can only be
affected by changing material properties. The derivation of Equation (1.8) is detailed in
Appendix A.1.
The requirements for electrodes are arguably more demanding than those for the
electrolyte membrane. Because electrochemical reactions involve gas phase species,
electrons and ions, electrodes are required to transport each of these species. That is, to
minimize activation losses, ηact, electrodes must not only be catalytically active, as
discussed in the previous paragraph, but must also transport participating electrons and
ions to and from active sites. Furthermore, they must have sufficient porosity to reduce
mass transport losses, ηD. More often than not, one material cannot satisfy all of these
requirements, so a porous composite of electrolyte and (metal) catalyst particles is
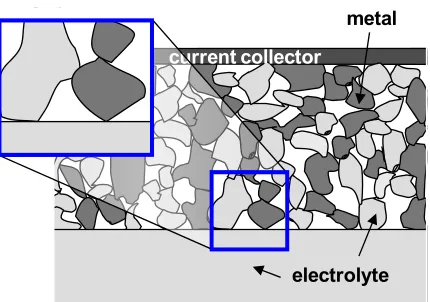
typically employed as the electrode (Figure 1.3). Typically, the electrolyte and catalyst
are pure ion- and electron-conductors, respectively, and thus the locations at which these
two solid phases come together to meet the gas phase are critical; the site at which these
three phases meet is termed the triple-phase boundary (TPB). Thus, the ideal electrode
structure requires interconnected ionic, electronic and gas pathways while maximizing
the number of triple-phase boundary sites. Any catalyst or electrolyte particle that is
Figure 1.3 Schematic of a typical composite electrode comprised of electrolyte and catalyst/electronically-conducting particles in a porous network. Enlargement shows a triple-phase boundary site, with the electrolyte particle connected to the electrolyte membrane and the metal/catalyst particle connected to a neighboring particle (and out to the current collector).
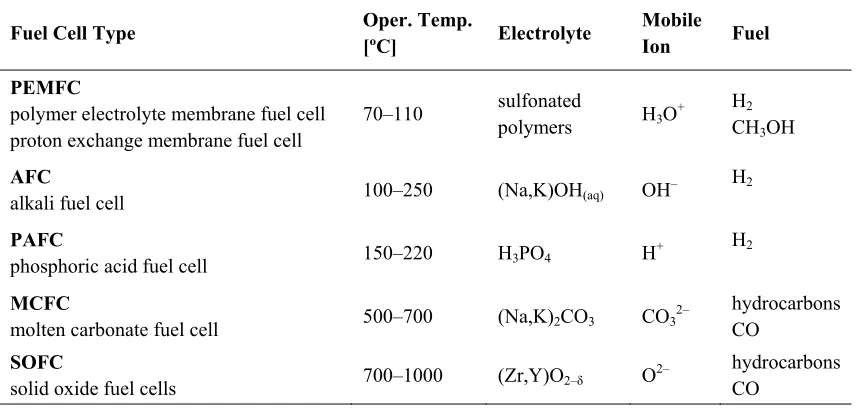
1.2.4 Types of Fuel Cells
Several different types of fuel cells, with operating temperatures ranging from
room temperature up to as high as 1000 ºC, are being actively pursued today. The
operating temperature of a fuel cell is dictated by that required to attain sufficiently high
ionic conductivity in the electrolyte, and thus, different fuel cell types are distinguished
by their electrolytes. Table 1.1 shows a brief summary of the common fuel cells and their
general characteristics. A good overview of the different types of fuel cells can be found
in a review article by Carrette et al.4 A more thorough reference is a text book by
Larminie and Dicks.5
electrolyte current collector
Table 1.1 Common types of fuel cells and their primary characteristics.4, 5
Fuel Cell Type Oper. Temp.
[ºC] Electrolyte
Mobile Ion Fuel
PEMFC
polymer electrolyte membrane fuel cell proton exchange membrane fuel cell
70–110 sulfonated
polymers H3O
+ H2
CH3OH
AFC
alkali fuel cell 100–250 (Na,K)OH(aq) OH
– H2
PAFC
phosphoric acid fuel cell 150–220 H3PO4 H
+ H2
MCFC
molten carbonate fuel cell 500–700 (Na,K)2CO3 CO3
2– hydrocarbons
CO
SOFC
solid oxide fuel cells 700–1000 (Zr,Y)O2–δ O
2– hydrocarbons
CO
In general, operation at high temperatures improves fuel flexibility, reducing
reliance on hydrogen gas as the primary fuel, and increases the efficiency of fuel cells
due to faster reaction kinetics at the electrodes. However, at temperatures close to
1000 ºC, material compatibility between supporting components becomes a problem, and
repeated thermal cycling is often not possible. Consequently, high temperature fuel cells,
such as solid oxide fuel cells (SOFCs) and molten carbonate fuel cells (MCFCs), are
typically employed for stationary power generation. At lower temperatures, rapid thermal
cycling is possible, as indicated by the demonstration of fuel cell vehicles based on
polymer electrolyte membrane fuel cells (PEMFCs), but operation with sufficient power
output requires the use of expensive catalysts such as platinum. At intermediate
temperatures, the benefits of both improved reaction kinetics and ease of thermal cycling
are retained; however, fuel cells operating at these temperatures are based on corrosive
liquid electrolytes. While liquid electrolytes have the benefit of high ionic conductivities,
Consequently, substantial effort in the fuel cell community has been directed towards
lowering the temperature of operation of SOFCs to 400–600 ºC (called intermediate
temperature solid oxide fuel cells, ITSOFCs) via the research and development of
electrolyte and electrode materials with sufficient ionic conductivities and electrocatalytic
activities at lower temperatures. A recently discovered class of fuel cells which operate in
this preferred intermediate temperature range is solid acid fuel cells, the subject of this
work.
1.3 Solid Acid Fuel Cells
1.3.1 Solid Acid Compounds
A relatively new addition to the fuel cell community is the solid acid fuel cell
(SAFC), first demonstrated in 2001 and operable at warm temperatures of 100–300 ºC,
depending on the solid acid electrolyte. Solid acid compounds have physical and
chemical similarities to normal salts and normal acids; they dissolve in water like
common salts but are able to donate acidic protons like typical acids. Common
stoichiometries are MHXO4, MH2XO4 and M3H(XO4)2 where M can be Cs, Rb, K, Na,
and even NH4, and X can be P, S, Se, and As. Typical room temperature structures of
solid acids consist of hydrogen-bonded XO4 groups, with the dimensionality of the
hydrogen bonding network being dictated by the H:XO4 ratio. On heating to warm
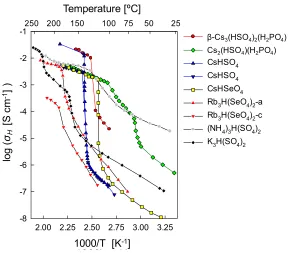
temperatures of ~ 100–300 ºC, a subset of these compounds undergo a phase transition to
a high temperature disordered phase at which the proton conductivity is increased by
CsHSeO4 in 1982,6 the so-called superprotonic transition has been identified in additional
solid acid compounds, such as Rb3H(SeO4)2,7 (NH4)3H(SO4)2,8 Cs2(HSO4)(H2PO4),9
[image:40.612.181.472.177.430.2]CsH2PO4,10 and even CsHPO3H11 (Figure 1.4).
Figure 1.4 The proton conductivity, σH, of several solid acid compounds observed to exhibit a
superprotonic phase transition, after Haile et al.12 and references therein.
Presently, among the solid acid compounds known to have a superprotonic phase
transformation, CsH2PO4 is the most promising as a fuel cell electrolyte.3, 10 On heating,
CsH2PO4 undergoes a monoclinic-to-cubic phase transition at ~ 228 ºC at which the
proton conductivity jumps by almost four orders of magnitude to > 10–2 S cm–1 (Figure
1.5a). The monoclinic structure (Figure 1.5b) is comprised of phosphate groups linked in
chains by double-minima hydrogen bonds, charge balanced by Cs cations. On heating,
the structure transforms to a CsCl-type cubic structure with Cs at the corners and a
phosphate group at the center. The phosphate group is often represented (as in Figure 1000/T K-1
2.00 2.25 2.50 2.75 3.00 3.25
lo g ( ) -1 cm -1 -8 -7 -6 -5 -4 -3 -2
-1250°C200°C 150°C 100°C75°C 50°C 25°C -Cs
3...
Cs2...
CsHSO4
CsHSO4
CsHSeO4
Rb3H(SeO4)2-a Rb3H(SeO4)2-c (NH4)3H(SO4)2 K3H(SO4)2 250 200 150 100 75 50 25
log (
σH
[S
c
m
-1] )
1000/T [K-1]
Temperature [ºC]
β-Cs3(HSO4)2(H2PO4)
1.5b) as equally occupying six symmetrically-equivalent crystallographic positions, and
in essence, is rapidly rotating, enabling proton transfer between neighboring phosphate
groups (Figure 1.6). Despite the disorder in structural oxygen, X-ray diffraction patterns
of the superprotonic phase reveal sharp diffraction peaks due to the fixed positions of the
[image:41.612.119.537.244.544.2]cesium and phosphorus atoms in the lattice.
Figure 1.5 Superprotonic phase transition in CsH2PO4: (a) Plot of proton conductivity as a function of
temperature, on heating and cooling, in flowing N2 with ~ 0.4 atm H2O, (b) Unit cells of monoclinic and
cubic phases, the latter with high disorder in oxygen (PO4) and hydrogen (not shown).
(a) (b)
1.9 2.0 2.1 2.2 2.3
-8 -7 -6 -5 -4 -3 -2
-1260 240 220 200 180 160
log (
H
[S c
m
-1 ] )
1000/T [K -1] Temperature [oC]
heat
cool
monoclinic, P21/m
cubic, Pm3m—
Cs PO4
H PO4
Figure 1.6 Schematic of the proton conduction mechanism in CsH2PO4.13
1.3.2 CsH2PO4 as an Electrolyte: Benefits and Challenges
Solid state electrolytes which facilitate anhydrous proton transport hold great
promise for fuel cell applications. SAFCs operate at temperatures near 250 ºC using truly
solid electrolytes that exhibit remarkably high, liquid-like proton conductivities. They
retain the benefits of the “warm” operating temperatures while avoiding challenges
associated with corrosive liquid electrolytes. The absence of corrosive liquids and the
lower operating temperatures, compared to SOFCs, means that auxiliary components can
be fabricated from relatively inexpensive stainless steel. The higher operating
temperature of SAFCs, compared to PEMFCs, suggests higher fuel flexibility and the
potential to eliminate costly precious metal catalysts in the electrodes. Equally important,
solid acid electrolytes are true proton conductors and do not rely on a water molecules as
carriers to transport protons, as is the case with polymer membranes. Because polymer
membranes must remain sufficiently hydrated to maintain adequate proton conductivities,
they require operation below 100 ºC and the use of complex water management systems
to maintain sufficient hydration near the anode while minimizing flooding at the
cathode.4 SAFCs do not require such water management systems and can operate well
beyond 100 ºC. The absence of water in the membrane also means that SAFCs can
tetrahedra reorientation
proton transfer H
operate with methanol as a fuel with virtually none of the cross-over observed with
polymer membranes.3, 4, 14
Although CsH2PO4 provides many advantages as an intermediate fuel cell
electrolyte, it has some challenges of its own. CsH2PO4 reaches its superprotonic phase at
relatively high temperatures, compared to other solid acid compounds, most of which
transform at temperatures below 150 ºC (Figure 1.4); at the higher operating temperatures
for CsH2PO4, dehydration has a greater tendency to occur via the reaction
2 4(s) 3(s) 2 (g)
CsH PO CsPO + H O (1.9)
Therefore, a sufficient water vapor pressure must be supplied in the fuel and oxidant
streams to suppress the dehydration process. A thorough study of the phase stability for
CsH2PO4 has been carried out15, 16 and serves as a guide for stable operating conditions.
For example, a minimum water partial pressure of ~ 0.15 atm is required for reliable
operation at 250 ºC. Under sufficient water partial pressures, one can observe the proton
conductivity behavior (like that shown in Figure 1.5a) to be reproducible over many
temperature cycles.
While solid acid compounds have tendency to dehydrate at elevated temperatures,
they are readily soluble in liquid water. This is less of a concern during operation due to
operating temperatures well above 100 ºC; however, during on-off cycling, humid
reactant/product gases must be purged out of the system to avoid condensation.
A final challenge with solid acid compounds is related to their interesting
mechanical properties. While solid acid compounds are relatively brittle in the low
conductivity phase, they are highly plastic in the superprotonic phase, as has been
cell operation because sealing of the anode and cathode chambers are done so by the
application of pressure which can cause irreversible deformation of the electrolyte over
the course of operation. Avoiding this problem is not extremely difficult. It has been
reported, in the case of CsH2PO4, that the strain rate can be reduced by a factor of five by
adding ~ 10 wt% of 2 μm SiO2 particles, with only a 20% drop in the proton conductivity
at fuel cell operating temperatures.3
The challenges associated with CsH2PO4 as an electrolyte are not insurmountable
by any means. CsH2PO4 remains, at present, the ideal electrolyte for SAFCs.
Nevertheless, the search for additional application-relevant solid acid proton conductors
is ongoing. Among the solid acid compounds known to undergo a superprotonic phase
transition, almost all are based on sulfates and selenates which are unstable under the
reducing conditions of the anode, reacting with H2 to form H2S or H2Se.21 Of the
phosphate-based compounds possible, only that with Cs (the largest of the alkali metal
cations) exhibits the superprotonic phase transition. A recently identified phosphite
compound, CsHPO3H,11 which exhibits a relatively low phase transition temperature of
~ 140 ºC, has not been pursued extensively due to expectations that it would be unstable
at oxidizing conditions, although related compounds show some promise as fuel cell
electrolytes.22, 23 Superprotonic solid acid compounds are a relatively unexplored class of
materials with a rich chemistry that has not yet been fully exploited. As demonstrated in
the recent report of a water-insoluble, superprotonic, barium-potassium compound24,
there is much room for the discovery and development of additional application-relevant
1.3.3 Solid Acid Fuel Cell Performance
Solid acid fuel cells based on CsH2PO4 as an electrolyte membrane, operating on
humidified H2 and O2, have been demonstrated in literature to have peak power densities
as high as 400 mW cm–2 at 248 ºC.25 This demonstration was based on thin 25–36 μm
CsH2PO4 membranes and composite electrodes comprised of a mixture of nanoparticulate
Pt, carbon-supported Pt, and micron-scale CsH2PO4 particles. Despite the high Pt
loadings used, ~ 8 mg cm–2 for each electrode, large activation overpotentials at the
electrodes were found to limit the overall performance.10
Substantial progress has been made since the first demonstration of CsH2PO4
-based SAFCs in 2004. SAFCs -based on Pt-CsH2PO4 composite electrodes readily operate
with 180 mW cm–2 peak power densities at ~ 250 ºC and degrade negligibly over several
hundred hours of continuous operation.3 Moreover, the power densities have been
demonstrated to be scalable to 20-cell stacks, with each cell comprised of a 50 μm
CsH2PO4 membrane and a total (anode + cathode) Pt loading of 4 mg cm–2. SAFCs have
also demonstrated resistance to poisoning by impurities in the fuel stream, thus
improving fuel flexibility by lowering the cleanup requirements of reformed fuels.
Specifically, a tolerance to H2S, NH3, CH3OH, CH4, C3H8 and CO at 100 ppm, 100 ppm,
5%, 5%, 3%, and 20%, respectively, have been reported.3
Although significant progress in SAFC development has been made, they are not
yet competitive with those of conventional polymer and solid oxide fuel cells, primarily
due to high activation overpotential losses at the electrodes. While it has been possible to
fabricate thin electrolyte membranes to improve overall fuel cell performance, achieving
current Pt loadings of 4 mg cm–2 is over an order of magnitude higher than loadings of
~ 0.1 mg cm–2 in PEMFC electrodes.26 This is not necessarily surprising since the
electrode requirements for SAFCs are in a class of their own, and the tools/processes
required to optimize the electrode microstructure are still under development.
Advancement of SAFCs requires the design of new electrode structures with improved
performance and the development of new materials with high activity under SAFC
operating conditions. Much of this work is presently under investigation, both by
fabrication of high performing electrode structures27, 28 and by fundamental mechanistic
studies of electrocatalysis, discussed in this work.
1.4 Electrode Reactions in Solid Acid Fuel Cells
1.4.1 Hydrogen Electro-oxidation and Oxygen Electro-reduction
For a majority of fuel cells, the kinetics of oxygen electro-reduction is much
slower than that of hydrogen oxidation. In the case of PEMFCs, the exchange current
density, j0 in Equation (1.8), for hydrogen oxidation is typically five to six orders of
magnitude greater than that for oxygen reduction.26, 29 There is some consensus on the
hydrogen oxidation mechanism on Pt; specifically, hydrogen dissociatively adsorbs onto
Pt and the resulting hydrogen is oxidized to protons and electrons, with dissociative
adsorption being rate limiting.26 On the other hand, oxygen reduction is considerably
more complex. The oxygen reduction reaction, being a four electron transfer reaction, has
at least four intermediate transfer steps. The reduction mechanism requires the
stable adsorbed intermediates such as M-O and M-OH (where M = metal catalyst).26
These are a few reasons why the mechanism of oxygen reduction has not yet been fully
elucidated even though it has been studied in the fuel cell community for decades. It is
unclear how much information from the PEMFC literature can be translated to SAFCs
due to their different operating temperatures and environmental conditions (i.e., presence
of liquid water).
In the case of SAFCs, it has been shown that the electrode resistance at the cathode is
roughly two orders of magnitude larger than at the anode.10 To a first approximation, this
activity difference between the anode and cathode is less drastic that that observed in
PEMFCs. Thus, while most of the focus in the PEMFC community has been to improve
electrocatalysis at the cathode, SAFCs stand to gain from improving the performance
(and lowering the cost) of both the anode and cathode.
1.4.2 Electrochemical Reaction Pathways
Elucidation of reaction kinetics at the electrodes can provide valuable information
that can be used to rationally design electrode structures and/or screen for new catalysts.
However, reaction pathways for virtually every type of fuel cell remain elusive. Like
heterogeneous catalysis, electrochemical catalysis relies on the intimate contact of a solid
phase (catalyst) with a liquid or gas medium. However, electrocatalysis is notably more
complicated because carrying out reactions that involve gas phase species, electrons and
ions requires the presence of materials that can transport each of these species. Figure 1.7
shows some possible mechanisms for hydrogen oxidation and oxygen reduction via the
triple-phase boundary pathway. From Figure 1.7, the complexity of the oxygen reduction
that can occur compared to hydrogen oxidation. In the case of hydrogen oxidation,
hydrogen gas can adsorb (or dissociatively adsorb) directly onto the triple-phase site and
undergo charge transfer, or, it can adsorb on the catalyst at some distance away in which
case the adsorbed hydrogen must diffuse across the metal surface to be oxidized into
protons and electrons at the triple-phase boundary. In the case of oxygen reduction, direct
adsorption of O2 and desorption of H2O (Figure 1.7b) is the simplest pathway possible,
but many other pathways are possible. For example, oxygen can adsorb as neutral (or
partially reduced) species onto the metal catalyst before diffusing to the TPB site to be
(further) reduced by incoming electrons and protons (Figure 1.7c). In yet another
scenario, protons can be reduced to neutral hydrogen which then diffuses to the adsorbed
oxygen species (Figure 1.7d). The rate at which each of these possible reaction steps can
occur (if at all) depends on material properties (catalyst activity, ionic or electrical
conductivity, solid or liquid), characteristics of the species (surface diffusion coefficients,
bond strengths), electrode structure (number and identity of active sites) and also
environmental conditions (temperature, gas environment, and partial pressure).
Figure 1.7 Simplified cartoon of some possible triple-phase boundary pathways in (a) hydrogen electro-oxidation and (b–d) oxygen electro-reduction.
O2(g)+ 4H++ 4e-→ 2H2O(g) catalyst
H+ electrolyte
e
-H2
H+ e
-H2O O2
H+ e
-H2O O2
2H2(g)→ 4H++ 4e
-(a) (b) (c) (d)
H+ e
-H2O O2 catalyst
Depending on the characteristics of the materials, it is entirely possible that the
triple-phase boundary pathway is not relevant at all. While there are many systems in
which the triple-phase boundary pathway is preferred, there are also a number of
electrode systems which catalyze electrochemical reactions via a two-phase boundary
pathway. This case can occur for electrodes which have both ionic and electronic
conductivity, for example, cerium oxide and some perovskite oxides,30 both of which are
materials of interest for SOFCs. Many BCC and FCC metals, particularly palladium, are
known to have a finite solubility of atomic hydrogen and therefore can transport both
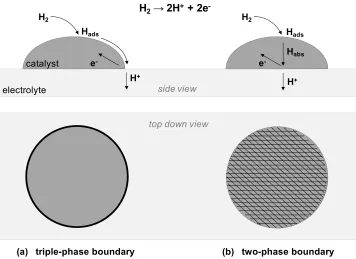
electrons and neutral species.31 We present a (simple) schematic (Figure 1.8) for the latter
case, comparing the triple-phase and two-phase boundary pathways for a metal catalyst in
contact with a proton conductor. One can immediately see that, if the hydrogen can be
transported through the metal, the active area is increased significantly, from a region
confined near the TPB (Figure 1.8a) to the entire metal | electrolyte interfacial area.
Whether a given electrode | electrolyte system catalyzes an electrochemical reaction via
the triple-phase or two-phase pathway can have significant consequences in electrode
design. In the case of an electrochemical reaction confined to TPB sites, a logical route
would be to use catalyst nanoparticles to maximize the number of such sites (Figure 1.3),
whereas a reaction occurring via the two-phase boundary pathway calls for maximizing
the electrode | electrolyte interface.
It is clear that identification of the rate-limiting steps in electrochemical reactions
is crucial to the advancement of SAFCs. Because the SAFC is the solid state system to
information the catalyst-solid acid system. In this work, we present our efforts to develop
[image:50.612.148.504.167.426.2]and employ novel tools to elucidate the reaction pathways in solid acid fuel cell systems.
Figure 1.8 Comparison of triple-phase and two-phase boundary pathways for a metal catalyst in contact with a proton-conducting electrolyte.
(a) triple-phase boundary (b) two-phase boundary top down view
electrolyte catalyst
H2→ 2H++ 2e
-H+ e
-H2
Hads
H2
Hads
Habs
H+ e
Chapter 2
Experimental Methods
2.1 AC Impedance Spectroscopy
2.1.1 Basic Principles
Alternating current impedance spectroscopy (ACIS) is a powerful technique for
characterizing a wide variety of electrochemical systems which undergo a great number
of microscopic processes when stimulated with an electric field. The net current flowing
through the system depends on the properties of the materials under investigation as well
as the interfaces present. Processes occurring within the electrolyte, e.g., in the crystal
lattice or across grain boundaries, as well as at