http://dx.doi.org/10.4236/ojs.2014.49074
A New Regression Type Estimator with
Two Auxiliary Variables for
Single-Phase Sampling
Everline Chemutai Tum, John Kung’u, Leo Odongo
Department of Statistics and Actuarial Science, Kenyatta University, Nairobi, Kenya Email: [email protected], [email protected]
Received 12 August 2014; revised 16 September 2014; accepted 28 September 2014 Copyright © 2014 by authors and Scientific Research Publishing Inc.
This work is licensed under the Creative Commons Attribution International License (CC BY). http://creativecommons.org/licenses/by/4.0/
Abstract
In this paper, we have proposed an estimator of finite population mean using a new regression type estimator with two auxiliary variables for single-phase sampling and investigated its finite sample properties. An empirical study has been carried out to compare the performance of the proposed estimator with the existing estimators that utilize auxiliary variables for finite popula-tion mean. It has been found that the new regression type estimator with two auxiliary variables for to be more efficient than mean per unit, ratio and product estimator and exponential ratio and exponential product estimators and exponential ratio-product estimator.
Keywords
Regression Estimator, Exponential Ratio-Product Estimator, Auxiliary Variables, Mean Squared Error
1. Introduction
The history of using auxiliary information in survey sampling is as old as history of the survey sampling. The work of Neyman [1] may be referred to as the initial work where auxiliary information has been used to improve precision of an estimator. Cochran [2] used auxiliary information in single-phase sampling to develop the ratio estimator for estimation of population mean. In the ratio estimator, the study variable and the auxiliary variable had a high positive correlation and the regression line was passing through the origin. Watson [3] used the re-gression estimator of leaf area on leaf weight to estimate the average area of the leaves on a plant.
highly positively correlated with the study variable. Murthy [5] used auxiliary information in single-phase sam-pling to develop the product estimator for estimation of population mean. Singh [6] gave a multivariate expres-sion of Murthy’s [5] product estimator while Raj [7] put forward a method for using multi-auxiliary variables through a linear combination of single difference estimators.
Singh [8] considered the extension of the ratio-cum-product estimators to multi-auxiliary variables while Rao and Mudholkar [9] considered a multivariate estimator based on a weighted sum of single ratio and product es-timators. John [10] suggested two multivariate generalizations of ratio and product estimators which actually reduced to the Olkin’s [4] and Singh’s [6] estimators.
Bahl and Tuteja [11] proposed ratio and product type exponential estimators while Singh and Vishwakarma [12] extended the exponential ratio and product type estimators to double-phase sampling. Singh and Espejo [13] proposed a class of ratio-product estimators in single-phase sampling with its properties and identified asymp-totically optimum estimators from the proposed class of estimators. Singh and Espejo [14] also extended the ra-tio-product estimators to two-phase sampling. Hanif, Hamad and Shahbaz [15] and [16] proposed a modified regression type estimator in survey sampling where they combined regression estimator with the ratio-product estimator in both single and two-phase sampling. Hamad, Hanif and NajeebHaider [17] extended the estimator to two-phase sampling under partial information case.
In this paper, we will extend the modified regression estimator proposed by Hanif, Hamad and Shahbaz [15] to a new regression type estimator with two auxiliary variables for single-phase sampling estimator and incor-porate Arora and Bansi [18] approach in writing down the mean squared error. We will use natural both simu-lated and natural population by Johnson [19].
2. Preliminaries
2.1. Notation and Assumption
Let us consider a finite population U=
(
U U1, 2,,UN)
of size N units. A first phase large sample of size nunits is drawn from population U following simple random sampling without replacement (SRSWOR) scheme.
Let 1 1 n i i y y n =
=
∑
and1 1 n i i x x n =
=
∑
be the unbiased estimators of Y and X the population mean of y and xrespectively. Let f n N
= then 1 f
n
θ
= − . Let2 2 2 y y S C Y = , 2 2 2 z z S C Z = and
2 2 2 x x S C X
= be the squares of coeffi-
cient of variation of study variable and the auxiliary variables respectively. Where the variances and covariance are given by,
(
)
(
)
(
)(
)
(
)(
)
2 2 2 2 1 1 1 1 1 1 , , 1 1 1 1 , . 1 1 N Ny i x i
i i
N N
yx i i xz i i
i i
S y Y S x X
N N
S x X y Y S x X z Z
N N = = = = = − = − − − = − − = − − − −
∑
∑
∑
∑
(1.0)The correlation coefficients between study variable and auxiliary variables are given by;
, and .
yx yz xz
yx yz xz
y x y z x z
S S S
S S S S S S
ρ = ρ = ρ = (1.1)
Let y
(
)
, , x(
)
z(
)
y Y x X z Z
e e e
Y X Z
− − −
= = = be sampling errors and are assumed to be very small. We as-
sume that
( )
y( )
x( )
z 0E e =E e =E e = . (1.2)
The sampling error can also be written as,
(
1 y)
,(
1 x)
and(
1 z)
.y=Y +e x=X +e z =Z +e (1.3)
operation of expectations as:
( )
( )
( )
( )
(
)
( )
2 2 2 2 2 2
2 2 2
, , ,
, , .
x x y y y x y x yx
z z x z x z xz y z y z yz
E e X C E e Y C E e e XYC C
E e Z C E e e XZC C E e e YZC C
θ θ θ ρ
θ θ ρ θ ρ
= = =
= = = (1.4)
( )
( )
1 1 T .
ij
Adj A
A C
A A
− = = (1.5)
(
2)
.
1
q
q q
yx
y x x
R
R = −ρ Arora and Lai [18]. (1.6)
The following notations will be used in deriving the mean square errors of proposed estimator.
p yx R
: Determinant of population correlation matrix of variables y x, , 1 x2.
i q yx
yx R
: Determinant of th
i minor of p yx R
corresponding to the th
i element of i yx ρ .
2
r yx
ρ : Denotes the multiple coefficient of determination of y on x1, x2.
2
q yx ρ
: Denotes the multiple coefficient of determination of y on y x, , 1 x2.
r x R
: Determinant of population correlation matrix of variables x1, x2.
p x R
: Determinant of population correlation matrix of variables x1, x2.
i r y x R
: Determinant of the correlation matrix of yi, , x1 x2.
i p y x R
: Determinant of the correlation matrix of yi, , x1 x2. (1.7)
2.2. Mean per Unit in Single-Phase Sampling
It is obtained by taking a sample of size n from N using simple random sampling without replacement.
1
1 .
n
i i
y y
n =
=
∑
(2.0)Its variance is given by,
( )
2 2.
y
V y =
θ
Y C (2.1)2.3. Ratio, Product and Regression Estimators
Classical ratio estimator by Cochran [2] is given by,
(
0 .)
RX
t y x
x
α
= ≠
(2.2)
The mean squared error of the estimator tR up to the first order of approximation is given by,
( )
2(
2 2)
MSE tR =θY Cy+Cx −2ρyxC Cy x . (2.3)
Classical regression estimator by Watson [3] is given by,
(
)
RE .
t = +y β X−x (2.4)
Mean squared error of estimator tRE is given by,
( )
2 2(
2)
REMSE t =θY Cy 1−ρyx . (2.5)
. P
x t y
X
α
=
(2.6)
The mean squared error of the estimator tR up to the first order of approximation is given by,
( )
2(
2 2)
MSE tP =θY Cy +Cx +2ρyxC Cy x . (2.7)
2.4. Ratio-Product Estimator
Singh and Espejo [13] proposed the following ratio-product estimator
(
)
RP 1 .
X x
t y
x X
α α
= + −
(2.8)
The mean squared error of the estimator tRP up to the first order of approximation is given by,
( )
2 2(
2)
RP
MSE t =θY Cy 1−ρyx . (2.9)
2.5. Exponential Ratio-Type and Exponential Product-Type Estimators
Bahl and Tuteja [11] suggested an exponential ratio-type and exponential product-type estimator defined as
ER exp
X x
t y
X x
−
=
+
(2.10)
EP exp .
x X
t y
x X
−
=
+
(2.11)
The mean squared error of tER and tPE up to the first order of approximation are:
( )
2 2 2ER
1 MSE
4
y x yx y x t =θY C + C −ρ C C
(2.12)
( )
2 2 2EP
1
MSE .
4
y x yx y x t =θY C + C +ρ C C
(2.13)
2.6. Exponential Ratio-Product Estimator Using Auxiliary Variable
The exponential ratio-product estimator proposed by Singh and Espejo [13] is given by,
(
)
ERP exp 1 exp .
X x x X
t y
X x x X
α α
− −
= + + − +
(2.14)
The mean squared error is given by,
(
)
2 2(
22)
ERPMSE t =θY Cy 1−ρyx .
(2.15)
In general these estimators have a bias of order 1
n− . Since the standard error of the estimates is of order 1 n,
the quantity bias .s e is of order 1
n and becomes negligible as n becomes large. In practice, this quantity is usually unimportant in samples of moderate and large sizes.
3. Methodology
3.1. Mixture Ratio Estimators Using Multi-Auxiliary Variable and Attributes for
Single-Phase Sampling
If we estimate a study variable when information on all auxiliary variables is available from the population, it is utilized in the form of their means. A new regression type estimator using two auxiliary variables for single va-riables is proposed as:
(
)
(
)
(
)
RERP exp 1 exp .
Z z z Z
t y X x
Z z Z z
β α − α −
= + − + −
+ +
(3.0)
Substituting (1.3) equation in (3.0) we get,
(
) (
)
(
)
(
(
)
) (
)
(
(
)
)
RERP
1 1
1 exp 1 exp .
1 1
z z
y
z z
Z Z e Z e Z
t Y e X x
Z Z e Z Z e
β α − + α + −
= + + − + −
+ + + +
(3.1)
Ignoring the second and higher terms for each expansion of product and after simplification we can write
RERP
t as,
(
)
(
)
RERP exp 1 exp .
2 2
z z
y x
e e
t = e + −Y βe α − + −α
(3.2)
Expanding the exponential in (3.2) and ignoring the second and higher terms for each expansion we get,
(
)
(
)
RERP 1 1 1 .
2 2
z z
y x
e e
t = e + −Y βe α − + −α +
(3.3)
Simplifying (3.3) we get,
(
)
RERP
1
1 .
2
y x z
t = e + −Y βe + −αe
(3.4)
Expanding (3.4) and ignoring the second and higher terms we get,
RERP
1 . 2
y x z
t = + −Y e βe +Y −αe
(3.5) The mean squared error of tRERP is given by
(
)
(
)
2RERP RERP
MSE t =E t −Y
(
RERP)
21
MSE .
2
y x z
t =E e −βe +Y −αe
(3.6)
Squaring the right sides of (3.6) and taking expectation, we get,
(
)
2 2 2 2 2 2 2 2 2 2 2 2 2 2 2 2RERP
2
1
MSE +
4
2 2 2 .
y x z z z y z yz
y z yz y x yx x z xz x z xz
t Y C X C Y Z C Y Z C Y Z C Y XC C
Y ZC C XYC C Y XZC C Y XZC C
θ β θ θ α θ α θ θ ρ
α θ ρ βθ ρ βθ ρ α βθ ρ
= + + − +
− − − +
(3.7)
Differentiating (4.7) with respect to α and
β
and equating to zero gives( )
1 1 2 2 1 y yx yxz x YC R XC R β + ×= − (3.8)
( )
2 1 2 2 1 1 . 2 y yz yxz z C R ZC R α + ×= + − (3.9)
sim-plified form as
(
RERP)
1
MSE .
2
y y x z
t =E e e −βe +Y −αe
(3.10)
Taking expectation in (3.10) we get,
(
)
( )
2( )
( )
RERP
1
MSE .
2
y y x y z
t =E e −βE e e +Y −αE e e
(3.11)
Taking expectation and using (1.4) in (3.11) we get
(
)
2 2RERP
MSE t =
θ
Y Cy−βθ
XYC Cy xρ
yx+Yαθ
YZC Cy zρ
yz. (3.12)Substituting the optimum value (3.8) and (3.9) in (3.12), we get
(
)
( )
( )
1 1 2 2 RERP 2 2 2 1 2 2 MSE 1 1 1 1 . 2 2 yy yx yxz y x yx
x
y
yz yxz y z yz z
YC
t Y C R XYC C
XC R
C
Y R YZC C
ZC R θ θ ρ θ ρ + × + × = − − + − + − (3.13)
Simplifying (3.13) we get
(
)
2 2( )
1 1( )
2 1 2RERP
2 2 2 2
MSE y y 1 yx y yx 1y yz y yz.
yxz yxz
YC C
t Y C R YC R Y C
R R
θ + θ ρ + θ ρ
× ×
= − − − − (3.14)
Or
(
)
( )
( )
1 1 2 1
2 2 RERP
2 2 2 2
1 1
MSE y 1 yx yxz yx yz yxz yz .
R R
t Y C
R R θ ρ ρ + + × × − − = − − (3.15) Or
(
)
2 2(
( )
1( )
2)
RERP 2 2
2 2
MSE y 1 yx yx 1 yz yz .
yxz yxz
Y C
t R R R
R
θ
ρ ρ
× ×
= + − + − (3.16)
We can also rewrite (3.16) as,
(
)
2 2RERP
2 2
MSE y yxz .
R
t Y C
R θ
×
= (3.17)
Using (1.6) in (3.17) we get
(
)
2 2(
2)
RERP .
MSE t =θY Cy 1−ρy xz (3.18)
where
ρ
2y xz. denotes the multiple coefficient of determination of y on x z, .3.2. Bias of the New Regression Type Estimator with Two Auxiliary Variables
The regression-cum-exponential ratio-product estimator using multiple auxiliary variables in single-phase sam-pling is biased. However, this bias is negligible for moderate large samples. It is easily shown that the new re-gression type estimator with two auxiliary variables for single-phase is consistent estimator using two auxiliary variables since it is a linear combination of consistent estimators it follows that it’s also consistent.
4. Simulation, Result and Discussion
sampling for finite population.
1) Simulated population
1) Study variable N =500, n=60, mean=75 and standard deviation = 10.
ii) For ratio estimator the auxiliary variable is strongly positively correlated with the study variable and the line passes through the origin.
500, 60, mean 56
N = n= = , standard deviation = 11 and ρ =yx 0.7018.
iii) For regression estimator the auxiliary variable was strongly positively correlated with the study variable and the regression line does not pass through the origin.
Auxiliary variable N =500, n=60, mean=7, standard deviation = 2 and ρ =yx 0.8114.
iv) For product estimator the auxiliary variable was strongly negatively correlated with the study variable. Auxiliary variable N =500, n=60, mean=34, standard deviation = 6.3 and ρ = −yx 0.7477.
2) Natural population by Johnson (1996)
Lists estimates of the percentage of body fat determined by underwater weighing and various body circumfe-rence measurements for 252 men and data set was used to illustrate multiple regression techniques.
i) Body fat N=252, n=32, mean=19 and standard deviation = 8.4.
ii) For ratio estimator the auxiliary variable (simulated) is strongly positively correlated with the study varia-ble (body fat).
252, 32, mean 63
N = n= = , standard deviation = 3.4 and ρ =yx 0.4943.
iii) For regression estimator the auxiliary variable (hips circumference) was strongly positively correlated with the study variable (body fat).
Auxiliary variable N =252, n=32, mean=99, standard deviation = 7 and ρ =yx 0.6235.
iv) For product estimator the auxiliary variable (simulated) was strongly negatively correlated (body fat) with the study variable.
Auxiliary variable N =252, n=32, mean=5, standard deviation = 3.3 and ρ = −yx 0.5812.
In order to evaluate the efficiency gain we could achieve by using the proposed estimators, we have calcu-lated the variance of mean per unit and the mean squared error of all estimators we have considered. We have then calculated percent relative efficiency of each estimator in relation to variance of mean per unit. We have then compared the percent relative efficiency of each estimator, the estimator with the highest percent relative efficiency is considered to be the more efficient than the other estimators. The percent relative efficiency is cal-culated using the following formulae.
( )
Var( )
( )
ˆˆ
eff 100
ˆ MSE
y Y
Y
= ∗ (4.0)
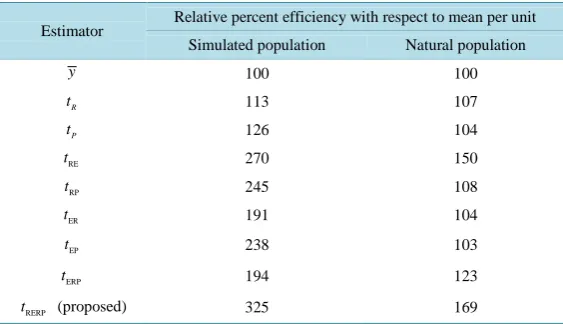
Table 1 shows percent relative efficiency of proposed estimator with respect to mean per unit estimator for single-phase sampling. It is very clear from Table 1 that our proposed new regression type estimator is the most
Table 1. Relative efficiency of existing and proposed estimator with respect to mean per unit estimator for single-phase sampling.
Estimator Relative percent efficiency with respect to mean per unit Simulated population Natural population
y 100 100
R
t 113 107
P
t 126 104
RE
t 270 150
RP
t 245 108
ER
t 191 104
EP
t 238 103
ERP
t 194 123
RERP
efficient compared to mean per unit, ratio and product estimator using one auxiliary variables, ratio-product es-timator, exponential ratio eses-timator, exponential product estimator and exponential ratio-product estimator esti-mators for population mean since it has the highest percent relative efficiency.
5. Conclusion
The proposed new regression type estimator with two auxiliary variables for single-phase sampling is recom-mended for estimating the finite population mean since it is the most efficient estimator compared to mean per unit, ratio and product estimator using one auxiliary variables, ratio-product estimator, exponential ratio estima-tor, exponential product estimator and exponential ratio-product estimator in term of efficiency in single-phase sampling.
References
[1] Neyman, J. (1938) Contribution to the Theory of Sampling Human Populations. Journal of the American Statistical Association, 33, 101-116. http://dx.doi.org/10.1080/01621459.1938.10503378
[2] Cochran, W.G. (1940) The Estimation of the Yields of the Cereal Experiments by Sampling for the Ratio of Grain to Total Produce. Journal of Agricultural Science, 30, 262-275. http://dx.doi.org/10.1017/S0021859600048012
[3] Watson, D.J. (1937) The Estimation of Leaf Areas. Journal of Agricultural Science, 27, 474.
http://dx.doi.org/10.1017/S002185960005173X
[4] Olikin, I. (1958) Multivariate Ratio Estimation for Finite Population. Biometrika, 45, 154-165.
http://dx.doi.org/10.1093/biomet/45.1-2.154
[5] Murthy, M.N. (1964) Product Method of Estimation. Sankhya, 26, 294-307.
[6] Singh, M.P. (1967) Multivariate Product Method of Estimation for Finite Populations. Journal of the Indian Society of Agricultural Statistics, 31, 375-378.
[7] Raj, D. (1965) On a Method of Using Multi-Auxiliary Information in Sample Surveys. Journal of the American Statis-tical Association, 60, 270-277. http://dx.doi.org/10.1080/01621459.1965.10480789
[8] Singh, M.P. (1967) Ratio-Cum-Product Method of Estimation. Metrika, 12, 34-42.
http://dx.doi.org/10.1007/BF02613481
[9] Rao, P.S.R.S. and Mudholkar, G.S. (1967) Generalized Multivariate Estimators for the Mean of a Finite Population.
Journal of the American Statistical Association, 62, 1009-1012. http://dx.doi.org/10.1080/01621459.1967.10500911
[10] John, S. (1969) On Multivariate Ratio and Product Estimators. Biometrika, 56, 533-536.
http://dx.doi.org/10.1093/biomet/56.3.533
[11] Bahl, S. and Tuteja, R.K. (1991) Ratio and Product Type Exponential Estimator. Information and Optimization
Sciences, 12, 159-163. http://dx.doi.org/10.1080/02522667.1991.10699058
[12] Singh, H.P. and Vishwakarma, G.K. (2007) Modified Exponential Ratio and Product Estimators for Finite Population Mean in Double Sampling. Austrian Journal of Statistics, 36, 217-225.
[13] Singh, H.P. and Espejo, M.R. (2003) On Linear Regression and Ratio-Product Estimation of a Finite Population Mean.
The Statistician, 52, 59-67. http://dx.doi.org/10.1111/1467-9884.00341
[14] Singh, H.P. and Espejo, M.R. (2007) Double Sampling Ratio-Product Estimator of a Finite Population Mean in Sample Survey. Journal of Applied Statistics, 34, 71-85. http://dx.doi.org/10.1080/02664760600994562
[15] Hanif, M., Hamad, N. and Shahbaz, M.Q. (2009) A Modified Regression Type Estimator in Survey Sampling. World Applied Sciences Journal, 7, 1559-1561.
[16] Hanif, M., Hamad, N. and Shahbaz, M.Q. (2010) Some New Regression Type Estimators in Two-Phase Sampling.
World Applied Sciences Journal, 8, 799-803.
[17] Hamad, N., Hanif, M. and Haider, N. (2013) A Regression Type Estimator with Two Auxiliary Variables for Two- Phase Sampling. Open Journal of Statistics, 3, 74-78. http://dx.doi.org/10.4236/ojs.2013.32010
[18] Arora, S. and Lal, B. (1989) New Mathematical Statistics. Satya Prakashan, New Delhi.