Scholarship@Western
Scholarship@Western
Electronic Thesis and Dissertation Repository
6-22-2012 12:00 AM
Consistent Density Scanning and Information Extraction From
Consistent Density Scanning and Information Extraction From
Point Clouds of Building Interiors
Point Clouds of Building Interiors
Kuldeep Kumar Sareen
The University of Western Ontario Supervisor
Prof. George K. Knopf
The University of Western Ontario
Graduate Program in Mechanical and Materials Engineering
A thesis submitted in partial fulfillment of the requirements for the degree in Doctor of Philosophy
© Kuldeep Kumar Sareen 2012
Follow this and additional works at: https://ir.lib.uwo.ca/etd
Part of the Civil Engineering Commons, Computer-Aided Engineering and Design Commons, and the Construction Engineering and Management Commons
Recommended Citation Recommended Citation
Sareen, Kuldeep Kumar, "Consistent Density Scanning and Information Extraction From Point Clouds of Building Interiors" (2012). Electronic Thesis and Dissertation Repository. 608.
https://ir.lib.uwo.ca/etd/608
This Dissertation/Thesis is brought to you for free and open access by Scholarship@Western. It has been accepted for inclusion in Electronic Thesis and Dissertation Repository by an authorized administrator of
CONSISTENT DENSITY SCANNING AND INFORMATION EXTRACTION FROM POINT CLOUDS OF BUILDING INTERIORS
Spine title: Consistent Density Scanning and Information Extraction from Point Clouds of Building Interiors
Thesis Format: Monograph
by
Kuldeep Kumar Sareen
Graduate Program in Mechanical and Materials Engineering
A thesis submitted in partial fulfillment
of the requirements for the degree of
Doctor of Philosophy
The School of Graduate and Postdoctoral Studies
Western University
London, Ontario, Canada
June, 2012
ii
CERTIFICATE OF EXAMINATION
Supervisor
______________________________ Dr. George Karl Knopf
Co-Supervisor
______________________________ Dr. Robert Canas
Supervisory Committee
______________________________
Examiners
______________________________ Dr. Ralph O. Buchal
______________________________ Dr. O. Remus Tutunea-Fatan
______________________________ Dr. Hanif M. Ladak
______________________________ Dr. Ling Guan
The thesis by
Kuldeep Kumar Sareen
entitled:
Consistent Density Scanning and Information Extraction from Point Clouds of Building Interiors
is accepted in partial fulfillment of the requirements for the degree of
Doctor of Philosophy
iii
Over the last decade, 3D range scanning systems have improved considerably enabling the designers to capture large and complex domains such as building interiors. The captured point cloud is processed to extract specific Building Information Models, where the main research challenge is to simultaneously handle huge and cohesive point clouds representing multiple objects, occluded features and vast geometric diversity. These domain characteristics increase the data complexities and thus make it difficult to extract accurate information models from the captured point clouds.
The research work presented in this thesis improves the information extraction pipeline with the development of novel algorithms for consistent density scanning and information extraction automation for building interiors. A restricted density-based, scan planning methodology computes the number of scans to cover large linear domains while ensuring desired data density and reducing rigorous post-processing of data sets.
The research work further develops effective algorithms to transform the captured data into information models in terms of domain features (layouts), meaningful data clusters (segmented data) and specific shape attributes (occluded boundaries) having better practical utility. Initially, a direct point-based simplification and layout extraction algorithm is presented that can handle the cohesive point clouds by adaptive simplification and an accurate layout extraction approach without generating an intermediate model.
Further, three information extraction algorithms are presented that transforms point clouds into meaningful clusters. The novelty of these algorithms lies in the fact that they work directly on point clouds by exploiting their inherent characteristic. First a rapid data clustering algorithm is presented to quickly identify objects in the scanned scene using a robust hue, saturation and value (H S V) color model for better scene understanding.
iv
side-ratio constraint algorithm is presented to identify occluded boundary data points by investigating their spatial discontinuity.
v
This PhD work would not have been the possible without the guidance, persistence, wisdom, help, support and encouragement of many whom I would like to thank with greatest regards.
First and foremost, I would like to thank my supervisor Prof. George Karl Knopf for inspiring, guiding and supporting me during this time. I am especially thankful to him for his research insight, constructive criticism, support and encouragement during this long process. He has been a great role model in all respects and has helped me understand the unique challenges in research and taught me to be persistence and patient. This thesis is a direct consequence of his endless patience and support.
I would also like to thank Dr. Robert Canas of the National Research Council of Canada, London for his remarkable guidance, encouragement, and constructive criticism throughout my research. I owe him many thanks for those long technical discussions and help during range scanning. I am also thankful to researchers and staff of NRC-London, especially Steve Kruithof, for his help in operating the FARO® scanner and related software. Special thanks to Ms Percy Gail for editing my research papers for editorial mistakes.
I owe many thanks to my advisory committee, Prof. Ralph Buchal and Prof. Samuel F. Asokanthan, whose insightful suggestions, criticisms, and encouragements helped me to focus and gave me the motivation to learn and overcome some of the challenges. My sincere gratitude goes to department graduate secretaries Belle Smaill, Chris Seres, Susan Bock, and Joanna Blom for their assistance.
I appreciate the help, support and encouragement from all my colleagues in our research team Philip, Matthew, Khaled, Harish and Dogan, it was a pleasure working with you guys.
vi completing this work.
vii x y z = Spatial coordinates of the captured point r g b = Color parameter of the captured point
b = Blue color parameter of the captured point
α = Horizontal scanning resolution
λ = Vertical scanning resolution
PAF = Planar alignment factor
max H
= Maximum horizontal angular spansmax V
= Maximum vertical angular spansN = Number of scanned points in horizontal direction M = Number of scanned points in vertical direction
D = Minimum scanner distance from the wall
dn = Data density distance at nth point
θ = Incident angle
L = Domain length
dalw = Allowable data density distance
nα = Restricted angular span
Ln = Consistent scanning range
ξ = Fraction factor for feature extraction
f = Fraction value for limited scanner distance (D)
θl = Restricted angular span
md = Multiple value for minimum data density distance
x1 = Minimum data density distance
Xn = Linear scanning range
Ol = Overlap distance between consecutive scans
nscans = Number of scans to cover the range
dnc = Measured captured data density
dnc4 = Measured captured data density with four neighboring points
dnc8 = Measured captured data density with eight neighboring points max
n
L = Maximum scanner range
min n
L = Minimum scanner range
viii
tv = Vicinity region thickness
H = Point cloud height
r = Reduction ratio
t = Slice thickness
Ψavg = Average angular deviation value
Ns = Point cloud set in each simplification slice
pi = ith point in the point cloud
qj = jth neighboring point around a point pi
dij = Neighborhood distance vector (qj-pi)
Ψi,j = Angular deviation of distance vector (di,j) from normal vector
n
ˆ
maxv
t = Maximum vicinity region thickness
µ = Division factor for maximum vicinity region thickness
pp = Corresponding projection point for a point ‘p’ in space
mp = Number of linear segments for intersection investigation
fl = Focal length of the digital camera
Oc = Optical centre of shape capturing system
Op = Perspective centre of shape capturing system
xa yb = Projected point coordinates in the optical plane
u, v = Parametric parameters in two orthogonal directions h s v = Hue, Saturation and Value of a data point (p)
q = Number of nearest points for plane approximation
Δh = Hue deviation
Sr = Point data saturation parameter
FDAvg = Fixed distance average of neighboring points
FDN = Number of points in the fixed distance neighborhood
β = Multiplication factor for computing FDNs
Kr = Number of nearest points for computing PAF
arp = Average angular residual value
df = Fixed neighborhood distance
AADD = Adaptive average density distance
DistF = Multiplication factor used with AADD to compute df
ix threshold
avg
θ = Permissible threshold of angular deviation
hthres
= Permissible threshold of hue deviation
thres normVector
λ = Permissible threshold of normal vector
j i r SR,
= Side ratio at the (i, j)th point in M x N points grid along rows
j i c
SR, = Side ratio at the (i, j)th point in M x N points grid along columns
j i l SR,
= Side ratio at the (i, j)th point in M x N points grid in lateral directions
x
CERTIFICATE OF EXAMINATION ... ii
ABSTRACT ... iii
ACKNOWLEDGEMENTS ... v
NOMENCLATURE ... vii
TABLE OF CONTENTS ... x
LIST OF TABLES ... xiv
LIST OF FIGURES ... xv
CHAPTER 1 INTRODUCTION ... 1
1.1 Background and Motivation ... 1
1.2 Problem Formulation ... 3
1.3 Research Objectives and Scope ... 8
1.4 Outline of the Thesis ... 9
CHAPTER 2 LITERATURE SURVEY ... 11
2.1 Introduction ... 11
2.2 Shape Acquisition ... 12
2.3 Scanning Inconsistencies ... 15
2.3.1 Varying data density ... 16
2.3.2 Missing data ... 18
2.4 Post-processing and Information Extraction ... 19
2.4.1 Point cloud simplification ... 20
2.4.2 Feature extraction ... 23
2.4.3 Point cloud segmentation ... 25
2.5 Concluding Remarks ... 29
CHAPTER 3 CONSISTENT DENSITY SCANNING ... 31
3.1 Introduction ... 31
xi
3.3.1 Domain shapes and data characteristics ... 33
3.3.2 Captured data density ... 37
3.3.3 Restricted data density ... 38
3.4 Consistent Point Cloud Scanning Methodology ... 38
3.4.1 Defining allowable data density distance ... 39
3.4.2 Computing permissible scanning range ... 42
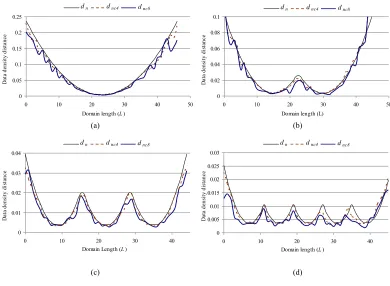
3.4.3 Captured data density evaluation... 44
3.5 Scanning Results and Discussions ... 45
3.5.1 Multiple scan planning ... 46
3.5.2 Scan results of narrow pathway ... 48
3.5.3 Scan data density evaluation ... 51
3.5.4 Real world domain scanning examples ... 53
3.6 Scanning Guidelines ... 57
3.7 Concluding Remarks ... 57
CHAPTER 4 DATA SIMPLIFICATION AND LAYOUT EXTRACTION ... 59
4.1 Introduction ... 59
4.2 Building Features ... 60
4.3 Related Work ... 61
4.4 Data Decimation and Layout Extraction Algorithm ... 63
4.4.1 Slicing a point cloud data set ... 65
4.4.2 Evaluating point’s importance ... 67
4.4.3 Projection based data decimation ... 68
4.4.4 Section layout extraction ... 70
4.4.5 Synthetic simplification ... 72
4.5 Results and Discussions ... 73
4.5.1 Room scan data ... 73
xii
4.5.4 Discussions ... 77
4.6 Concluding Remarks ... 79
CHAPTER 5 COLOR-BASED SEGMENTATION OF POINT CLOUDS ... 81
5.1 Introduction ... 81
5.2 Colored Point Cloud Acquisition ... 84
5.2.1 Colored range scanning ... 84
5.2.2 Colored image mapping ... 86
5.2.3 Color model conversion ... 87
5.3 Color-Based Clustering ... 89
5.3.1 Rough segmentation ... 89
5.3.2 Cluster refinement ... 91
5.3.3 Color based segmentation results and discussions ... 92
5.4 Hierarchical Segmentation Algorithm ... 95
5.4.1 Seed selection ... 96
5.4.2 Cluster expansion ... 97
5.4.3 First stage of hierarchical clustering (planar shapes) ... 99
5.4.4 Second stage of hierarchical clustering (complex surfaces and objects) ... 103
5.4.4.1 Computation of geometric parameters ... 103
5.4.4.2 Data clustering based on color and surface normal ... 104
5.4.5 Hierarchical clustering results and discussions ... 105
5.4.5.1 Planar shape clustering results ... 106
5.4.5.2 Complex surface clustering results ... 108
5.4.5.3 Hierarchical clustering discussions ... 110
5.5 Concluding Remarks ... 112
CHAPTER 6 DISCONTINUOUS BOUNDARY DETECTION ... 114
6.1 Introduction ... 114
xiii
6.2.2 Outlier detection and boundary refinement ... 121
6.3 Result and Discussions ... 123
6.3.1 Side-ratio constraint and boundary data points extraction ... 123
6.3.2 Density based boundary refinement ... 126
6.4 Concluding Remarks ... 128
CHAPTER 7 INFORMATION MODEL EXTRACTION ... 130
7.1 Introduction ... 130
7.2 Simplification and Layout Extraction Applications ... 131
7.2.1 Scene visualization ... 132
7.2.2 Geometric parameter estimation... 134
7.2.3 Emergency route planning... 135
7.3 Segmentation and Occluded Boundary Detection Applications ... 136
7.3.1 Generating multi-level virtual scenes ... 137
7.3.2 Object Identification/inspection/regeneration. ... 139
7.4 Concluding Remarks ... 140
CHAPTER 8 CONCLUSIONS AND RECOMMENDATIONS ... 141
8.1 Review of Algorithms... 141
8.2 Novel Features of the Proposed Work ... 142
8.2.1 Density-based scanning methodology ... 142
8.2.2 Simplification and layout extraction algorithm ... 143
8.2.3 Segmentation algorithms ... 144
8.2.4 Discontinuous boundary detection algorithm ... 145
8.3 Limitations and Current Work ... 145
8.4 Future Work ... 147
8.5 Final Remarks ... 149
REFERENCES ... 152
xiv
Table 3.1: Technical specifications of FARO® laser scanner (LS 880). ... 45
Table 3.2: Experimental parameters for multiple scanning with allowable data density distances. ... 47
Table 5.1: Number of extracted clusters and points in first hierarchical stage using angular deviation and hue constraint. ... 106
Table 5.2: Clustering results of first hierarchical stage. ... 107
Table 5.3: Clustering results of second hierarchical stage. ... 109
xv
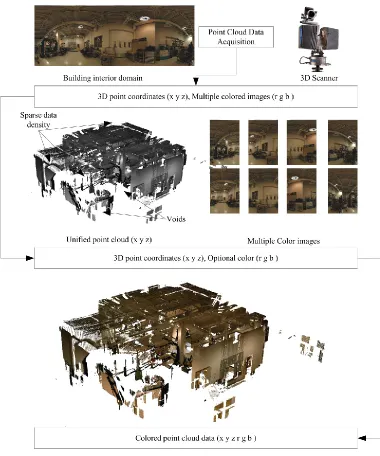
Figure 1.1: Basic scanning process of a building interior. ... 4
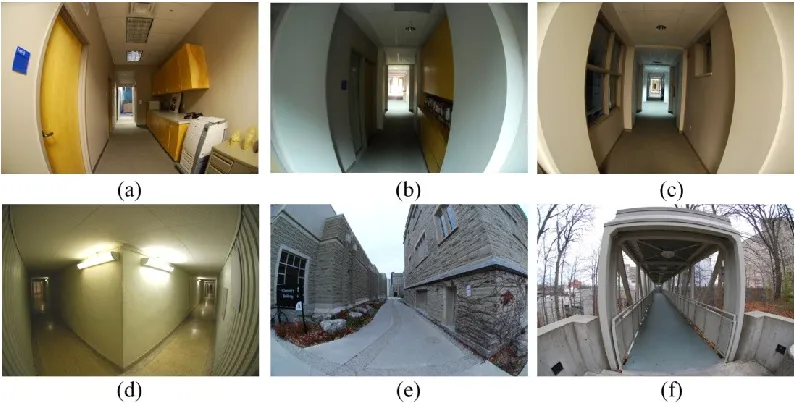
Figure 1.2: Narrow interior pathways and restricted accessibility scanning scenarios (a) Interior corridors (b) Slender over-bridge architecture, and, (c) Interior domains with restricted accessibility. ... 6
Figure 1.3: Captured spatial data from an interior building pathway. ... 6
Figure 2.1: Scanning scenario of multiple objects with a single stationary scanner (top view). ... 15
Figure 3.1: Ideal domains for a stationary scanner for capturing consistent data density (a) Uniform data sets from a spherical domain, and (b) Low density variation in cylindrical domain. ... 34
Figure 3.2: Narrow interior pathways and restricted accessibility scanning scenarios (a, b, c) Interior corridors (d) Under-ground tunnels (e) Constricted exterior walkway (f) Slender over-bridge. ... 35
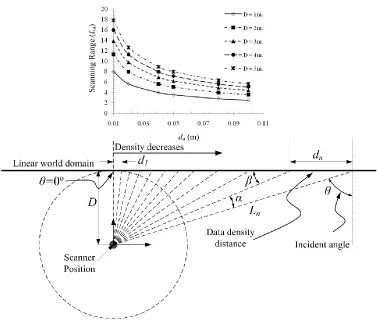
Figure 3.3: Data density distance (dn) variation in a typical narrow domain scanning scenario using a stationary scanner. ... 36
Figure 3.4: Scanning outliers due to mixed pixel problem at silhouette boundary ... 37
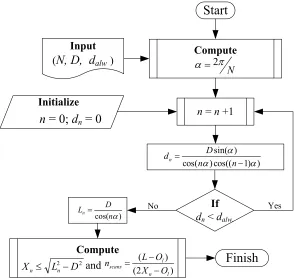
Figure 3.5: Flowchart of the consistent scanning process. ... 39
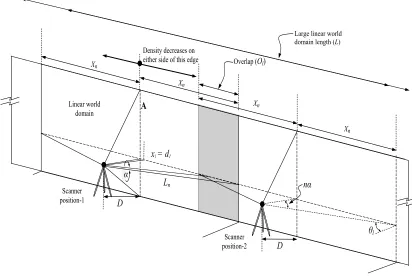
Figure 3.6: Digitizing large linear domain with multiple stationary scanners. ... 43
Figure 3.7: Expected point cloud distribution over a linear domain using stationary scanner. ... 44
Figure 3.8: (a) The scanned domain elevation and its corresponding (b) Scan data with a single stationary scanner. ... 46
Figure 3.9: The locations of the reference elements along the scanned scene ... 47
Figure 3.10: Multiple scan registration for reducing overall data density variation. ... 49
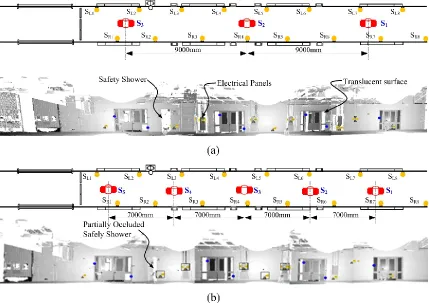
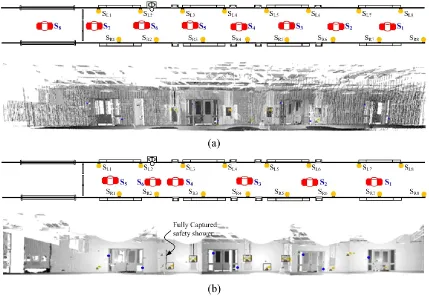
Figure 3.11: The registered scanned data set from multiple scans with (a) dalw =5.3cm. (3 scanning position) and (b) dalw = 3cm. (5 scanning position). ... 50
Figure 3.12: The registered scanned data from multiple scans with (a) dalw = 2cm (8 scanning positions) and (b) dalw =3cm. (5+1 scans for capturing desired feature (safety shower). ... 51
xvi
(c) Exterior facet. ... 53
Figure 3.15: Narrow interior corridors scanning results (top view) of large building using 14 scans for dalw = 5.3cm. (a) Raw registered data and (b) Registered data without the floor data points. ... 54
Figure 3.16: Narrow interior corridors scanning results (top view) of large building using 4 scans for dalw = mdd1 (md = 75) (a) Raw registered data and (b) Registered data without the floor data points. ... 54
Figure 3.17: Interior industrial building scanning results with 37 scans (a) Location of the scanner in an industrial environment (b) Dense registered data with interior data showing the accuracy of multi-scan registration process. ... 55
Figure 3.18: Exterior facet scanning results using 5 scans with dalw=3cm. ... 56
Figure 4.1: Various levels of extractable features from point cloud of building interiors. ... 60
Figure 4.2: The overall process of layout extraction algorithm. ... 64
Figure 4.3: Data segmentation of point cloud by parallel planes. ... 66
Figure 4.4: The height histogram showing the number of points in each slice. ... 66
Figure 4.5: Angular deviation calculations of neighboring vectors. ... 67
Figure 4.6: Vicinity region definition around a section plane. ... 69
Figure 4.7: Plane with projected points from its predefined close vicinity... 69
Figure 4.8: Linear contour generation from projected points ... 71
Figure 4.9: Avoiding self intersections during linear contour generations. ... 71
Figure 4.10: Synthetic curve generation and removal of tiny imperfections. ... 72
Figure 4.11: (a) Room view from front (b) Room’s view from back (c) Scanned point cloud data set of the room. ... 73
Figure 4.12: (a-b) Segmented data slice and (c-f) data set of various data reduction stages. ... 75
Figure 4.13: (a) Point clouds representing section layouts (b) Layout generated using single degree polyline with Rhino®3D, and (c) Layout extracted with connectivity index of 2 using improved polyline methodology. ... 76
xvii
regions and (b) Extracted layout from less cluttered data set. ... 78
Figure 5.1: A schematic diagram of a FARO® scanner with camera mounted bracket. ... 84
Figure 5.2: (a) Scanning position and (b) Colored imaging position of the FARO® scanner. ... 85
Figure 5.3: A typical shape capturing process using (a) 3D point clouds and (b) Color information in terms of multiple colored images. ... 85
Figure 5.4: The principle of generating colored point cloud from point set using FARO® scanner and panoramic color image from digital camera. ... 86
Figure 5.5: (a) Spatial data set without color information (b) A panoramic colored view of the whole room, and (c) Resultant color range scanned data of the room. ... 87
Figure 5.6: (a) RGB color model cube (b) HSV color model cone. ... 87
Figure 5.7: An overview of a pure color-based clustering methodology. ... 90
Figure 5.8: Point cloud stabilization with increased variation in hue value. ... 90
Figure 5.9: Point cloud clustering results of a colored ball (a) Colored ball surface (b) Point cloud data of the ball and its segmented results using the proposed algorithm based on (c) Green and (d) Blue hue parameters... 94
Figure 5.10: Point cloud clustering results of a room scan using the proposed algorithm for (1–3) Green (4-6) Blue and (7-9) Red hue with corresponding clustering parameters. ... 94
Figure 5.11: Refined interior clusters, extracted using the proposed region growth and FDN investigation (β=2; Sr=3%, df =1.5cm.) ... 95
Figure 5.12: Selection criterion of initial seed points (a) Bad seed data point (b) Good seed data point. ... 97
Figure 5.13: Computation of fixed neighborhood distance (df) from local data density defined in terms of AADD. ... 98
Figure 5.14: An overview of the overall hierarchical data clustering methodology. ... 100
Figure 5.15: (a) Angular deviation calculations of neighboring vectors (b) Data clustering based on angular deviation threshold. ... 101
Figure 5.16: Normal vector computation from restricted neighborhood data points. ... 103
xviii
Approximated surface normal at point cloud data set. ... 115
Figure 6.2: (a) Range scanning of multiple objects (b) Scanning characteristics (occluded boundaries), void regions and consistent geometric parameters in discontinuous boundary vicinity. ... 116
Figure 6.3: Flow Chart of the proposed boundary data point extraction algorithm. ... 118
Figure 6.4: (a) Sweeping laser scanning of building interiors (b) Unwrapped domain in the optical plane. ... 118
Figure 6.5: (a) Front view and (b) Isometric view of the captured data from the scan scene of Figure 6.2. ... 119
Figure 6.6: Scanned point cloud data representing an office room (402x963). ... 123
Figure 6.7: Side-Ratios ( ij r SR, , ij c SR, , ij l SR, 1 and j i l SR, 2 ) of the point grid (mxn) of the scanned data of an office room. ... 124
Figure 6.8: Original point cloud data and Identified boundary data points with different lateral side-ratio constraints with ζ = 5, 7.5, 10 and 15. ... 126
Figure 6.9: Refined boundary data points obtained using density-based outlier detection (nthreshold=4). ... 127
Figure 6.10: Detailed views of section S1 and S2 from different view point. ... 128
Figure 7.1: The methodologies and algorithms developed and their probable applications. ... 131
Figure 7.2: Data simplification and better scanned scene visualization. ... 133
Figure 7.3: The sliced data set, computation of geometric parameters and extracted parameters. ... 134
Figure 7.4: Layout extraction with openings for path/route planning. ... 136
CHAPTER 1 INTRODUCTION
1.1 Background and Motivation
The digitization of existing objects and complex 3D environments has emerged as an active research field in virtual reality having diverse applications ranging from anatomical reconstruction, cartography, cultural artefact modeling, digital archaeology, infrastructural renewal, and ‘as built-as design’ evaluations. This reverse engineering process can be divided into two main stages (1) acquisition of spatial geometry and (2) extraction of vital information in terms of key features or complete digital models. The effectiveness of the overall process can be improved by identifying, eliminating or reducing the inaccuracies of the shape capturing process in the first stage and then developing customized post-processing and shape modeling tools for extracting specific geometric information in the second stage.
2007), handling domain specific geometries and complex feature characteristics of large scan scenes is still an open research field.
The geometric information extraction process on the other hand, is highly application dependent. Most published research has mainly focused on reverse engineering of shapes (Curless, 2000; Hoppe, DeRose, Duchamp et al., 1992; Várady, Martin and Cox, 1997), which often rely on adaptive post-processing tools (Breunig, Kriegel, Ng et al., 2000; Davis, Marschner, M.Garr et al., 2002; Knorr, Ng and Tucakov, 2000; Liepa, 2003; Richter, 2009; Sotoodeh, 2006; Turk and Levoy, 1994; Weyrich, Pauly, Heinzle et al., 2004) for compensating the scanning inaccuracies while extracting approximate geometric features, developing fairly accurate model(s) and generating representative virtual environments. Most of these existing techniques (Curless, 2000; Várady, Martin and Cox, 1997) are demonstrated on single, isolated objects, where small inaccuracies are compensated through local approximation. Few other approaches (Alharthy and Berthel, 2004; Elberink and Vosselman, 2009; Pfeifer, Dorninger, Haring et al., 2007; Sampath and Shan, 2007) involving large data sets are developed for building exteriors and structured point clouds captured by airborne scanners, where the scanned geometry is approximated through simplified geometries. Further, these simplified approaches normally focus on large planar structures in the scanned scene alone and omits intricate geometric details of other, relatively small objects.
However, accurate information extraction from point clouds of building interiors is quite challenging task as it has to compensate unstructured point data having varying data density arising due to the stationary position of the scanner and domain's dimensional characteristics. Further, dissimilar surfaces ranging from planar walls to complex objects lying on the floor have to be differentiated for desired feature extraction. The point cloud representing multiple, and, comparable sized objects in the scanned scene, have to be processed, so that individual tools for layout extraction, data decimation, object identification, feature extraction, pattern recognitions, and virtual modeling can be developed.
get the desired information. e.g. geometric modeling through polygonal surfaces (Dey, 2007; Edelsbrunner and Mücke, 1994; Hoppe, DeRose, Duchamp et al., 1992), visualizing point clouds in graphics applications (Adamson and Alexa, 2003; Alexa, Behr, Cohen-Or et al., 2003; Fabio, 2003), data simplification for fast data processing (Alharthy and Bethel, 2002; Araújo and Jorge, 2005; Nooruddin and Turk, 2003; Sampath and Shan, 2007) and segmentation and simplification for improving computational efficiency for individual surface extractions (Boulaassal, Landes, Grussenmeyer et al., 2007; Brenner, 2005; Pu and Vosselman, 2006), modeling (Kim and Shan, 2011; Zhou and Neumann, 2008) and virtual scene creation (Lerma, Navarro, Cabrelles et al., 2011; Lu, Shi and Zhu, 2008).
The effectiveness of all these post-processes not only relies on the accuracy of the initially captured data, but also on the post-processing steps and their suitability for a specific application e.g. hole filling strategies of single isolated objects cannot be extended to building interiors as the multiple regions comprising the hole edges might belong to different objects. Further, a geometric model from such a cumulative point cloud is not of much use except for pure visual scene understanding. Hence, customized tools need to be devised to compensate for domain specific scanning errors and identify and extract application specific features such as building layouts, key surface features, and segmented objects. Later, modeling approaches can be used to generate individual models from these features and segmented data sets representing single isolated objects, if required.
1.2 Problem Formulation
Figure 1.1: Basic scanning process of a building interior.
parameters (r g b) from the mapped pixels from this panoramic image are merged with the corresponding point coordinates (x y z) resulting in colored point cloud (x y z r g b).
A uniform density data set can be captured if the distance between the scanner and the domain’s surfaces remains constant. A moving scanner can maintain this condition to some extent; however, their availability and subsequent registration inaccuracies limit their use. Recently, one such scanner has been proposed (Chen, Kua, Shum et al., 2010; Liu, Carlberg, Chen et al., 2010), which is still in development phase. Thus, a stationary scanner is mainly used to capture large domains and generate point clouds with data inconsistencies. This approach requires effective scanning methodologies and robust data processing algorithms to compensate the data inconsistencies captured in the point clouds.
There are three distinct scanning inconsistencies that are observed in the data set representing building interiors: (1) non-uniform data density, (2) region voids and (3) data cohesiveness arising from stationary scanning of dimensionally incoherent domain having multiple objects and overlapping geometries.
Figure 1.2: Narrow interior pathways and restricted accessibility scanning scenarios (a) Interior corridors (b) Slender over-bridge architecture, and, (c) Interior domains with restricted accessibility.
Figure 1.3: Captured spatial data from an interior building pathway.
The region voids are generated due to the presence of multiple objects and overlapping geometries that partially restricts the surface accessibility in the scanned scene. The scanning process fails to capture these occluded regions and generates corresponding data voids, which are often surrounded by discontinuous boundary of multiple objects. Such voids cannot be approximated from the surrounding data set as in traditional hole filling algorithms (Barequet and Kumar, 1997; Borodin, Novotni and Klein, 2002; Wu, Wang and Han, 2008) of isolated objects. Further, it becomes even more difficult to differentiate these voids if the occluded regions forming these voids are lying very close to each other and have similar surface geometric properties.
representing the desired feature to be extracted. This cohesive point cloud represents geometrically diverse surfaces ranging from large planar regions to intricate interior objects and single coherent approach cannot handle such shape diversity and geometric intricacy. Further, there are instances, where the adjacent scanned regions have similar geometries, but they belong to different objects. In this case, additional geometric parameters, computed from local data are also not able to form a reliable differentiating parameter to extract individual features.
An effective scan planning methodology can play a significant role towards minimizing these scanning issues. However, in the absence of any specific guidelines, the shape capturing process largely depends on a scan planner’s skill alone.
Even highly accurately captured data require effective information extraction algorithms to covert these uninformative point clouds into a usable format. However, the first step of any information extraction process is defining the term information, which varies considerably based on the applications in which the point cloud is to be used. The information may be defined as specific feature geometries, or key dimensional parameters. It may be defined as primitive shape approximation for simple shape representation, decimated data sets for improving computational efficiency, segmented data sets of individual objects or surfaces for creating geometric models or virtual scenes. Thus, individual information extraction processes are to be developed that can process the cohesive and uninformative data accordingly for the desired outcome.
generate specific information extraction tools that can convert the captured data into useful features.
1.3 Research Objectives and Scope
The objective of this thesis is to develop a framework for reverse engineering of building interior environments, where systematic scan planning and subsequent information extraction methodologies are developed. This framework will minimize the domain-specific scanning errors through effective scanning methodology and enable the designer to extract specific geometric information through the proposed tools. Further, as the captured data from large building interiors is often very large, it is desirable that the proposed post-processing and information extraction tools are robust and are applicable directly on the point clouds. In general, this thesis focuses on the two important stages of the overall reverse engineering process of building interiors: shape capture and information extraction.
The first stage is dedicated to the development of a systematic scanning methodology that encompasses the domain’s dimensional characteristics and the restricted scanner’s accessibility and generates a consistent density point cloud. The proposed scan planning methodology provides a mathematical tool that defines the limited domain that can be scanned with desired data density using a stationary scanner. Thus, the number of scans required to cover the whole domain can be computed and the desired data density condition can be maintained.
The second stage extracts specific information from the captured data. The specific requirements of the reverse engineering process involving building interiors are analyzed and the desirable features are identified. This study focuses on few specific features namely layout extraction and data segmentation and develops corresponding feature extraction tools to make the point cloud informative and usable.
(planar) and intricate (interior) data clusters are extracted sequentially. The proposed hierarchal segmentation approach exploits the spatial conformity, local surface geometry and color information to form a reliable segmentation strategy. These proposed approaches work directly on point clouds and no explicit surface reconstruction is involved. A side-ratio constraint algorithm is also presented to identify discontinuous boundaries.
The proposed work will expand the existing literature with a consistent density scan planning methodology and three information extraction tools. The resultant dense point clouds can be directly used for visualization and accurate feature extraction. The direct point-based, layout extraction methodology can be used to extract blueprints, area and volume calculations, and path planning. Further, the individual segmented data obtained through the proposed color-assisted, geometry driven methodology can be used for various applications such as pattern recognition, object identification, floor layout planning, individual geometric modeling and virtual reality environment reconstruction. Finally, the occluded boundaries can be used to refine extracted data clusters and improve scene understanding.
1.4 Outline of the Thesis
The literature review on 3D range scanning of building interiors, scanning inconsistencies, scan planning, layout extraction and data segmentations approaches is discussed in Chapter 2. This chapter also summarizes the common information extraction approaches involving large point clouds data sets and it differentiates them from building interiors applications. It presents the objectives of range scanning of building interiors along with specific requirements and the reason for choosing the specific features, for which the methodologies and tools are developed in this thesis.
The following chapters exhibit three information extraction algorithms. The layout extraction algorithm, data segmentation algorithm and discontinuous boundary detection algorithm are presented in chapters 4, 5 and 6, respectively. All of these algorithms do not require the explicit reconstruction of intermediate surfaces and instead uses inherent characteristics of the point cloud such as spatial coherence, locally computed geometric parameters and color consistency evaluation.
The layout extraction algorithm (chapter 4) identifies planar regions defining the floor plan by retaining the corresponding points using a planar alignment factor. The process omits the complex interior point cloud and the sliced wall data set is used to generate section layouts. Subsequently, the inherent color characteristics are exploited along with the planar alignment factor, spatial coherences and locally computed adaptive geometries to segment the cohesive point cloud using a color based and subsequently shape based hierarchical approach (chapter 5). The shape based hierarchy manages to effectively segment the point cloud from complex as well as simple planar regions. Lastly, a discontinuous boundary detection algorithm (chapter 6) is presented that helps in identifying the occluded region boundaries in the point cloud representing multiple overlapping objects.
Chapter 7 takes a closer look at the proposed methodologies and demonstrated algorithms in terms of the probable applications. It demonstrates the usability of the resultant data in applications such as visualization for virtual reality, building conformance verification for as built as design, floor layout extraction for surveying, geometric parameter computation, navigation path planning and data segmentation for pattern recognition, object identification, and individual geometric modeling.
CHAPTER 2 LITERATURE SURVEY
2.1 Introduction
During scanning of building interiors, the quality of the captured data largely depends on adaptability of the 3D scanning sub-system to the dimensional, positional and topological characteristics of the domain and its objects. A scanning sub-system controls the scanning parameters according to the domain characteristics in such a way that accurate data are captured. The state of this captured data ascertains the level of information that has been captured and can be extracted in subsequent data interpretation stages. Thus, at this stage, it is essential to optimize the 3D scanning sub-system by removing, controlling and minimizing scanning inconsistencies as much as possible so that the captured data are the true representation of the scanned domain. Subsequently, the information extraction sub-system uses data interpretation tools that transform the captured point cloud into desired geometric and spatial features. The development of these domain-specific data interpretation tools requires deep understanding of the domain characteristics in terms of its explicit needs, key features and subsequent applicability of the extracted information.
This chapter discusses the related research work involved in various aspects of a these
two sub-systems of the reverse engineering process involving building interiors. To better
Finally, most of these techniques use an intermediate surface model and are not directly applicable on point clouds, which is much better approach for large point clouds due to their large size.
2.2 Shape Acquisition
The spatial geometry may be acquired by a variety of techniques based on the capturing accuracy, scanning time and capturing mechanism of the scanner and the geometric characteristics of the domains. A detailed shape acquisition pipeline is compiled by Bernardini and Rusmeier (Bernardini and Rushmeier, 2002). Complex 3D shapes are commonly captured using contact or non-contact type acquisition systems. A contact-type system (e.g. a coordinate measuring machine (CMM)) uses a contact probe to capture surface details with high accuracy (Li and Gu, 2004). However, the size restrictions of the acquisition hardware, necessary physical contact of the probe with the scanning objects and significant scanning time limit its applicability to the small objects only.
The non-contact shape acquisition systems (Li and Gu, 2004; Várady, Martin and Cox, 1997) on the other hand, can rapidly capture accurate surface details of very complex objects due to its fast speed. Moreover, no physical contact with the scanning object makes it especially suitable for historical artefacts and delicate objects. This technique emits some sort of light or radiation and detects its reflection from the surfaces in the scanned scene to capture their shape in terms of a set of spatial data points called a point cloud.
Triangulation based scanners shine a laser on the subject and capture its relative position on the object surface in the camera's field of view (Mayer, 1999). The actual position of the surface point in space is determined by triangulating the position of the emitter, camera, and the laser's position in camera's field of view. However, the essential condition is that the surface must be visible in the camera's point of view at all times that requires the laser and camera to be quite close the object surface, making it impractical to scan large objects. Such triangulation-based range finders can scan isolated objects within the limited range and, are not suitable for scanning large structures and complex scenes.
captured by two cameras from different viewing directions. This type of scanning method requires placing the object in converging field of view of the two cameras, which restricts the size of the object that can be scanned. Thus, large structures such as building interiors can’t be captured with this scanner. Their suitability for large structures is also limited due to their lengthy setup time, controlled lighting requirements and structured measurement environments.
Time-of-flight based range scanners on the other hand, can capture geometries by timing the round-trip of a light pulse and thus can captures far-away geometries up to few hundred meters. The accuracy of these captured data is governed by the precision with which the time can be recorded. Other large scale laser scanners measure the surface position by comparing the phase shifts between the reference and the reflected signals of the modulated light. Modern day time-of-flight scanners can compensate for data distortion due to small amounts of vibrations (Blais, Picard and Godin, 2004) and are capable of capturing 10,000~100,000 points every second using system of rotating mirrors. Thus, very large domains can be captured within seconds or minutes based on the required resolution. The fast acquisition speed has helped the 3D scanning process to expand its application to large sites for reverse engineering, infrastructure renewal, as-built drawing generation of large structures, industrial plants, monuments, documentation of historical and cultural sites, site modeling, feature extraction, quantity surveying, freeway redesigning, creating geographic information system (GIS) maps, and virtual reality modeling etc.
require a large number of images which is limited by time or location constraints. Moreover, the process of converting 2D images to 3D data sets requires typical photogrammetric pipelines based on sensor calibration, feature characteristics, image orientation and surface measurement techniques and it does not straightaway generate 3D data set unlike time-of-flight and phase shift scanners.
Several other methods can also extract 3D shapes through extraction of iso-surfaces from CAT scans (Rocchini, Cignoni, Montani et al., 1999; Sun, Tian, Wu et al., 2010), shape carving of video streams (Polleyfeys, Koch, Vergauwen et al., 1999) and shape extractions from passive silhouettes (Zheng, 1994), however, their capturing accuracies and modeling approaches limits their applicability to large domains such as building interiors.
In conclusion, the non-contact based range scanners working on the time-of-flight or phase-shift principles (Callieri, Cignoni, Dellepiane et al., 2009; Schuon, Theobalt, Davis et al., 2008) exhibit fast shape acquisition, higher geometric precision and direct generation of 3D point clouds and hence, are commonly used in a typical shape acquisition pipeline of building interiors.
This diverse spectrum of applications uses the captured data in their own unique way according to their explicit set of requirements. Unfortunately, the immense point clouds acquired by these non-contact range scanners include random scanning errors arising from sensor accuracy and the object's surface properties and other systematic scanning errors, originating from domain-specific parameters (domain size, presence of multiple objects, relative location of objects and scanner). The random errors introduce noise, erroneous outliers, missing regions, and sampling inconsistencies in the captured data sets. These errors can be minimized with improved hardware, but small amount of such errors are ubiquitous in the captured data. Additionally, systematic errors are responsible for generating inconsistent data density, large data voids and occluded boundaries due to domain-specific characteristics such as multiple overlapping objects and limited scanner positions.
2.3 Scanning Inconsistencies
In the context of interior building scanning applications, a stationary scanner is often used that projects a laser beam onto an angled rotating mirror, which reflects the beam to the scanned scene. The whole scanning unit also rotates around the vertical axis and thus captures everything in its whole 360° in its horizontal plane and about 320° in the vertical plane due to the position of the scanner. A stationary scanner often captures the spatial geometry using a horizontal scanning resolution (α), which is fixed for the whole horizontal domain. Thus, as the region is located away from the scanner, the distance between two consecutive points reduces and only sparse data density can be captured in this region. This condition is highly prevalent in interior domains having large dimensional disparity. The accuracy is lost due to two primary reasons (1) varying density that decreases as the distance of the surfaces from the scanner increases and (2) increased span of the missing data due to occluded objects at large angular obliquity. e.g. in Figure 2.1, a stationary scanner is shown that captures a point cloud from multiple objects in the scanned scene, as can be seen, with the fixed horizontal scanning resolution (α), the spacing between the captured data points increases away from the scanner. Further, the size of missing wall geometries (A' and B') also increases for the same sized overlapping objects (A and B), lying at varying distances from the scanner.
Figure 2.1: Scanning scenario of multiple objects with a single stationary scanner (top view).
2.3.1 Varying data density
A density variation in the data set is the result of erroneous outliers or under-sampled data due to the scanning mechanism of a stationary scanner. An outlier is defined as an “observation that deviates so much from other observations so as to arouse suspicion that it was generated by a different mechanism” (Hawkins, 1980). It often represents false data point in Cartesian space due to overlapped signal from multiple surfaces. In case of large, occupied building interiors with multiple objects in the scanned scenes, outliers are often recorded along the edges of occluded objects along the scanning rays (Kua, Corso and Zakhor, 2012) due to partially reflected signals from the foreground and background objects.
The under-sampling on the other hand is a systematic error of a stationary scanner, due to
which the far-away surfaces are captured with lower data density and can be controlled with effective scan planning.
Outliers are generally identified and removed during post processing stage using distance (Knorr, Ng and Tucakov, 2000) or density (Breunig, Kriegel, Ng et al., 2000; Sotoodeh, 2006) characteristics of the neighboring data points or are extracted as by-product of data clustering process (Jain, Murty and Flynn, 1999; Rousseeuw and Leroy, 1987; Sotoodeh, 2007).
trends in this field including semi-supervised clustering, ensemble clustering, simultaneous feature selection clustering and large scale data clustering.
However, the performance of all these post-processed outlier detection methodologies is largely dependent on the initial characteristics of the scanned data and the local variation of point density affects the accuracy of the extracted outliers. Thus, an effective scanning methodology needs to be adopted that generates an initial point set with consistent data density, which minimizes the need of subsequent post-processing strategies or increase their reliability.
In contrast, under-sampled data sets or voids represent regions with low point cloud density or missing data, respectively. Under-sampled data sets often lead to inaccuracies in extracting the details of individual features. Most existing post processing techniques (Barequet and Kumar, 1997; Carr, Fright and Beatson, 1997; Curless and Levoy, 1996; Davis, Marschner, M.Garr et al., 2002; Liepa, 2003; Nooruddin and Turk, 2003; Weyrich, Pauly, Heinzle et al., 2004) focus on void filling strategies and compensate for under-sampling by interpolating the rough surrounding surface to increase data density and fill the missing gaps with synthetic data points and do not work directly on the point cloud data. For large objects and spaces, the regions with missing data may become significant because huge occlusions can exist between neighboring structures or discontinuous surfaces. The traditional void filling approaches are based on triangular meshes (Barequet and Kumar, 1997; Davis, Marschner, M.Garr et al., 2002; Nooruddin and Turk, 2003) or volumetric implicit surfaces (Carr, Fright and Beatson, 1997; Curless and Levoy, 1996; Liepa, 2003; Weyrich, Pauly, Heinzle et al., 2004) and extending these approaches to very large data sets with multiple holes and density variations often leads to topological issues due to unknown shape semantics and unguided neighborhood connectivity of disjointed regions. Moreover, it is computationally very expensive to use these techniques on large volume scanned data (106 to 108 data points) representing building interiors.
scanner captures the surrounding data from nearest surfaces while sitting on the back of a moving person. This back pack scanner is focused mainly on visualization applications, where the simplified geometry is superimposed with their corresponding images. Hence, geometric details of interior space are not captured accurately. Moreover, the Global Position System (GPS) locations used to register multiple scans are to be mapped to known coordinates and require robust and accurate geometric accuracies that the present GPS systems lack, especially in interior environments. Another researcher group (Ohno, Kawahara and Tadokoro, 2009) has proposed a scanner that controls the scanning parameters based on the initial guess of the shapes to capture dense point clouds from complex objects. It controls the angle and the angular velocity of the pan-tilt mechanism and thereby captured higher data density from complex regions. This time consuming process requires multiple scanning of the domain, recursively computing the captured density and re-scanning the regions with enhanced data density. The process might not work in environments, where the domain can’t be isolated for such a long time. Both these scanners are at their initial development stages and are not commercially available. Therefore, the domains are mainly captured using stationary scanners, which necessitates an effective scanning methodology that captures maximum surface geometry and minimizes subsequent data approximations must be devised in order to ensure shape capturing accuracy.
A consistent data density is essential to support direct point based modeling schemes (Alexa, Behr, Cohen-Or et al., 2001; Linsen, 2001) for representing scanned surfaces in both modeling (Alexa, Behr, Cohen-Or et al., 2003; Alexa, Behr, Cohen-Or et al., 2001; Fleishman, Cohen-Or, Alexa et al., 2003; Guennebaud and Gross, 2007) and computer graphic applications (Adamson and Alexa, 2003; Amenta and Kil, 2004; Duranleau and Poulin, 2006; Kalaiah and Vashney, 2003). A direct point based visualization approach is very helpful in accessing the quality and relevance of the captured data without generating intermediate surfaces, which are normally not required in scanning scenario of building structures involving multiple objects with varying feature sizes.
2.3.2 Missing data
interiors, the size of the missing data is large and it often corresponds to the occluded geometries of multiple objects and their relative locations from the scanner.
Most applications involving isolated objects approximate the missing data through post-processing using hole filling strategies, which are primarily based on surface approximation of intermediate triangular meshes (Barequet and Kumar, 1997; Davis, Marschner, M.Garr et al., 2002; Nooruddin and Turk, 2003) or volumetric implicit surfaces (Carr, Fright and Beatson, 1997; Curless and Levoy, 1996; Weyrich, Pauly, Heinzle et al., 2004). Generating an intermediate meshed model from very large and unified point clouds is not viable, and is not required, as it is essential to segregate individual data sets representing multiple objects in order to extract desired geometric features or individual surface models. Multiple range scans can be registered (Bornaz, Lingua and Rinaudo, 2003; Hu, Zha and Zhang, 2006) to capture missing regions and large domains. However, it requires meticulous scan planning that depends on the planner's skill level and no explicit guidelines are available that can assist in scanning large interior domains.
Thus, a systematic shape acquisition pipeline must be devised that captures maximum surface geometry and minimizes subsequent data approximations in order to extract accurate shape information in various down-stream applications. An explicit set of scanning guidelines will assist the designer to plan an effective scanning strategy that generates point clouds with desired set of data characteristics in terms of point cloud density and missing occlusions.
2.4 Post-processing and Information Extraction
attempts to reconstruct the scanned environments. It is essential to identify the application specific needs in order to devise post-processing methodologies for that specific application. The following sub-section describes some of these needs and their current research status for applications involving building interior.
2.4.1 Point cloud simplification
The shape acquisition mechanism of a typical range scanner cannot differentiate surface complexities of geometrically diverse objects lying at similar distances from the scanner. Such equidistant objects are captured with comparable data density. The scanner's parameters are often set in such a way to capture high density data sets to ensure that sufficient surface geometry from complex shapes is recorded. This leads to over-sampled data points representing simple surfaces such as planes. The high density data points for such simple surfaces are to be simplified to make it usable for most successive applications.
An adaptive triangulation (Akkouche and Galin, 2001; Araújo and Jorge, 2005) of implicit surfaces can extract a decimated, smooth and water tight triangulated model by optimizing the sizes of the triangles. However, such a model approximates the underlying implicit surface model only and not the original point cloud data set. This method is also computationally expensive, especially for large spatial data such as building scans.
Direct point cloud simplification, on the other hand, attempts to reduce the number of data points without generating any intermediate surface. Lee et al. (Lee, Woo and Suk, 2001) presented a normal deviation driven, octree-based spatial subdivision strategy to extract a representative 3D data point from each cell for data simplification. However, it requires a structured and noise free point cloud for simplification. Another height decision method (Chang and Chang, 2002) was used to remove points from the non-contour part of the data set with a limited applicability for non-complex contoured surfaces. Pauly and others (Pauly, Gross and Kobbalt, 2002; Pauly, Kobbalt and Gross, 2004) modified the mesh-based simplification theory to achieve point-based simplification for point-based graphics and multi-resolution surface modeling using the moving least square (MLS) method and iterative simplification process. This method re-computes the MLS surface after each point removal and is computationally expensive. Song (Song and Feng, 2008) proposed an approach of progressively removing the non-boundary points. This algorithm is also computationally expensive and cannot be extended to objects that have no distinct boundaries. The applicability of direct point cloud simplification method is advantageous but it requires complex, recursive computation, which is often expensive.
simplify a point cloud by removing the non-feature data points while retaining the data points representing a specific feature such as roofs (Vosselman, Gorte, Sithole et al., 2004), walls, doors (Pu and Vosselman, 2006) and windows (Pu and Vosselman, 2007). The later approach focuses on the segmented data regions representing the desired feature and simplifies the data set by removing non-feature data points. However, as the primary objective of these processes is surface modeling and not explicit data simplification, thus, it often over-simplifies the scanned geometry, especially the regions with complex geometries.
A few researchers (Bahmutov, Popescu and Mudure, 2006; Barnea, Filin and Alchanatis, 2007; Budroni and Böhm, 2009; Wang and Luebke, 2003) have demonstrated the simplification strategies on triangulated models, which are generated from interior point cloud data. A simplified triangulation model (Wang and Luebke, 2003)was used that integrates the scanned data using local normal and confidence-level semantics along with weighted color and texture coordinates. Such a cumulative triangulated model can enhance the overall visualization of the scanned scene, but it cannot differentiate geometric diversity of individual objects in the scene. Another similar method (Bahmutov, Popescu and Mudure, 2006) had demonstrated a rapid simplification methodology for large interiors using simple shape semantics and registered textures, e.g. an approximated rectangular cuboids with mapped textures can be used to represent long pathways in building interiors. This approach generates visually appealing results with limited geometric accuracy. A plane sweep algorithm based method (Budroni and Böhm, 2009) recognizes the planar structures of a room in the vertical and horizontal directions, sequentially. Thus, points representing walls, ceiling and floor are segmented and are approximated by simplified planar data sets. The result generated simplified surface models of piece-wise planar data sets.
2.4.2 Feature extraction
The point cloud data set of occupied building interiors represents unified point clouds from multiple objects that involve wide range of features. It is essential to transform this raw data into some usable format through specific feature extraction or segmentation. Such post-processing of data is governed by characteristics of the scanned scene and the subsequent usability of the captured data.
Specific feature extraction approaches often rely on a priori knowledge of scanned features and segregation of corresponding point clouds. A semantic knowledge management system (Duan, Cruz and Nicolle, 2010) was proposed to classify the building elements for architectural reconstruction based on their geometry (points, planes) and building elements (walls, floors, ceilings, door and windows). Rusu et al. (Rusu, Marton, Blodow et al., 2008) presented a similar object/feature classification in a typical household (kitchen) environment. They also generated methodologies to extract and model these specific features from the corresponding point cloud data sets for virtual reality reconstruction. Similar context-based methodologies are being developed by Dr. Huber's group at the Robotic Institute of Carnegie Mellon University (Huber, Akinci, Tang et al., 2010; Oliver and Huber, 2010; Xiong and Huber, 2010), which aims to generate semantic 3D models of indoor environments. The methodology requires a priori knowledge of the building features and shape semantics. However, the type of feature to be extracted depends largely on the application of the extracted data and can be anything from floor plan layouts, doors, windows, wall features, and interior objects of the 3D-scanning environments.
presented for an urban excavation application. This paper describes the planning, execution, and data processing phases of collecting accurate construction information with an unprecedented level of detail on the as-built site conditions. The usability of 3D range images is extended to interior design applications in a feasibility study (Shih and Hu, 2007). In this paper, the captured range images are mainly utilized for visual inspection only and a feasibility study is proposed for applications involving design modeling, production drawing, construction monitoring and follow-up interior maintenance and management. However, the feasibility study needs to be demonstrated on real applications that require the development of robust geometric data extractions strategies by solving issues such as identifications of occluded geometries and voids, establishing individual feature correspondence and segmentation of cohesive data.
distance threshold of points from the sweeping plane. Most of these methods solve the floor plan problems as a sub-part of a more complex problem, which is often computationally expensive due to the huge size of the point cloud.
A relatively simple layout extraction approach works on the partial scanned data captured from a single horizontal slice of the domain. A piece-wise linear model is fitted to this data set and layouts are extracted using traditional iterative point fitting (Duda, Hart and Stork, 2001), split and merge (Pavlidis and Horowitz, 1974) and other similar, computationally inexpensive approaches (Nguyen, Gächter and Martinelli, 2007). However, these approaches are unable to successfully fill the gaps created during scanning due to occlusions. Thus, it will be useful to generate direct point based approaches and extract layouts from sliced data sets from 3D point cloud data sets.
2.4.3 Point cloud segmentation
One of the most important aspects of automatic and semi-automatic generation of 3D and building information models (BIM) from point clouds is the fragmentation of the data into manageable clusters. The convenience of segmenting such small clusters helps in reducing the computational cost and simplifying the scanned scene besides extracting specific geometric information. Such segmentation is even more crucial for cases representing large point clouds of building interiors.
The segmentation-based simplification of exterior point clouds lies in the fact that the unimportant points (ground points) are equidistant from the airborne scanner and thus their depth analysis often forms the basis of a reliable classification strategy. Moreover, such segmentation strategies operate under the assumption that the scanned surfaces are unobstructed. In an indoor environment, the surfaces are often obstructed by multiple objects in the scanned scenes. Additionally, the varying distance of these surfaces from the scanner generated non-uniform data sets, which increases the segmentation complexities.
Relatively few segmentation methods have been applied successfully to range scans of building interiors. A hybrid approach (Wolfart, Sequeira, Ng et al., 1999) was proposed for surface segmentation of the triangulated interiors through data re-sampling, local surface fitting, and discontinuous edge detection to solve the problem of segmenting building interiors. Although the technique produced satisfactory results for large planar regions such as walls and cabinets, the algorithm could not accurately cluster points that lie on small objects with freeform shapes due to inadequate seed points. To address this problem, Rabbani (Rabbani, Heuvel and Vosselman, 2006) used normal residuals to identify reliable seed points in the cloud and a normal deviation-based smoothness parameter for region growing. The method was able to successfully extract unique clusters from a scanned industrial environment. The computed geometric parameters were, however, not highly reliable and prone to significant errors in overlapping regions which lead to data over-segmentation. In contrast, a plane-sweep algorithm (Budroni and Böhm, 2009) was proposed for segmenting 3D point clouds into planar clusters. The relative advantage of this approach is that it works directly on sampled points instead of tessellated surface-based approaches (Rabbani, Heuvel and Vosselman, 2006; Wolfart, Sequeira, Ng et al., 1999). Although effective, the technique omits all non-planar data points and is an approximation rather than the segmentation technique. Therefore, it cannot directly be used to segment building interiors that contain desks, chairs and personal items.
it to generate the adaptive model. Similarly, a prior knowledge regarding the feature sizes, positions, and topologies is beneficial in recognizing specific elements (doors, windows, roof and walls) in a point cloud (Pu and Vosselman, 2009; Vosselman, Gorte, Sithole et al., 2004), which can help in differentiating primitive shapes, such as planes, cylinders and spheres by means of non interactive methods to detect clusters. Other strategies segment planes using the RANSAC algorithm (Boulaassal, Landes, Grussenmeyer et al., 2007). Although these approaches have been demonstrated on exterior facets but the methodology is applicable to interior environments as well and need further investigations.
In building interior environments, in addition to structural elements, the space is often occupied by furniture and other objects, which create large occlusions during scanning. These interior objects influence the detection of major structural elements such as walls, floor and ceiling. (Dell’Acqua and Fisher, 2002) showed a technique to reconstruct the shape of planar surfaces behind arbitrary occluding surfaces by combining small planar regions with similar geometric properties. An edge based planar reconstruction methodology (Castellani, Livatino and Fisher, 2002) was also proposed by combining occluded edges of the interior objects. Wang and Oliveira (Wang and Oliveira, 2007) proposed a smooth surface reconstruction methodology that was able to fill small occlusions in relatively complex areas. Recently, a labelling and merging algorithm (Oliver and Huber, 2011) was presented, in which the regions are identified, labelled and are grouped together to create hole free planar regions such as walls. The approaches have been demonstrated on relatively less cluttered data sets involving small objects. Moreover, such methods can extract only primitive surfaces from the point clouds.