The Support Vector Machine Technique for
Islanding Detection in Distributed Generation
S.Savitha1, N.Kayalvizhi2
PG Student [PSE], Department of EEE, K.S.Rangasamy College of Technology, Tiruchengode, Tamilnadu, India1 Associate Professor, Department of EEE, K.S.Rangasamy College of Technology, Tiruchengode,Tamilnadu, India2
ABSTRACT:The detection of the islanding condition of a Distributed Generation (DG) system is crucial for safety reasons, so that the fast recognition of the potentially dangerous conditions is very crucial for allowing sufficient time to take emergency control actions. Monitoring the stability status of a power system in real time has been recognized as a task of primary importance in preventing blackouts. In this paper, an SVM classifier is used to develop a technique that can predict fault state and immediately disconnect the DG by receiving the trip signal. The voltage and current signals can be extract at the point of common coupling with the grid by using autoregressive signal modeling and extracted signals is used as input to the SVM to predict the islanding state. The extensive study is performed on the IEEE 9 bus system and feature vectors corresponding to various islanding and nonislanding conditions are used for support vector machine classifier training and testing. Computer simulation is done with MATLAB.
KEYWORDS: Distributed Generation, Wind Energy, Support Vector Machine (SVM), Islanding detection, Microgrid.
I.INTRODUCTION
Due to the increased prices of fossil fuels such as oil and natural gas, the electric power industry will undergo considerable and rapid change with respect to its structure and operation. In order to reduce environmental problems and to cope with rising energy prices and construction costs of power plant, power utilities are concerned with distributed generators including photovoltaic, wind farm, fuel cells and internal combustion engine generators as many good alternatives. The most possible solutions for aforementioned problems is the distributed generation (DG). The DGs are connected in parallel to the power supply in the power grid and local loads. DG should supply the generated power to the network loads only if the utility power supply is present.Therefore, DG must be operated in such an inherently safe manner.
When the degree of DG penetration into a system becomes sufficiently large to allow a near balance between DG capacity and local off-peak load, the risk of islanding is possible. When a part of the distribution system is electrically isolated from the rest of the power system, islanding occurs and it continue to be excited of decentralized producers to the subsystem is isolated. The few issues regarding the connection of these resources for supply companies and the interconnection can be complicated with connection with electric power system. The methods of islanding detection can be divided into active methods, passive methods and communication techniques.
In active methods fault signal is on certain parameters of voltage and current at the PCC, so that islanding condition can be detected [1]. Active methods have a feedback technology or control mechanism that detects changes in either the incidence or the voltage at the PCC. Impedance method is one [4] in which, if utility is disconnected, this variant will force detectable change in voltage at the PCC, which can be used to detect islanding condition. This method is also known as the impedance measurement method. The most important feature of this method is relatively small NDZ for individual inverters for all local shops. This method shows poor results when several inverters are connected in DG.
DG [8,10]: voltage unbalance and the Total Harmonic Distortion (THD) of the current and Phase jump detection (PJD) method [2] includes the monitoring of the phase offset between the voltage at the PCC and the converter output current. This method is used for current source inverter. In the case of voltage inverter method phase shift between the current at the PCC and the converter output voltage is observed.
Islandings detection and protect the equipments in power system is the most important issues to address in DG applications. The electric power utilities invested huge money for expanding transmission and distribution structure of power supply because of the fast growing demand of electric energy. Unpredictable islanding of distributed power generation system causes electrical damage to customer equipment, poor power quality, and even safety hazards for humans. For these reasons, it is supposed to detect the islanding condition quickly and reliably.
SVM tool has become a popular technique for power systems analysis, such as load or device type identification in an electrical system, power system transient stability assessment, distance relay blocking and blackout mitigation etc. SVM is studied in for the islanding detection[6]. The features can be extracted by the Wavelet Transform (WT) from the current signal at PCC. However, it is well known that the major drawback for the WT like sensitivity to the noisy condition.
The paper is organized as follows. Section II presents the distributed generation of wind energy. Section III explains the Autoregressive modeling and SVM Technique. Section IV provides simulation results that highlight the performance and corresponding waveform of the proposed technique. Lastly, conclusions are drawn in Section V.
II.DISTRIBUTED GENERATION OF WIND ENERGY
The grid connected with DG must synchronize its frequency with that of the grid (e.g. 50 Hz) using a local oscillator and limit the voltage to equal the grid voltage. Wind turbines are also distributed energy resources because of having low maintenance, low pollution, and also low costs. However, as with solar, wind energy is variable and non-dispatchable. Wind towers, shafts and generators have substantial insurable liabilities caused by high winds, but good operating safety.
While renewable energy systems are capable of powering houses and small businesses without any connection to the electricity grid, many people prefer the advantages that grid-connection offers.
A grid-connected system allows power to home or small business with renewable energy during those periods (daily as well as seasonally) when the sun is shining, the water is running, or the wind is blowing. Any excess electricity produced is fed back into the grid. When renewable resources are unavailable, electricity from the grid supplies the needs, eliminating the expense of electricity storage devices like batteries.
In addition, power providers (i.e., electric utilities) in most states allow net metering, an arrangement where the excess electricity generated by grid-connected renewable energy systems "turns back" the electricity meter as it is fed back into the grid. If the use more electricity than the system feeds into the grid during a given month, pay to power provider only for the difference between power used and power produced.
Grid-connected domestic wind turbines may use grid energy storage, thus replacing purchased electricity with locally produced power when available. The surplus power produced by domestic microgenerators can, in some jurisdictions, be fed into the network and sold to the utility company, producing a retail credit for the microgenerators owners to offset their energy costs.
Fig-1 Grid Connected Distributed Generation with SVM Controller
A Phase-Locked Loop or Phase Lock Loop (PLL) is a control system that generates an output signal whose phase is related to the phase of an input signal. While there are several differing types, it is easy to initially visualize as an electronic circuit consisting of a variable frequency oscillator and a phase detector. The oscillator generates a periodic signal.
The phase detector compares the phase of that signal with the phase of the input periodic signal and adjusts the oscillator to keep the phases matched. Bringing the output signal back toward the input signal for comparison is called a feedback loop since the output is "fed back" toward the input forming a loop. In a typical grid-connected inverter system, PLL is generated the system frequency by taking samples of the PCC voltage. Therefore, the bandwidth of the power control loop would be much larger than the bandwidth of the PLL. The dq frame angular speed is related with angle δ for abc to dq and dq to abc transformation is the output of the PLL.
= (1) The active and reactive powers of inverter at PCC are controlled on the basis of orthogonal components of the inverter currents i.e., dq frame of reference and a proportional plus integral (PI) controller regulates the q-component of PCC voltage (vpq) to zero. The simplified expression for instantaneous active and the reactive power at PCC can be
expressed as (2) and (3). Thus
= (2) = (3)
where and are the d-q components of the inverter currents, and are the d-q components of the PCC voltage.
III. AUTOREGRESSIVE MODELING AND SVM TECHNIQUE
which depends on the length of the signal being processed. On the other hand, DWT has high frequency resolution, but it has a few major drawbacks.
DWT performance depends on the right selection of the mother wavelet and decomposition level. Moreover, DWT is characterized by an inability to obtain correct signal features in noisy conditions and it requires additional preprocessing to suppress signal noise. This will increase algorithm complexity and time delay. As opposed to nonparametric methods that do not require any prior knowledge about the signal, in the case of model-based methods one may assume that the signals are generated from certain models. The AR parametric modeling has found broad applications in analysis of biomedical signals and recently has been discovered as a powerful tool for power system disturbances analysis, such as low frequency oscillations estimation and fault detection and location . In this paper, AR is used as feature extraction tool for the islanding detection problem. This section describes the basic theory for parametric modeling of signals using AR method. By using AR approach the signal is represented as the response of a linear time invariant system with white noise as input, where the system is modeled by finite number of poles. In a AR(p) model, the data sample at time t is defined by the following equation:
( ) =− ∑ ( − ) + ( ) (4) where
AR coefficients; ( ) white Gaussian noise;
noise variance.
This is equivalent to ( ) being the output of an all-pole system ( ) whose input is the white noise ( ). The transfer function of the all-pole system is
( ) = ∑
(5) As a result, estimating the frequency spectrum of ( ) becomes estimating the model parameters under a selected criterion. The covariance expression of the AR process may be used to estimate , i = 1 . . . p
parameters by replacing the true auto-covariance function ( ) = { ( ) ( − )}.
( ) +∑ ( − ) = 0, ≥0 (6) and
( ) +∑ (−) = , = 0 (7) From (6) and (7) for k = 1, . . . , p Yule–Walker or normal equations are obtained
⎣ ⎢ ⎢ ⎢
⎡ (0) (−1) … . . (− )
(1) (0) … . . (1− )
… . ..
( ) ( −1) … . . (0) ⎦⎥ ⎥ ⎥ ⎤ ⎣ ⎢ ⎢ ⎡1 .. ⎦ ⎥ ⎥ ⎤ = ⎣ ⎢ ⎢ ⎡ 0 .. 0⎦ ⎥ ⎥ ⎤ (8)
The AR model gives inherent data compression without loss of essential information and smooth frequency spectrum can be obtained from AR coefficients, while maintaining all important signal features. The zero power mismatches represents system state when RLC load parameters are tuned to the certain values that the active/reactive power dissipated by the load is equal to the active/reactive power generated by the inverter. Thus, there is no power infeed from the grid side to the load node.
performance of the SVMs is found to be better than Artificial Neural Networks (ANNs) due to the reason that the ANNs essentially follow Empirical Risk Minimization (ERM), whereas the SVMs are based on Structural Risk Minimization (SRM) .The classical adaptation algorithm in ANN works on minimizing an absolute error or an error, while SVMs minimize the Vapnik–Chervonenkis (VC) bounds.
According to Vapnik’s theory , minimizing the VC bounds means that the expected probability of error is low, which implies a good generalization . SVMs have been successfully applied to various classification and machine-learning applications . For classification problems, the SVMs try to find a hyperplane to separate the data points according to their classes so that the separation between the classes is maximum. In such a case, the hyperplane is said to be an optimal hyperplane. The data vectors used to train classifier consist of the feature vectors and one class label. The aim of the SVM classifier is to produce data model in the training phase that will predict the class label in the testing phase where only feature attributes are used as inputs. A special characteristic in designing a SVM is that, instead of the dimension reduction commonly employed in conventional pattern recognition systems, the input space in a SVM is nonlinearly mapped onto a high-dimensional feature space. The result is that the classes are more likely to be linearly separable than in a low dimensional feature space.
Fig-2 Optimal Hyperplane of Support Vectors
An optimal hyperplane is here defined as the linear decision function with maximal margin between the vectors of the two classes in Fig. 2. It was observed that to construct such optimal hyperplanes one only has to take into account a small amount of the training data, the so called support vectors, which determine this margin. It was shown that if the training vectors are separated without errors by an optimal hyperplane the expectation value of the probability of committing an error on a test example is bounded by the ratio between the expectation value of the number of support vectors and the number of training vectors:
[Pr( )]≤ [ ]
More formally, a support vector machine constructs a hyper plane or set of hyperplanes in a high- or infinite-dimensional space, which can be used for classification, regression, or other tasks. Intuitively, a good separation is achieved by the hyperplane that has the largest distance to the nearest training-data point of any class (so-called functional margin), since in general the larger the margin the lower the generalization error of the classifier. Whereas the original problem may be stated in a finite dimensional space, it often happens that the sets to discriminate are not linearly separable in that space. For this reason, it was proposed that the original finite-dimensional space be mapped into a much higher-dimensional space, presumably making the separation easier in that space.
To keep the computational load reasonable, the mappings used by SVM schemes are designed to ensure that dot products may be computed easily in terms of the variables in the original space, by defining them in terms of a kernel function selected to suit the problem.The hyperplanes in the higher-dimensional space are defined as the set of points whose dot product with a vector in that space is constant. Given a training set of instances and class label pairs
( − ) i=1……lwhere ∈ and ∈ {1,−1}l, the SVM requires the solution of the following optimization problem.
subject to
( ( ) + )≥1− , (⩝) ≥0 (10) Here training vectors are mapped into a higher dimensional space by the function . In the training process the support vectors from the training data will be selected and used to predict unseen data. Parameter C > 0 is the penalty factor of the error term and may be seen as factor that controls the tradeoff between separation margin and training errors, while ‖ ‖ is a norm to the vector perpendicular to the separation hyperline and are slack variables which measure degree of misclassification. Furthermore, , = ( ) represents the kernel function. Despite many kernels being proposed by researchers, in this paper radial bias function (RBF)
, = , > 0 (11)
kernel is used. C and can be determined experimentally through a grid search and cross-validation process.
IV. ANALYSIS AND RESULTS
The 550V, 50 Hz power supply is generated by wind power distributed generation and then it is connected to MOSFET based inverter. The inverted voltage is connected to the grid and supply to the load which is connected in the tie line. The test system Table-1 employed to take out the simulations regarding the islanding detection.The system of 3-phase, 550V, 50 Hz generating system is feeding power to the load. The proposed SVM detection method is carried out using simulation. The three phase voltage from distributed generation of wind plant and the corresponding waveform is shown in Fig-3. The normal three phase sine waveform is obtained. Under normal conditions, the voltage and current at PCC and the corresponding waveform is shown in Fig-4.
Table-1 System Parameters
S.No SYSTEM QUANTITY SPECIFICATION
1 Source 3-phase, 550V, 50 Hz
2 Inverter specifications MOSFET Based, 3 Arms, 6 Pulse, Carrier Frequency=1080Hz, Sampling time=5µs
3 PI controller Kp=0.5, Ki=50, Sampling time=50µs
Fig-3 Output Voltage of wind plant
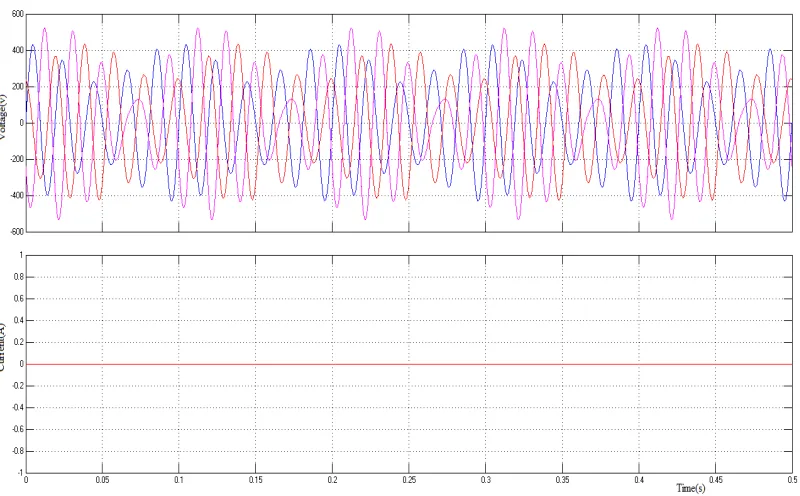
Fig-4 Voltage and Current at PCC under Normal Condition
Fig-5 Voltage at PCC under Fault Condition
Fig-6 Current at PCC under Fault Condition
The current at PCC under fault condition is varying and the corresponding waveform is shown in Fig.-6. The above figure shows frequency deviation of current signal. This current signal is transformed to dq component and compare with the reference value of SVM and sends the trip signal to disconnect the DG.
The MATLAB tool box is used to obtain the elements required for the simulation and the corresponding parameters are given. The simulation result under normal condition and fault condition is obtained and thereby the islanding condition is detected by measuring change in current and disconnect the DG.
V.CONCLUSION
REFERENCES
[1] A. Yafaoui, B. Wu, and S. Kouro(2012), “Improved active frequency drift anti-islanding detection method for grid connected photovoltaic systems,” IEEE Transactions on Power Electron., Vol. 27, no. 5, pp. 2367–2375.
[2] C.T. Hsieh, J. M. Lin, and S.-J. Huang, “Enhancement of islanding detection of distributed generation systems via wavelet transform-based approaches,” Int. J. Elect. Power Energy Syst , vol. 30, no. 10, pp. 575–580, 2008.
[3] C. Jeraputra and P. N. Enjeti, “Development of a robust anti-islanding algorithm for utility interconnection of distributed fuel cell powered generation,”IEEE Trans. Power Electron., vol. 19, no. 5, pp. 1163–1170, Sep. 2004.
[4] H. Shyh-Jiler and P. Fu-Sheng, “A new approach to islanding detection of dispersed generators with self commutated static power converters,”IEEE Trans. Power Del. , vol. 15, no. 2, pp. 500–507,Apr. 2000
[5] J. Zhang.(2013), “An improved islanding detection method for a gridconnected inverter with intermittent bilateral reactive power variation,” IEEE Transactions on Power Electron., Vol. 28, no. 1, pp. 268–278.
[6] K. Seethalekshmi,S. N. Singh, S. C. Srivastava(2012), “A Classification Approach Using Support Vector Machines to Prevent Distance Relay Maloperation Under Power Swing and Voltage Instability,” IEEE Transactions on Power Delivery., Vol. 27, no. 3, pp. 1124–1133. [7] L. A. C. Lopes and Y. Zhang, “Islanding detection assessment of multi-inverter systems with active frequency drifting methods,”IEEE
Trans. Power Del. , vol. 23, no. 1, pp. 480–486, Jan. 2008.
[8] S. Jang and K. Kim(2004), “An islanding detection method for distributed generations using voltage unbalance and total harmonic distortion in currents,” IEEE Transactions Power Delivery., Vol. 19, no. 2, pp. 745–752.’
[9] V. Menon and M. H. Nehrir(2007), “A hybrid islanding detection technique using voltage unbalance and frequency set point,” IEEE Transactions Power Systm., Vol. 22, no. 1, pp. 442–448.
[10] M.C.Wrinch, “Negative sequence impedance measurement for distributed generator islanding detection,” Ph.D. dissertation, Dept. Elect.Comput. Eng., Univ. British Columbia, Vancouver, BC, Canada, 2008.
[11] Y. Zhou, H. Li, and L. Liu(2013), “Integrated autonomous voltage regulation and islanding detection for high penetration PV applications,” IEEE Transactions on Power Electron., Vol. 28, no. 6, pp. 2826–2841.