Copyright to IJAREEIE 10.15662/ijareeie.2015.0404143 3773
Automation for Instrument Cluster Panel
Testing Using Machine Vision and NI-PXI
Hardware-In-the-Loop
Dr.B.Sharmila1, P.Venkadesan2
Professor, Dept. of EIE, Sri Ramakrishna Engineering College, Coimbatore, Tamilnadu, India1 PG Student, Dept. of CIE, Sri Ramakrishna Engineering College, Coimbatore, Tamilnadu, India2
ABSTRACT: This paper is proposed to develop automated instrument cluster panel testing and validation for shorten product development life cycle in automotive industry. The NI-PXI hardware-in-the- loop device combining with vision system is used for implementing closed loop automated Electronic Control Unit [ECU] testing. The LabVIEW NI-PXI system is simulating the real time hardwired and CAN signal for instrument cluster panel which is distributed by other ECUs in the vehicle network. The functionality result of concern test signal has been presented in the instrument cluster panel and the same signal has been captured by vision camera. The captured image is further processed by image processing algorithm for detecting the features such as detecting gauges, tell tale and text displays. Further, the closed loop result of each test case presents in the excel report for validation purpose using LabVIEW software. The test results were compared with ECU requirements specification for the purpose of flawless product delivery. The proposed system reduce the errors, time consumption and human intervention in ECU testing and validation.
KEYWORDS:ECU, Instrument cluster panel, Machine Vision, Hardware-in-the-loop.
I.INTRODUCTION
validation of instrument cluster panel with integration of vision system for closed loop automation. Much work has been implemented to solve the problem of manual testing and validation of instrument cluster panel using machine vision and hardware-in-the-loop [4][5][6][7][8].
This paper presents NI-PXI based HIL techniques with integration of machine vision system for automated functional testing of a vehicle instrument cluster which is distributed among other ECUs available in the vehicle network.
In the system, NI-PXI HIL set up is used to generate the real time hardwired and CAN simulated signal to the instrument cluster panel with the help of LabVIEW interactive application software. The machine vision system with image algorithm to read data present in the instrument cluster panel like speed, fuel level, telltale and text message for fully automated closed loop test process. Also the LabVIEW application software generates automatic excel test result report for validation purpose. The closed loop automated system provides low errors, time saving, and repeatable test and reduce the manpower requirement.
This paper is organized as follows; Section II presents the HIL system architecture which is describing the hardware block structure of closed loop product testing environment. Section III elaborates implementation of HIL simulator and Section IV presents the implementation of machine vision system for detecting gauges. Finally, the paper ends with conclusion in section V.
.
II.
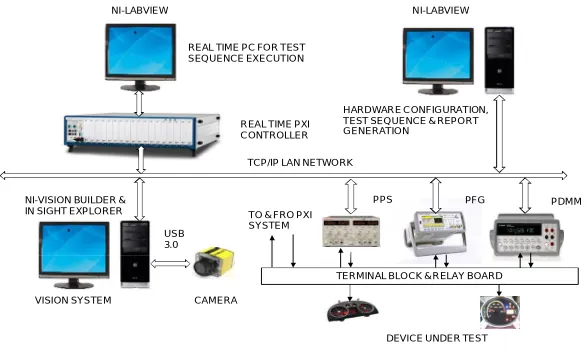
HIL SYSTEM ARCHITECTUREIt is vision based hardware in the loop ECU testing. The Fig.1.is Show the system architecture with hardware in loop test equipment with vision system.
TERMINAL BLOCK & RELAY BOARD TCP/IP LAN NETWORK
TO & FRO PXI SYSTEM
PPS PFG PDMM
REAL TIME PXI CONTROLLER REAL TIME PC FOR TEST SEQUENCE EXECUTION
HARDWARE CONFIGURATION, TEST SEQUENCE & REPORT GENERATION
NI-LABVIEW NI-LABVIEW
NI-VISION BUILDER & IN SIGHT EXPLORER
VISION SYSTEM
DEVICE UNDER TEST CAMERA
USB 3.0
Fig. 1 Architecture of NI-PXI HIL system
It consists of five vital elements including machine vision system, NI-PXI HIL tester, NI-LabVIEW system, device under test and communication interfaces.
Copyright to IJAREEIE 10.15662/ijareeie.2015.0404143 3775
module. The Agilent-33500 Series is a 30 MHz synthesized waveform generator with built-in arbitrary waveform and pulse capabilities. It is combination of bench-top and system features makes this waveform generator a versatile solution for ECU testing requirements. The Sorensen power supply is providing variable power supply to ECU for simulating with different input voltage. The sleep mode current and operating current of ECU are measured directly using the agilent digital multi meter. All the PXI system peripheral and HIL equipment are interfaced with the help NI-LabVIEW software.
Device under Test: DUT or ECU is an instrument cluster panel of AMW tractor consists of following major components, speed, Fuel, pressure gauge, telltale, warning indicator and LCD display.
NI-LabVIEW System: The LabVIEW system is used to configure HIL test equipment, test case execution for functionality and report generation for each variant of cluster.
Machine Vision System: The vision system consists of Cognex camera and sight-explorer software tool. The in-sight-explorer has many vision tool libraries like blob and edge tool which is used for image processing algorithm implementation in closed loop ECU testing.
Communication Interfaces: The TCP/IP protocol is used for communication between NI LabVIEW and vision system. Also the peripheral instruments are communicated through TCP/IP protocol with LabVIEW system.
III. HIL SIMULATOR IMPLEMENTATION
In the HIL simulator, the peripheral modules and system controller are communicated through PCI/PCI Express bus which is available in PXI chassis. The HIL equipment such as programmable power supply and function generator is used for simulate the ECU functionality in Real time. NI-CAN card generates the CAN message for device under test which has been distributed to other ECUs in the CAN network. The DMM is used for measuring the sleep mode current passed through ECU. The machine vision system is integrated with NI-PXI system to achieve the closed loop observation for complete automated ECU testing. The PXI controller and HIL equipment are communicated through TCP/IP and USB protocol. The ECUs are interfaced through terminal block and relay board. The two types of NI-LABVIEW application tool has been developed for real time test sequence execution, hardware configuration and report generation for each variant of device under test. The image processing algorithm has been developed using in-sight-explorer software tool.
IV.MACHINE VISION SYSTEM IMPLEMENTATION
NI-LABVIEW SYSTEM
CAMERA
CAPTURE IMAGE
DEVICE UNDER TEST
TCP/IP PROTOCOL
CAN SIGNAL I/O SIGNAL
Fig. 2 Automated vision system
SPEED GAUGE DETECTION
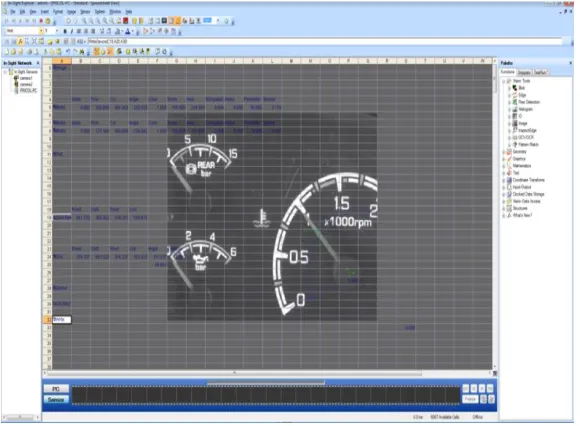
The observation process for the speed as indicated by the needle of the speedometer is discussed in this section. When the message for the test is received by the ECU and image of ECU is taken by the USB Camera continuously. In captured image, two annular of region is drawn with the ends of the region coinciding with the extremes of the speedometer and then the blobs of the needle is detected using blob detection function which is available in the In-Sight Explorer as shown in fig.3.
Fig. 3 Vision system implementation tool
Copyright to IJAREEIE 10.15662/ijareeie.2015.0404143 3777
Calibrate angle to the corresponding speed Draw annular ROI for finding Blob 2
Draw line between two founded Blobs
Draw zero reference line using edit line
Find line to line angle between two lines Start
Capture image in continuous mode
Draw annular ROI for finding Blob1
Stop
Fig. 4 Algorithm for speed gauge detection
FUEL LEVEL DETECTION
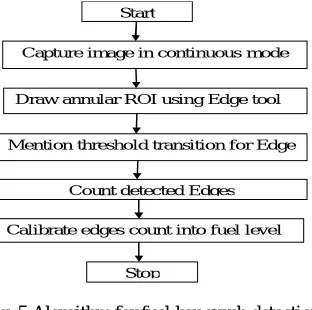
This test determines the fuel level status from the bar graph displayed in the fuel gauge. The “Find multi Line” edge tools are positioned to detect positions of 0%, 100% and actual fuel level. In machine vision terminology, an edge is defined as the boundary (a line, arc or circle) between two adjacent pixel groups with contrasting grayscale values.
Start
Capture image in continuous mode
Draw annular ROI using Edge tool
Mention threshold transition for Edge
Count detected Edges
Calibrate edges count into fuel level
Stop
Fig. 5 Algorithm for fuel bar graph detection
The In-Sight Edge Tools are used to detect and process statistics about the found edges. Count the total edges detected by edge detection algorithm and calibrate the edge count into fuel level. The speed gauge detection algorithm flowchart is shown in fig.5.
TELL TALE DETECTION
the algorithm to detect the difference between the telltale indicators, pattern matching is required. To run this test, a template of the indicator is loaded from the memory and learnt by the pattern max tool. The real-time input image of the cluster is then captured and loaded onto the In-Sight Explorer. The image is then scanned for the learnt pattern and an ROI is created around the pattern once it is detected. Initially, each standard symbol displayed in the cluster is trained using PatMaxTM tools and stored as master patterns. The image captured from the unit under test is compared with the trained patterns. The symbol is recognized based on the pattern matching score returned from the PatMaxTM tools.
TEXT MESSAGE DETECTION
The warning messages displayed in the message centre is in the need to be checked for their correctness. This test aims at recognizing and reporting these warning texts in the image processing library, OCR / OCV vision tools are designed to recognize a text string. However, this tool can only be used for identifying a text string with a known number of characters. In OCR/OCV, text fonts are trained before recognizing or verify the text. These trained fonts are stored in database with different instance. The ROI should be defined in the captured image area for recognizing and verification of text. The OCR/OCV is compared the ROI text with database fonts, once the text is match with database the found text has been sent to the API based on request.
V.CONCLUSION
Now a days, in automotive vehicle driving information system or instrument cluster panel has more functionality to assist the driver regarding safety concern. Because of this, instrument cluster panel becomes complex embedded control system. Testing these functionalities are required more test cases, but it is very tedious work to cover all the test cases by manually. The implemented NI-PXI system based automated product testing and validation which covered all the test cases in real time environment, therefore reduces the error and saves the time. The vision system read the instrument cluster panel result with good accuracy and real time manner. The NI-PXI system with integration of machine vision was proved efficiency of test and validation of automotive ECUs.
REFERENCES
[1] Yingping Huang and R. Peter Jones, “Design Validation Testing of Vehicle Instrument Cluster Using Machine Vision and
Hardware-in-the-loop”, in Proc.IEEE Conf on Vehicular Electronics and Safety,Sep 22-24, 2008.
[2] Amanjot Dhaliwal, Shreyas C. Nagaraj and Syed Ali “ Hardware-In-The-Loop Simulation For Hybrid Electric Vehicles – An Overview,
Lessons Learnt And Solutions Implemented”, SAE International, 2009.
[3] T. L. Narayana, S.Venkat Rao and K.Gnasen, “Automated Instrument Cluster Testing Using Image Processing” American Journal of
Intelligent Systems, Vol.3 (1) , pp.28-32, 2013.
[4] Thiago Martins and Alexander Wagner, “A Vision System for Electronic Control Unit Testing Using Hardware In the Loop”, 2011.
[5] Sebastian Osswald, Pratik Sheth, Manfred Tscheligi “Hardware-in-the-Loop-Based Evaluation Platform for Automotive Instrument
Cluster Development” EICS’13, June 24–27, 2013.
[6] A. Mouzakitis, D. Copp and R. Parker. “A hardware-in-the-loop system for testing automotive controller diagnostic software”.
Proceedings of the Sixteenth International Conference on Systems Engineering, (ICSE2003), Coventry, UK, vol. 2, pp. 589-594, 2003.
[7] I. R. Kendall and R. P. Jones, “An investigation into the use of hardware-in-the-loop simulation testing for automotive electronic control
systems”, Control Engineering Practice, vol. 7, pp. 1343-1356, 1999.
[8] A. Shafi, “Machine Vision in Automotive Manufacturing”, Sensor Review, vol. 24, no. 4, pp. 337-342, 2004.
[9] Lab VIEW CORE 1 Course Manual- October 2009 Edition- Part Number 325290A-01.