Scalable Distributed Service Integrity
Attestation for Software-as-a-Service Clouds
Abstract—Software-as-a-Service (SaaS) cloud systems enable application service providers to deliver their applications via massive cloud computing infrastructures. However, due to their sharing nature, SaaS clouds are vulnerable to malicious attacks. In this paper, we present IntTest, a scalable and effective service integrity attestation framework for SaaS clouds. IntTest provides a novel integrated attestation graph analysis scheme that can provide stronger attacker pinpointing power than previous schemes. Moreover, IntTest can automatically enhance result quality by replacing bad results produced by malicious attackers with good results produced by benign service providers. We have implemented a prototype of the IntTest system and tested it on a production cloud computing infrastructure using IBM System S stream processing applications. Our experimental results show that IntTest can achieve higher attacker pinpointing accuracy than existing approaches. IntTest does not require any special hardware or secure kernel support and imposes little performance impact to the application, which makes it practical for large- scale cloud systems.
Index Terms—Distributed Service Integrity Attestation, Cloud Computing, Secure Distributed Data Processing ✦
1 I
NTRODUCTIONCloud computing has emerged as a cost-effective re- source leasing paradigm, which obviates the need for users maintain complex physical computing infrastructures by themselves. Software-as-a-Service (SaaS) clouds (e.g, Amazon Web Service [1], Google AppEngine [2]) builds upon the concepts of Software as a Service (SaaS) [3] and Service Oriented Architecture (SOA) [4], [5], which enable application service providers (ASPs) to deliver their applications via the massive cloud computing infrastructure. In particular, our work focuses on data stream processing services [6]–[8] that are considered to be one class of killer applications for clouds with many real world applications in security surveillance, scientific computing, and business intelligence.
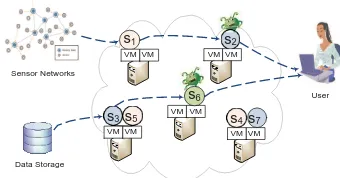
However, cloud computing infrastructures are often shared by ASPs from different security domains, which make them vulnerable to malicious attacks [9], [10]. For example, attackers can pretend to be legitimate service providers to provide fake service components and the service components provided by benign service providers may include security holes that can be exploited by at- tackers. Our work focuses on service integrity attacks that cause the user to receive untruthful data processing results, illustrated by Figure 1. Although confidentiality and pri- vacy protection problems have been extensively studied by previous research [11]–[16], the service integrity attestation
• Juan Du is with Amazon. Yongmin Tan is with MathWorks. The work was done when they were PhD students at the North Carolina State University. Daniel J. Dean, Xiaohui Gu, and Ting Yu are with Department of Computer Science, North Carolina State University. Their email addresses are [email protected], [email protected], [email protected], [email protected], [email protected]
Fig. 1. Service integrity attack in cloud-based data processing. Si denotes different service component
and V M denotes virtual machines.
problem has not been properly addressed. Moreover, service integrity is the most prevalent problem, which needs to be addressed no matter whether public or private data are processed by the cloud system.
Although previous work has provided various software integrity attestation solutions [9], [17]–[19], [19]–[23], those techniques often require special trusted hardware or secure kernel support, which makes them difficult to be de- ployed on large-scale cloud computing infrastructures. Tra- ditional Byzantine fault tolerance (BFT) techniques [24], [25] can detect arbitrary misbehaviors using full time majority voting over all replicas, which however incur high overhead to the cloud system. A detailed discussion of the related work can be found in section 5 of the online supplementary material.
In this paper, we present IntTest, a new integrated service integrity attestation framework for multi-tenant cloud systems. IntTest provides a practical service integrity attestation scheme that does not assume trusted entities on third-party service provisioning sites or require ap-
s1 VM VM
s2 VM VM Sensor Networks
s6 VM VM
User
s3 s5 VM VM
s4 s7 VM VM
Data Storage
1164 Mr. KANCHERLA BALAKRISHNA
2
plication modifications. IntTest builds upon our previous work RunTest [26] and AdapTest [27] but can provide stronger malicious attacker pinpointing power than RunTest and AdapTest. Specifically, both RunText and AdapTest as well as traditional majority voting schemes need to assume that benign service providers take majority in every service function. However, in large-scale multi-tenant cloud systems, multiple malicious attackers may launch colluding attacks on certain targeted service functions to invalidate the assumption. To address the challenge, IntTest takes a holistic approach by systematically examining both consistency and inconsistency relationships among different service providers within the entire cloud system. IntTest ex- amines both per-function consistency graphs and the global inconsistency graph. The per-function consistency graph analysis can limit the scope of damage caused by colluding attackers while the global inconsistency graph analysis can effectively expose those attackers that try to compromise many service functions. Hence, IntTest can still pinpoint malicious attackers even if they become majority for some service functions.
By taking an integrated approach, IntTest can not only pinpoint attackers more efficiently but also can suppress ag- gressive attackers and limit the scope of the damage caused by colluding attacks. Moreover, IntTest provides result auto-correction that can automatically replace corrupted data processing results produced by malicious attackers with good results produced by benign service providers.
Specifically, this paper makes the following contribu- tions:
• We provide a scalable and efficient distributed service integrity attestation framework for large-scale cloud computing infrastructures.
• We present a novel integrated service integrity at- testation scheme that can achieve higher pinpointing accuracy than previous techniques.
• We describe a result auto-correction technique that can automatically correct the corrupted results produced by malicious attackers.
• We conduct both analytical study and experimental evaluation to quantify the accuracy and overhead of the integrated service integrity attestation scheme. We have implemented a prototype of the IntTest system and tested it on NCSU’s virtual computing lab (VCL) [28], a production cloud computing infrastructure that operates in a similar way as the Amazon elastic compute cloud (EC2) [29]. The benchmark applications we use to evaluate IntTest are distributed data stream processing services pro- vided by the IBM System S stream processing platform [8], [30], an industry strength data stream processing system. Experimental results show that IntTest can achieve more accurate pinpointing than existing schemes (e.g. RunTest, AdapTest, full time majority voting) under strategically colluding attacks. IntTest is scalable, and can reduce the attestation overhead by more than one order of magni- tude compared to the traditional full time majority voting scheme.
The rest of the paper is organized as follows. Section 2
TABLE 1 Notations.
presents our system model. Section 3 presents the design details. Section 4 provides an analytical study about the IntTest system. Section 5 presents the experimental results. Section 6 sumarizes the limitations of our approach. Finally, the paper concludes in Section 7.
2 P
RELIMINARYIn this section, we first introduce the software-as-a- service (SaaS) cloud system model. We then describe our problem formulation including the service integrity attack model and our key assumptions. Table 1 summarizes all the notations used in this paper.
2.1 SaaS Cloud System Model
SaaS cloud builds upon the concepts of Software as a Service (SaaS) [3] and Service Oriented Architecture (SOA) [4], [5], which allows application service providers (ASPs) to deliver their applications via large-scale cloud computing infrastructures. For example, both Amazon Web Service (AWS) and Google AppEngine provide a set of application services supporting enterprise applications and big data processing. A distributed application service can be dynamically composed from individual service com- ponents provided by different ASPs (pi) [31], [32]. For example, a disaster assistance claim processing applica- tion [33] consists of voice-over-IP (VoIP) analysis com- ponent, email analysis component, community discovery component, clustering and join components. Our work focuses on data processing services [6], [8], [34], [35] which have become increasingly popular with applications in many real world usage domains such as business in- telligence, security surveillance, and scientific computing. Each service component, denoted by ci, provides a specific data processing function, denoted by fi, such as sorting, filtering, correlation, or data mining utilities. Each service component can have one or more input ports for receiving input data tuples, denoted by di, and one or more output ports to emit output tuples.
notation pi
fi
ci
di
Pu
r K CG
Np
tt′ p Ω
Mi
meaning
service provider service function service component application data tuple attestation probability number of copies for a tuple Max number of malicious service providers
minimum vertex cover of graph G the neighbor set of node p
the residual graph of G
the set of malicious service providers identified by the global inconsistency graph the set of malicious service providers identified
In a large-scale SaaS cloud, the same service function can be provided by different ASPs. Those functionally- equivalent service components exist because: i) service providers may create replicated service components for load balancing and fault tolerance purposes; and ii) popular
f
p1
portal p2
5. f(d ) == f(d ')?
1 1
services may attract different service providers for profit. p3
To support automatic service composition, we can deploy a set of portal nodes [31], [32] that serve as the gateway for the user to access the composed services in the SaaS cloud. The portal node can aggregate different service components into composite services based on the user’s requirements. For security protection, the portal node can perform authentication on users to prevent malicious users from disturbing normal service provisioning.
Different from other open distributed systems such as peer-to-peer networks and volunteer computing environ- ments, SaaS cloud systems possess a set of unique features. First, third-party ASPs typically do not want to reveal the internal implementation details of their software services for intellectual property protection. Thus, it is difficult to only rely on challenge-based attestation schemes [20], [36], [37] where the verifier is assumed to have certain knowledge about the software implementation or have access to the software source code. Second, both the cloud infrastructure provider and third-party service providers are autonomous entities. It is impractical to impose any special hardware or secure kernel support on individual service provisioning sites. Third, for privacy protection, only portal nodes have global information about which service functions are provided by which service providers in the SaaS cloud. Neither cloud users nor individual ASPs have the global knowledge about the SaaS cloud such as the number of ASPs and the identifiers of the ASPs offering a specific service function.
2.2 Problem Formulation
Given an SaaS cloud system, the goal of IntTest is to pinpoint any malicious service provider that offers an untruthful service function. IntTest treats all service com- ponents as black-boxes, which does not require any special hardware or secure kernel support on the cloud platform. We now describe our attack model and our key assumptions as follows.
Attack model. A malicious attacker can pretend to be
a legitimate service provider or take control of vulnerable service providers to provide untruthful service functions. Malicious attackers can be stealthy, which means they can misbehave on a selective subset of input data or service functions while pretending to be benign service providers on other input data or functions. The stealthy behavior makes detection more challenging due to the following reasons: 1) the detection scheme needs to be hidden from the attackers to prevent attackers from gaining knowledge on the set of data processing results that will be verified and therefore easily escaping detection; 2) the detection scheme needs to be scalable while being able to capture misbehavior that may be both unpredictable and occasional.
Fig. 2. Replay-based consistency check.
In a large-scale cloud system, we need to consider colluding attack scenarios where multiple malicious attack- ers collude or multiple service sites are simultaneously compromised and controlled by a single malicious attacker. Attackers could sporadically collude, which means an attacker can collude with an arbitrary subset of its colluders at any time. We assume that malicious nodes have no knowledge of other nodes except those they interact with directly. However, attackers can communicate with their colluders in an arbitrary way. Attackers can also change their attacking and colluding strategies arbitrarily.
Assumptions. We first assume that the total number of
malicious service components is less than the total number of benign ones in the entire cloud system. Without this assumption, it would be very hard, if not totally impossible, for any attack detection scheme to work when comparable ground truth processing results are not available. However, different from RunTest, AdapTest, or any previous majority voting schemes, IntTest does not assume benign service components have to be the majority for every service function, which will greatly enhance our pinpointing power and limit the scope of service functions that can be com- promised by malicious attackers.
Second, we assume that the data processing services are input-deterministic, that is, given the same input, a benign service component always produces the same or similar output (based on a user defined similarity function). Many data stream processing functions fall into this category [8]. We can also easily extend our attestation framework to sup- port stateful data processing services [38], which however is outside the scope of this paper.
Third, we also assume that the result inconsistency caused by hardware or software faults can be marked by fault detection schemes [39] and are excluded from our malicious attack detection.
3 D
ESIGN ANDA
LGORITHMSIn this section, we first present the basis of the IntTest system: probabilistic replay-based consistency check and the integrity attestation graph model. We then describe the integrated service integrity attestation scheme in detail. Next, we present the result auto-correction scheme.
3.1 Baseline Attestation Scheme
In order to detect service integrity attack and pin- point malicious service providers, our algorithm re- lies on replay-based consistency check to derive the
benign service provider
4
i
i
1
1 1
1 1
1 1
1 consistency/inconsistency relationships between service
providers. For example, Figure 2 shows the consistency
we say that pi and p′ are inconsistent. Otherwise, we say that pi and p′ are consistent with regard to function fi. check scheme for attesting three service providers p1, p2,
and p3 that offer the same service function f . The portal sends the original input data d1 to p1 and gets back the
For example, let us consider two different credit score service providers p1 and p′ . Suppose the distance function is defined as two credit score difference is no more than result f (d1). Next, the portal sends d′ , a duplicate of d1 to 10. If p1 outputs 500 and p′ outputs 505 for the same p3 and gets back the result f (d′ ). The portal then compares person, we say p1 and p′ are consistent. However, if f (d1) and f (d′ ) to see whether p1 and p3 are consistent.
The intuition behind our approach is that if two service
p1 outputs 500 and p′ outputs 550 for the same person, we would consider p1 and p′ to be inconsistent. We providers disagree with each other on the processing result
of the same input, at least one of them should be malicious. Note that we do not send an input data item and its duplicates (i.e., attestation data) concurrently. Instead, we replay the attestation data on different service providers after receiving the processing result of the original data. Thus, the malicious attackers cannot avoid the risk of being detected when they produce false results on the original data. Although the replay scheme may cause delay in a single tuple processing, we can overlap the attestation and normal processing of consecutive tuples in the data stream to hide the attestation delay from the user.
If two service providers always give consistent output re- sults on all input data, there exists consistency relationship between them. Otherwise, if they give different outputs on at least one input data, there is inconsistency relationship between them. We do not limit the consistency relationship to equality function since two benign service providers may produce similar but not exactly the same results. For example, the credit scores for the same person may vary by a small difference when obtained from different credit bureaus. We allow the user to define a distance function to quantify the biggest tolerable result difference.
Definition 1: For two output results, r1 and r2, which come
from two functionally equivalent service providers respec- tively, Result Consistency is defined as either r1 = r2, or the distance between r1 and r2 according to user-defined distance function D(r1, r2) falls within a threshold δ.
For scalability, we propose randomized probabilistic at- testation, an attestation technique that randomly replays a subset of input data for attestation. For composite dataflow processing services consisting of multiple service hops, each service hop is composed of a set of functionally equivalent service providers. Specifically, for an incom- ing tuple di, the portal may decide to perform integrity attestation with probability pu. If the portal decides to perform attestation on di, the portal first sends di to a pre- defined service path p1 → p2... → pl providing functions f1 → f2... → fl. After receiving the processing result for di, the portal replays the duplicate(s) of di on alternative service path(s) such as p′ → p′ ... → p′, where p′ provides
evaluate both intermediate and final data processing results between functionally equivalent service providers to derive the consistency/inconsistency relationships. For example, if data processing involves a sub-query to a database, we evaluate both the final data processing result along with the intermediate sub-query result. Note that although we do not attest all service providers at the same time, all service providers will be covered by the randomized probabilistic attestation over a period of time.
With replay-based consistency check, we can test func- tionally equivalent service providers and obtain their con- sistency and inconsistency relationships. We employ both the consistency graph and inconsistency graph to aggre- gate pair-wise attestation results for further analysis. The graphs reflect the consistency/inconsistency relationships across multiple service providers over a period of time. Before introducing the attestation graphs, we first define consistency links and inconsistency links.
Definition 2: A consistency link exists between two
service providers who always give consistent output for the same input data during attestation. An inconsistency link exists between two service providers who give at least one inconsistent output for the same input data during attestation.
We then construct consistency graphs for each function to capture consistency relationships among the service providers provisioning the same function. Figure 3(a) shows the consistency graphs for two functions. Note that two service providers that are consistent for one function are not necessarily consistent for another function. This is the reason why we confine consistency graphs within individual functions.
Definition 3: A per-function consistency graph is an undi-
rected graph, with all the attested service providers that provide the same service function as the vertices and consistency links as the edges.
We use a global inconsistency graph to capture incon- sistency relationships among all service providers. Two service providers are said to be inconsistent as long as
1 2 l j
the same function fj as pj . The portal may perform data replay on multiple service providers to perform concurrent attestation.
After receiving the attestation results, the portal com- pares each intermediate result between pairs of functionally equivalent service providers pi and p′ . If pi and p′ receive
they disagree in any function. Thus, we can derive more comprehensive inconsistency relationships by integrating inconsistency links across functions. Figure 3(b) shows an example of the global inconsistency graph. Note that service provider p5 provides both functions f1 and f2. In the inconsistency graph, there is a single node p5 with its
i i
the same input data but produce different output results, links reflecting inconsistency relationships in both functions
p
f1 f2
p
p p
p
p p
p1 p
p
p3 p2 p p
p p4
p p6
p5 Graph G
p7
Residual graph after removing p and it’s neighbors p , p , and p
benign service provider
malicious service provider
consistency link
(a)Per-function consistency graphs.
Fig. 3. Attestation graphs.
f1 and f2.
p8
benign service provider malicious service provider inconsistency link
(b)Global inconsistency
graph.
benign service provider malicious service provider
inconsistency link
Fig. 4. Inconsistency graph G and its residual graph.
However, strategically colluding attackers can try to take majority in a specific service function to escape the detection. Thus, it is insufficient to examine the per- function consistency graph only. We need to integrate the
Definition 4: The global inconsistency graph is an undi-
rected graph, with all the attested service providers in the system as the vertex set and inconsistency links as the edges.
The portal node is responsible for constructing and main- taining both per-function consistency graphs and the global inconsistency graph. In order to generate these graphs, the portal maintains counters for the number of consistency results and counters for the total number of attestation data between each pair of service providers. The portal updates the counters each time when it receives attestation results. At any time, if the counter for consistency results has the same value with that for the total attestation data, there is a consistency link between this pair of service providers. Otherwise, there is an inconsistency link between them.
3.2 Integrated Attestation Scheme
We now present our integrated attestation graph analysis algorithm.
Step 1: Consistency graph analysis. We first examine
per-function consistency graphs to pinpoint suspicious ser- vice providers. The consistency links in per-function consis- tency graphs can tell which set of service providers keep consistent with each other on a specific service function. Given any service function, since benign service providers always keep consistent with each other, benign service providers will form a clique in terms of consistency links. For example, in Figure 3(a), p1, p3 and p4 are benign ser- vice providers and they always form a consistency clique. In our previous work [26], we have developed a clique- based algorithm to pinpoint malicious service providers. If we assume that the number of benign service providers is larger than that of the malicious ones, a benign node will always stay in a clique formed by all benign nodes, which has size larger than ⌊k/2⌋, where k is the number of service providers provisioning the service function. Thus, we can pinpoint suspicious nodes by identifying nodes that are outside of all cliques of size larger than ⌊k/2⌋. For example, in Figure 3(a), p2 and p5 are identified as suspicious because they are excluded from the clique of size 3.
consistency graph analysis with the inconsistency graph analysis to achieve more robust integrity attestation.
Step 2: Inconsistency graph analysis. Given an incon-
sistency graph containing only the inconsistency links, there may exist different possible combinations of the benign node set and the malicious node set. However, if we assume that the total number of malicious service providers in the whole system is no more than K, we can pinpoint a subset of truly malicious service providers. Intuitively, given two service providers connected by an inconsistency link, we can say that at least one of them is malicious since any two benign service providers should always agree with each other. Thus, we can derive the lower bound about the number of malicious service providers by examining the minimum vertex cover of the inconsistency graph. The minimum vertex cover of a graph is a minimum set of vertices such that each edge of the graph is incident to at least one vertex in the set. For example, in Figure 3(b), p2 and p5 form the minimum vertex cover. We present two propositions as part of our approach. The proofs for these propositions can be found in section 1 of the online supplementary material.
Proposition 1: Given an inconsistency graph tt, let CG be a
minimum vertex cover of tt. Then the number of malicious service providers is no less than |CG|.
We now define the residual inconsistency graph for a node pi as follows.
Definition 5: The residual inconsistency graph of node pi
is the inconsistency graph after removing the node pi and all of links adjacent to pi.
For example, Figure 4 shows the residual inconsistency graph after removing the node p2. Based on the lower bound of the number of malicious service providers and Definition 5, we have the following proposition for pin- pointing a subset of malicious nodes.
Proposition 2: Given an integrated inconsistency graph tt
and the upper bound of the number of malicious service providers K, a node p must be a malicious service provider if and only if
|Np| + |CG′ | > K (1)
p1 p2
p3 p4 p5
p6
p5
p7 p8
6
p
s
f1
where |Np| is the neighbor size of p, and |CG′ | is the size of the minimum vertex cover of the residual inconsistency graph after removing p and its neighbors from tt.
For example, in Figure 3(b), suppose we know the number of malicious service providers is no more than 2. Let us examine the malicious node p2 first. After we remove
f2
p1
p2
p3 p8
p4
p5 p9
p6
p7
benign service provider p2 and its neighbors p1, p3, and p4 from the inconsistency malicious service provider benign service provider malicious service provider graph, the residual inconsistency graph will be a graph consistency link inconsistency link without any link. Thus, its minimum vertex cover is 0.
Since p2 has three neighbors, we have 3 + 0 > 2. Thus,
(a)Consistency graphs. (b)Inconsistency graph.
p2 is malicious. Let us now check out the benign node p1. After removing p1 and its two neighbors p2 and p5, the residual inconsistency graph will be a graph without any
Fig. 5. Isolated benign service providers in the global inconsistency graph.
link and its minimum vertex cover should be 0. Since p1 f1 has two neighbors, Equation 1 does not hold. We will not
pinpoint p1 as malicious in this step.
Note that benign service providers that do not serve same functions with malicious ones will be isolated nodes in the inconsistency graph, since they will not be involved in any inconsistency links. For example, in Figure 5, nodes p4, p5, p6 and p7 are isolated nodes since they are
f2
p1
p2
p3 p8
p4
p5 p9
p6
p7
consistency graphs inconsistency graph
not associated with any inconsistency links in the global inconsistency graph. Thus, we can remove these nodes from
benign service provider
malicious service provider
consistency link inconsistency link
the inconsistency graph without affecting the computation of the minimum vertex cover.
We now describe how to estimate the upper bound of the number of malicious service providers K. Let N denote the total number of service providers in the system. Since we assume that the total number of malicious service providers is less than that of benign ones, the number of malicious service providers should be no more than ⌊N/2⌋. According proposition 1, the number of malicious service providers should be no less than the size of the minimum vertex cover |CG| of the global inconsistency graph. Thus, K is first bounded by its lower bound |CG| and upper bound ⌊N/2⌋. We then use an iterative algorithm to tighten the bound of K. We start from the lower bound of K, and compute the set of malicious nodes, as described by Proposition 2, denoted by Ω. Then we gradually increase K by one each time. For each specific value of K, we can get a set of malicious nodes. With a larger K, the number of nodes that can satisfy |Ns|+|CG′ | > K becomes less, which causes the set Ω to be reduced. When Ω = ∅, we stop increasing K, since any larger K cannot give more malicious nodes. Intuitively, when K is large, fewer nodes may satisfy Equation 1. Thus, we may only identify a small subset of malicious nodes. In contrast, when K is small, more nodes may satisfy Equation 1, which may mistakenly pinpoint benign nodes as malicious. To avoid false positives, we want to pick a large enough K, which can pinpoint a set of true malicious service providers.
Step 3: Combining consistency and inconsistency
graph analysis results. Let tti be the consistency graph
generated for service function fi, and tt be the global inconsistency graph. Let Mi denote the list of suspicious nodes by analyzing per function consistency graph tti (i.e., nodes belonging to minority cliques), and Ω denotes the list of suspicious nodes by analyzing the global inconsistency
Fig. 6. An example for integrated graph analysis with two malicious nodes.
graph tt, given a particular upper bound of the number of malicious nodes K. We examine per-function consistency graphs one by one. Let Ωi denote the subset of Ω that serves function fi. If Ωi ∩ Mi ƒ= ∅, we add nodes in Mi to the identified malicious node set. The idea is that since
the majority of nodes serving function fi have successfully excluded malicious nodes in Ωi, we could trust their decision on proposing Mi as malicious nodes. Pseudo-code of our algorithm can be found in section 1 of the online supplemental material.
For example, Figure 6 shows both the per-function consistency graphs and the global inconsistency graph. If the upper bound of the malicious nodes K is set to 4, the inconsistency graph analysis will capture the malicious node p9 but will miss the malicious node p8. The reason is that p8 only has three neighbors and the minimum vertex cover for the residual inconsistency graph after removing p8 and its three neighbors is 1. Note that we will not pinpoint any benign node as malicious according to Proposition 2. For example, the benign node p1 has two neighbors and the minimum vertex cover for the residual graph after removing p1 and its two neighbors p8 and p9 will be 0 since the residual graph does not include any link. However, by checking the consistency graph of function f1, we find Ω1 = {p9} has overlap with the minority clique M1 = {p8, p9}. We then infer p8 should be malicious too. Note that even if we have an accurate estimation of the number of malicious nodes, the inconsistency graph analy- sis scheme may not identify all malicious nodes. However, our integrated algorithm can pinpoint more malicious nodes than the inconsistency graph only algorithm. An example
p1
p8
p p p9
2 3
p4 p5
p6 p7
p1
p8
p2 p3
p9
p4 p5
p9
f1 f2 f3
p1
p2
portal p3
p6
p7
p8
p11
p12
p13
p4 p9 p14
p5 p10 p15
Benign node Suspicious node
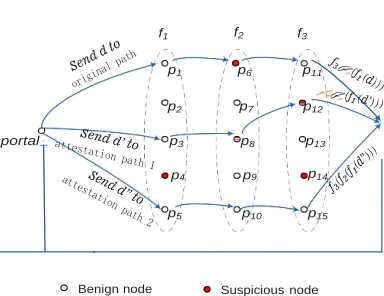
Fig. 7. Automatic data correction using attestation data processing results.
showing how our algorithm can pinpoint more malicious nodes than the inconsistency graph only algorithm can be found in section 1 of the online supplemental material.
3.3 Result Auto-Correction
IntTest can not only pinpoint malicious service providers but also automatically correct corrupted data processing results to improve the result quality of the cloud data processing service, illustrated by Figure 7. Without our attestation scheme, once an original data item is manip- ulated by any malicious node, the processing result of this data item can be corrupted, which will result in degraded result quality. IntTest leverages the attestation data and the malicious node pinpointing results to detect and correct compromised data processing results.
Specifically, after the portal node receives the result f (d) of the original data d, the portal node checks whether the data d has been processed by any malicious node that has been pinpointed by our algorithm. We label the result f (d) as “suspiciousresult” if d has been processed by any pinpointed malicious node. Next, the portal node checks whether d has been chosen for attestation. If d is selected for attestation, we check whether the attestation copy of d only traverses good nodes. If it is true, we will use the result of the attestation data to replace f (d). For example, in Figure 7, the original data d is processed by the pinpointed malicious node s6 while one of its attestation data d′′ is only processed by benign nodes. The portal node will use the attestation data result f (d′′) to replace the original result that can be corrupted if s6 cheated on d.
4 S
ECURITYA
NALYSISWe now present a summary of the results of our ana- lytical study about IntTest. Additional details along with a proof of the proposition presented in this section can be found in section 2 of the online supplemental material.
Proposition 3: Given an accurate upper bound of the
number of malicious service providers K, if malicious service providers always collude together, IntTest has zero false positive.
Although our algorithm cannot guarantee zero false posi- tives when there are multiple independent colluding groups, it will be difficult for attackers to escape our detection with multiple independent colluding groups since attackers will have inconsistency links not only with benign nodes but also with other groups of malicious nodes. Additionally, our approach limits the damage colluding attackers can cause if they can evade detection in two ways. First, our algorithm limits the number of functions which can be simultaneously attacked. Second, our approach ensures a single attacker cannot participate in compromising an unlimited number of service functions without being detected.
5 E
XPERIMENTALE
VALUATIONIn this section, we present the experimental evaluation of the IntTest system. We first describe our experimental setup. We then present and analyze the experimental results.
5.1 Experiment Setup
We have implemented a prototype of the IntTest system and tested it using the NCSU’s virtual computing lab (VCL) [28], a production cloud infrastructure operating in a similar way as Amazon EC2 [29]. We add portal nodes into VCL and deploy IBM System S stream processing middleware [8], [30] to provide distributed data stream processing service. System S is an industry-strength high performance stream processing platform that can analyze massive volumes of continuous data streams and scale to hundreds of processing elements (PEs) for each application. In our experiments, we used 10 VCL nodes which run 64bit CentOS 5.2. Each node runs multiple virtual machines (VMs) on top of Xen 3.0.3.
The dataflow processing application we use in our ex- periments is adapted from the sample applications provided by System S. This application takes stock information as input, performs windowed aggregation on the input stream according to the specified company name and then performs calculations on the stock data. We use a trusted portal node to accept the input stream, perform comprehensive integrity attestation on the PEs and analyze the attestation results. The portal node constructs one consistency graph for each service function and one global inconsistency graph across all service providers in the system.
8
A -IntTest
D
A -IntTestF
A -Majority Voting/RunTest
D
A -Majority Voting/RunTestF
A -IntTest
D
A -IntTest
F
A -Majority Voting/RunTest
D
A -Majority Voting/RunTest
F
1.6 1.4 1.2 1 0.8 0.6 0.4 0.2 0
IntTest FTMV
PTMV RunTest 1
0.8
0.6
0.4
0.2
0 1.6
1.4 1.2 1 0.8 0.6 0.4 0.2 0
10 20 30 40 50 60 70 80 90 100 Percentage of attacked service functions (%)
(a) Aggressive attackers
10 20 30 40 50 60 70 80 90 100 Percentage of attacked service functions (%)
(b) Conservative attackers
0 50 100 150 200 250 300 Time (ms)
Fig. 9. Detection rate timeline results.
Fig. 8. Malicious attackers pinpointing accuracy com- parison with 20% service providers being malicious.
providers that take participate in this service function. Note that AdapTest [27] uses the same attacker pinpointing algo- rithm as RunTest. Thus, AdapTest has the same detection accuracy as RunTest but with less attestation overhead.
Three major metrics for evaluating our scheme are de- tection rate, false alarm rate, and attestation overhead. We calculate the detection rate, denoted by AD, as the number of pinpointed malicious service providers over the total number of malicious service providers that have misbehaved at least once during the experiment. During runtime, the detection rate should start from zero and increase as more malicious service providers are detected. false alarm rate AF is defined as Nf p/(Nf p + Ntn), where Nfp denotes false alarms corresponding to the number of benign service providers that are incorrectly identified as malicious; Ntn denotes true negatives corresponding to the number of benign service providers that are correctly identified as benign. The attestation overhead is evaluated by both the number of duplicated data tuples that are redundantly processed for service integrity attestation and the extra dataflow processing time incurred by the integrity attestation.
We assume that the colluding attackers know our attes- tation scheme and take the best strategy while evaluating the IntTest system. According to the security analysis in Section 4, in order to escape detection, the best practice for attackers is to attack as a colluding group. Colluding attackers can take different strategies. They may conser- vatively attack by first attacking those service functions with less number of service providers where they can easily take majority, assuming they know the number of participating service providers for each service function. Alternatively, they may aggressively attack by attacking service functions randomly, assuming they do not know the number of participating service providers. We investigate the impact of these attack strategies on our scheme in terms of both detection rate and false alarm rate.
5.2 Results and Analysis
We first investigate the accuracy of our scheme in pin- pointing malicious service providers. Figure 8(a) compares our scheme with the other alternative schemes (i.e., FTMV, PTMV, RunTest) when malicious service providers aggres- sively attack different number of service functions. In this
set of experiments, we have 10 service functions and 30 service providers. The number of service providers in each service function randomly ranges in [1,8]. Each benign service provider provides two randomly selected service functions. The data rate of the input stream is 300 tuples per second. We set 20% of service providers as malicious. After the portal receives the processing result of a new data tuple, it randomly decides whether to perform data attestation. Each tuple has 0.2 probability of getting attested (i.e., attestation probability Pu = 0.2), and two attestation data replicas are used (i.e., number of total data copies including the original data r = 3). Each experiment is re- peated three times. We report the average detection rate and false alarm rate achieved by different schemes. Note that RunTest can achieve the same detection accuracy results as the majority voting based schemes after the randomized probabilistic attestation covers all attested service providers and discovers the majority clique [26]. In contrast, IntTest comprehensively examines both per-function consistency graphs and the global inconsistency graph to make the final pinpointing decision. We observe that IntTest can achieve much higher detection rate and lower false alarm rate than other alternatives. Moreover, IntTest can achieve better detection accuracy when malicious service providers attack more functions. We also observe that when malicious service providers attack aggressively, our scheme can detect them even though they attack a low percentage of service functions.
Figure 8(b) shows the malicious service provider de- tection accuracy results under the conservative attack sce- narios. All the other experiment parameters are kept the same as the previous experiments. The results show that IntTest can consistently achieve higher detection rate and lower false alarm rate than the other alternatives. In the conservative attack scenario, as shown by Figure 8(b), the false alarm rate of IntTest first increases when a small percentage of service functions are attacked and then drops to zero quickly with more service functions are attacked. This is because when attackers only attack a few service functions where they can take majority, they can hide themselves from our detection scheme while tricking our algorithm into labeling benign service providers as mali- cious. However, if they attack more service functions, they can be detected since they incur more inconsistency links with benign service providers in the global inconsistency graph. Note that majority voting based schemes can also detect malicious attackers if attackers fail to take majority
A
v
e
rage
a
cc
u
ra
c
y
A
v
e
rage
a
cc
u
ra
c
y
D
e
te
c
ti
on
R
a
without auto-correction with auto-correction, Pu=0.2 with auto-correction, Pu=0.4
without auto-correction with auto-correction, Pu=0.2 with auto-correction, Pu=0.4
R
a
ti
o
of
d
u
p
li
ca
te
d
tup
le
s
to
o
rig
in
a
l
tup
le
s
(%
)
1
0.8
0.6
0.4
0.2
0
0.2 0.4 0.6 0.8
Misbehaving probability
1
0.8
0.6
0.4
0.2
0
0.2 0.4 0.6 0.8
Misbehaving probability
correction scheme. We compare the result quality without auto-correction and with auto-correction, and also investi- gate the impact of the attestation probability. Figure 10(a) and Figure 10 show the result quality under non-colluding attacks with 20% malicious nodes and colluding attacks with 40% malicious nodes respectively. We vary the attes- tation probability from 0.2 to 0.4. In both scenarios, IntTest can achieve significant result quality improvement without
(a) 20% non-colluding attack- ers
(b) 40% colluding attackers
incurring any extra overhead other than the attestation over- head. IntTest can achieve higher result quality improvement
Fig. 10. Result quality detection and auto-correction
performance under non-colluding attacks. under higher node misbehaving probability. This is because IntTest can detect the malicious nodes earlier so that it can
correct more compromised data using the attestation data.
100
80
60
40
20
0
IntTest/RunTest (Pu=0.2, r=3)
400
PTMV (Pu=0.2) FTMV
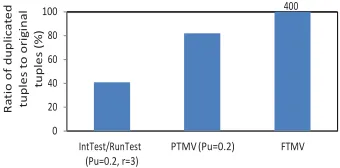
Figure 11 compares the overhead of the four schemes in terms of the percentage of attestation traffic compared to the original data traffic (i.e., the total number of duplicated data tuples used for attestation over the number of original data tuples). The data rate is 300 tuples per second. Each experiment run processes 20,000 data tuples. IntTest and RunTest save more than half attestation traffic than PTMV, and incur an order of magnitude less attestation overhead
Fig. 11. Attestation overhead comparison.
in the attacked service function. However, majority voting based schemes have high false alarms since attacks can always trick the schemes to label benign service providers as malicious as long as attackers can take majority in each individual service function.
The results of increasing the percentage of malicious service providers to 40% can be found in section 3 of the online supplemental material.
We now show one example of detection time comparison results during the above experiments, shown by Figure 9. In this case, malicious service providers use a small prob- ability (0.2) to misbehave on an incoming data tuple. For probabilistic attestation schemes such as IntTest, PTMV, and RunTest, the attestation probability is set at a small number (0.2) too. For IntTest and RunTest, two attestation data replicas are used (r = 3). Here, the attackers may attack different service functions with different subset of their colluders. As expected, the FTMV scheme needs the least time to detect malicious service providers because it attests all service components all the time. Although PTMV has the same attestation probability with IntTest and RunTest, it has shorter detection time since it uses all service components for each attestation data. IntTest can achieve shorter detection time than RunTest. Similar to previous experiments, IntTest achieves the highest detection rate among all algorithms. RunTest, FTMV and PTMV cannot achieve 100% detection rate since they cannot detect those attackers that only misbehave in service functions where they can take the majority.
We also conducted sensitivity study to evaluate the impact of various system parameters on the effectiveness of our algorithm. Those results can be found in Section 3 of the online supplementary material.
We now evaluate the effectiveness of our result auto-
than FTMV. Additional overhead analysis details are avail- able in section 3 of the online supplemental material.
6 L
IMITATIOND
ISCUSSIONAlthough we have shown that IntTest can achieve better scalability and higher detection accuracy than existing schemes, IntTest still has a set of limitations that require further study. A detailed limitation discussion can be found in Section 4 of the online supplementary material. We now provide a summary of the limitations of our approach. First, malicious attackers can still escape the detection if they only attack a few service functions, take majority in all the compromised service functions, and have less inconsistency links than benign service providers. However, IntTest can effectively limit the attack scope and make it difficult to attack popular service functions. Second, IntTest needs to assume the attested services are input deterministic where benign services will return the same or similar results defined by a distance function for the same input. Thus, IntTest cannot support those service functions whose results vary significantly based on some random numbers or time- stamps.
7 C
ONCLUSIONIn this paper, we have presented the design and imple- mentation of IntTest, a novel integrated service integrity attestation framework for multi-tenant software-as-a-service cloud systems. IntTest employs randomized replay-based consistency check to verify the integrity of distributed service components without imposing high overhead to the cloud infrastructure. IntTest performs integrated analysis over both consistency and inconsistency attestation graphs to pinpoint colluding attackers more efficiently than exist- ing techniques. Furthermore, IntTest provides result auto- correction to automatically correct compromised results to improve the result quality. We have implemented IntTest
R
es
u
lt
q
ua
li
ty
R
es
u
lt
q
ua
li
ty
10
and tested it on a commercial data stream processing platform running inside a production virtualized cloud computing infrastructure. Our experimental results show that IntTest can achieve higher pinpointing accuracy than existing alternative schemes. IntTest is light-weight, which imposes low performance impact to the data processing processing services running inside the cloud computing infrastructure.
A
CKNOWLEDGMENTSThis work was sponsored in part by U.S. Army Research Office (ARO) under grant W911NF-08-1-0105 managed by NCSU Secure Open Systems Initiative (SOSI), NSF CNS- 0915567, and NSF IIS-0430166. Any opinions expressed in this paper are those of the authors and do not necessarily reflect the views of the ARO, NSF or U.S. Government.
R
EFERENCES[1] “Amazon Web Services,” http://aws.amazon.com/. [2] “Google App Engine,” http://code.google.com/appengine/.
[3] “Software as a Service,” http://en.wikipedia.org/wiki/Software as a Service.
[4] G. A. amd F. Casati, H. Kuno, and V. Machiraju, “Web Services Concepts, Architectures and Applications Series: Data-Centric Sys- tems and Applications,” Addison-Wesley Professional, 2002. [5] T. Erl, “Service-Oriented Architecture (SOA): Concepts, Technology,
and Design,” Prentice Hall, 2005.
[6] T. S. Group, “STREAM: The Stanford Stream Data Manager,” IEEE Data Engineering Bulletin, 26(1):19-26, Mar. 2003.
[7] D. J. Abadi and et al, “The Design of the Borealis Stream Processing Engine,” Proc. of CIDR, 2005.
[8] B. Gedik, H. Andrade, and et. al., “SPADE: the System S Declarative Stream Processing Engine,” Proc. of SIGMOD, Apr. 2008. [9] S. Berger, R. Caceres, and et. al., “TVDc: Managing security in the
trusted virtual datacenter,” ACM SIGOPS Operating Systems Review, vol. 42, no. 1, pp. 40–47, 2008.
[10] T. Ristenpart, E. Tromer, H. Shacham, and S. Savage, “Hey, you, get off my cloud! exploring information leakage in third- party compute clouds,” in Proceedings of the 16th ACM Conference on Computer and Communications Security (CCS), 2009.
[11] W. Xu, V. N. Venkatakrishnan, R. Sekar, and I. V. Ramakrishnan, “A framework for building privacy-conscious composite web services,” in IEEE International Conference on Web Services, Chicago, IL, Sep. 2006, pp. 655–662.
[12] P. C. K. Hung, E. Ferrari, and B. Carminati, “Towards standardized web services privacy technologies,” in IEEE International Confer- ence on Web Services, San Diego, CA, Jun. 2004, pp. 174–183. [13] L. Alchaal, V. Roca, and M. Habert, “Managing and securing web
services with vpns,” in IEEE International Conference on Web Services, San Diego, CA, Jun. 2004, pp. 236–243.
[14] H. Zhang, M. Savoie, S. Campbell, S. Figuerola, G. von Bochmann, and B. S. Arnaud, “Service-oriented virtual private networks for grid applications,” in IEEE International Conference on Web Services, Salt Lake City, UT, Jul. 2007, pp. 944–951.
[15] M. Burnside and A. D. Keromytis, “F3ildcrypt: End-to-end protec- tion of sensitive information in web services,” in ISC, 2009, pp. 491–506.
[16] I. Roy, S. Setty, and et. al., “Airavat: Security and privacy for MapReduce,” in NSDI, April 2010.
[17] J. Garay and L. Huelsbergen, “Software integrity protection using timed executable agents,” in Proceedings of ACM Symposium on Information, Computer and Communications Security (ASIACCS), Taiwan, Mar. 2006.
[18] T. Garfinkel, B. Pfaff, and et. al., “Terra: A virtual machine-based platform for trusted computing,” in Proceedings of the 19th ACM Symposium on Operating Systems Principles (SOSP), Oct. 2003. [19] A. Seshadri, M. Luk, E. Shi, A. Perrig, L. van Doorn, and P. Khosla,
“Pioneer: Verifying code integrity and enforcing untampered code execution on legacy systems,” in Proceedings of the 20th ACM Symposium on Operating Systems Principles (SOSP), Oct. 2005.
[20] E. Shi, A. Perrig, and L. V. Doorn, “Bind: A fine-grained attestation service for secure distributed systems,” in Proceedings of the IEEE Symposium on Security and Privacy, 2005.
[21] “Trusted computing group,” Trusted Computing Group, https://www.trustedcomputinggroup.org/home.
[22] “TPM Specifications Version 1.2,” TPM, https://www.trustedcomputinggroup.org/downloads/specifications/tpm/tpm. [23] J. L. Griffin, T. Jaeger, R. Perez, and R. Sailer, “Trusted virtual
domains: Toward secure distributed services,” in Proceedings of First Workshop on Hot Topics in System Dependability, Jun. 2005. [24] L. Lamport, R. Shostak, and M. Pease, “The byzantine generals prob-
lem,” ACM Transactions on Programming Languages and Systems, 4(3), 1982.
[25] T. Ho, B. Leong, R. Koetter, and et. al., “Byzantine modification detection in multicast networks using randomized network coding,” in IEEE ISIT, 2004.
[26] J. Du, W. Wei, X. Gu, and T. Yu, “Runtest: Assuring integrity of dataflow processing in cloud computing infrastructures,” in ACM Symposium on Information, Computer and Communications Security (ASIACCS), 2010.
[27] J. Du, N. Shah, and X. Gu, “Adaptive data-driven service integrity at- testation for multi-tenant cloud systems,” in International Workshop on Quality of Service (IWQoS), San Jose, CA, 2011.
[28] “Virtual Computing Lab,” http://vcl.ncsu.edu/.
[29] “Amazon Elastic Compute Cloud,” http://aws.amazon.com/ec2/. [30] N. Jain and et al., “Design, Implementation, and Evaluation of the
Linear Road Benchmark on the Stream Processing Core,” Proc. of SIGMOD, 2006.
[31] B. Raman, S. Agarwal, and et. al., “The SAHARA Model for Service Composition Across Multiple Providers,” Proceedings of the First International Conference on Pervasive Computing, August 2002. [32] X. Gu, K. Nahrstedt, and et. al., “ QoS-Assured Service Composition
in Managed Service Overlay Networks,” Proc. of ICDCS, 194-202, 2003.
[33] K.-L.Wu, P. S. Yu, B. Gedik, K. Hildrum, C. C. Aggarwal, E. Bouil- let, W. Fan, D. George, X. Gu, G. Luo, and H. Wang, “Challenges and Experience in Prototyping a Multi-Modal Stream Analytic and Monitoring Application on System S,” Proc. of VLDB, 1185-1196, 2007.
[34] J. Dean and S. Ghemawat, “MapReduce: Simplified Data Processing on Large Clusters,” Proc. of USENIX Symposium on Operating System Design and Implementation, 2004.
[35] M. Isard, M. Budiu, Y. Yu, A. Birrell, and D. Fetterly, “Dryad: Distributed data-parallel programs from sequential building blocks,”
Proc. of European Conference on Computer Systems (EuroSys), Lisbon, Portugal, 2007.
[36] A. Seshadri, A. Perrig, L. V. Doorn, and P. Khosla, “Swatt: Software- based attestation for embedded devices,” in IEEE Symposium on Security and Privacy, May 2004.
[37] A. Haeberlen, P. Kuznetsov, and P. Druschel, “Peerreview: Practical accountability for distributed systems,” in ACM Symposium on Operating Systems Principles, 2007.
[38] J. Du, X. Gu, and T. Yu, “On verifying stateful dataflow processing services in large-scale cloud systems,” in ACM Conference on Computer and Communications Security (CCS), Chicago, IL, 2010, pp. 672–674.
[39] I. Hwang, “A survey of fault detection, isolation, and reconfiguration methods,” IEEE Transactions on Control System Technology, 2010.
Student Details:
Mr. DARSI RAJESH was born in India.He pursuing M.Tech
degree in Computer Science Department in Sri Mittapalli
College of Engineering ,Guntur, Andhra Pradesh State ,India.
mail id: [email protected]
Guide Details:
Mr. KANCHERLA BALAKRISHNA was born in India. MBA.,
M.Tech., Assistant Professor, Department of Computer Science & Engineering,Sri Mittapalli College of Engineering, Tummalapalem, Guntur, AP.