MAIZE YIELD AND SOIL PROPERTIES IN HUYE AND BUGESERA DISTRICTS OF RWANDA
INNOCENT MUNYABARENZI A148EA/22328/2011
A THESIS SUBMITTED IN PARTIAL FULFILLMENT OF THE REQUIREMENTS FOR THE AWARD OF THE DEGREE OF MASTER OF
SCIENCE IN INTEGRATED SOIL FERTILITY MANAGEMENT AT KENYATTA UNIVERSITY
DECLARATION
I hereby declare that this thesis is an original work and has not been submitted for a degree in any other university.
Signature……… Date ……….. Innocent Munyabarenzi
Department of Agricultural Resource Management Kenyatta University, Kenya
This thesis has been submitted for examination with our approval as university supervisors.
Signature……… Date ………... Prof. Benson Mochoge
Department of Agricultural Resource Management Kenyatta University, Kenya
Signature……… Date ……….. Dr. Nabahungu N. Léon
Senior Principal Research Fellow
DEDICATION
To God almighty and Jesus Christ his only begotten son, for nothing is impossible with God and to my dearest wife Claudine and our wonderful children Pacifique, Grace,
ACKNOWLEDGEMENT
I am especially grateful to Prof. Benson Mochoge of the Department of Agricultural Resource Management, my supervisor, who patiently and diligently offered advice and
suggestions on the work. You were always there for me. May God through His son Jesus Christ give you His grace and peace!
I am particularly indebted to Dr. Léon Nabahungu of Rwanda Agriculture Board (RAB), my external supervisor for his input and most importantly his willingness to assist me each time I went to him. God bless you.
My appreciation goes to Rwanda Agricultural Board (RAB) for the input and most importantly willingness to assist me.
I acknowledge with special thanks the assistance in technical support and advice received from all laboratory staff of Rwanda Agricultural Board (RAB) especially Mr. Eustache Nkikabahizi, and all Microbiology laboratory staff of Kenyatta University especially Mr.
Ng‟ang‟a.
Last but not the least my appreciation goes to AGRA Project and The Department of
Agriculture Resource Management of Kenyatta University for their financial support without which it would have been impossible for me to undertake this project. You have put a smile on my face.
TABLE OF CONTENTS
DECLARATION ... ii
DEDICATION ... iii
ACKNOWLEDGEMENT ... iv
TABLE OF CONTENTS ... v
LIST OF TABLES ... viii
LIST OF FIGURES ... ix
ABREVIATIONS AND ACRONYMS ... x
ABSTRACT ... xii
CHAPTER ONE ... 1
1.0 INTRODUCTION ... 1
1.1 Background ... 1
1.2 Statement of the Problem ... 2
1.3 Objectives ... 3
1.3.1 Overall Objective: ... 3
1.3.2 Specific Objectives: ... 3
1.4 Research Hypotheses ... 4
1.5 Significance of the study ... 4
1.6 Conceptual Framework ... 5
CHAPTER TWO ... 6
2.0 LITERATURE REVIEW ... 6
2.1 Introduction ... 6
2.2 Soil Nutrient Depletion ... 7
2.3 Soil Nutrient Replenishment ... 7
2.4 Use of Organic Manures ... 9
2.5 Use of Mineral Fertilizers on Crop Production ... 11
2.6 Importance of Combined Organic and Mineral Fertilizers ... 12
2.7 Crop Nutrient Uptake and Nutrient use Efficiency ... 14
2.7.1 Crop Nutrient Uptake ... 14
2.7.2 Nutrient Use Efficiency ... 16
2.8 Maize Response to N and P Fertilizers ... 18
2.10 Environmental Factors Affecting Maize Production ... 20
CHAPTER THREE ... 22
3.0 MATERIALS AND METHODS ... 22
3.1.0 Description of the Study Areas ... 22
3.1.1 Rubona Station ... 22
3.1.2 Karama Station ... 22
3.2. Initial soil Fertility Status ... 23
3.3. Characterization of Manure Used in the Experiments ... 25
3.4. Rainfall pattern during season A 2013 at Rubona and Karama stations ... 25
3.5. Experimental Design and Treatments Layout ... 26
3.6. Planting and Fertilization ... 27
3.7. Yield Measurements ... 28
3.8. Soil Sampling and Analysis ... 28
3.8.1. Soil pH ... 29
3.8.2. Total Nitrogen and Carbon in Soil ... 29
3.8.3. Determination of Soil Available Nitrogen (NH4 + +NO3 -) ... 30
3.8.4. Determination of Available P in Soil ... 31
3.8.5. Determination of Magnesium in the Soil ... 32
3.8.6. Determination of Ca, K and Na in Soil ... 33
3.8.7. Determination of Exchangeable Acidity in Soil ... 33
3.8.8. Effective Cation Exchange Capacity (ECEC) ... 34
3.8.9. Soil Texture Size Determination ... 34
3.8.10. Bulk Density ... 35
3.8.11. Determination of Microbial Population in Soil ... 36
3.9. Plant Analyses... 37
3.9.1. Plant Sampling and Preparation ... 37
3.9.2. Analysis of Total N ... 37
3.9.3. Determination of Phosphorus ... 37
3.10. Nitrogen and Phosphorus Uptake ... 38
3.11. Determination of Nutrient Use Efficiency ... 38
3.12. Statistical Analysis ... 39
CHAPTER FOUR... 40
4.1 Grain Yield and Yield Components ... 40
4.1.1 Effect of Treatments on Maize Grain Yield at Rubona and Karama ... 40
4.1.1.1 An Overview of Effects of Various Treatments and their Interactions on Maize Grain Yield and Maize Yield Components ... 40
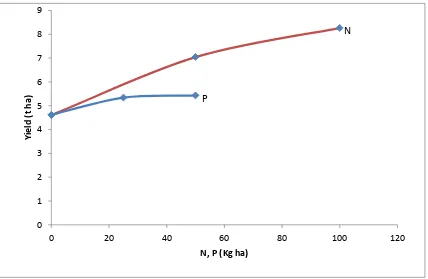
4.1.1.2 Maize Grain Yield Response to N and P Fertilizers ... 44
4.1.1.3 Effect of Manure on Maize Grain Yield ... 46
4.1.1.4 Comparison of Yields Performance at Rubona and Karama ... 47
4.1.1.5 Relationships of Maize Yield Components, N Uptake and Maize Grain ... 48
4.2. Effect of FYM and Mineral Fertilizers on Nutrient Uptake by Maize Crop. ... 53
4.2.1 The N and P Contents in Maize Grain and Stover ... 53
4.2.2 Effect of FYM Manure and Mineral Fertilizers on Nutrient Use Efficiency of Crop .. 57
4.3. Effect of Farmyard Manure and Mineral Fertilizers on Bio-Chemical Soil Properties ... 58
4.3.1 Effect of Treatments on Soil pH ... 58
4.3.2 Effect of Treatments on Soil Organic Carbon ... 60
4.3.3 Effect of Treatments on Soil Total N ... 60
4.3.4 Effect of Treatments on Soil Available P ... 61
4.3.5 Effect of Treatments on Available Soil N (NO3 & NH4 + ) ... 62
4.3.6 Effect of Treatments on Cation Exchange Capacity (CEC) ... 64
4.3.7 Effect of Treatments on Exchangeable K, Ca and Mg ... 65
4.3.8 Effect of Treatments on Effective Cation Exchange Capacity (ECEC) ... 66
4.3.9 Changes in Soil Biological Properties under Different Fertilizers... 68
CHAPTER FIVE ... 71
5.0 CONCLUSION AND RECOMMENDATIONS ... 71
5.1 Conclusion ... 71
5.2 Recommendations ... 72
REFERENCES... 73
APPENDICES ... 86
APPENDIX 1: TREATMENTS AND THEIR RANDOMIZATION ... 86
APPENDIX 2: SOIL TEXTURAL TRIANGLE ... 87
LIST OF TABLES
Table 1: The initial physical and bio-chemical characteristics of the soil at Rubona and
Karama sites………...24
Table 2: Some chemical composition of the manure used in the experiments…………..26
Table 3: Rainfall pattern at Rubona and Karama during the growing season…………...26
Table 4: The experimental treatments and their design……….27
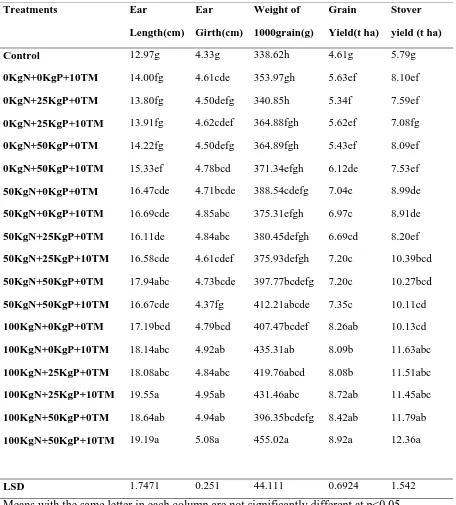
Table 5: Effect of FYM and mineral fertilizers on the grain yield and yield components of maize (Rubona site)………..……….41
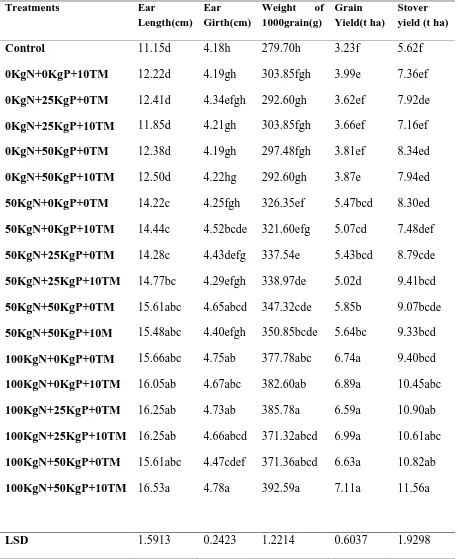
Table 6: Effect of FYM and mineral fertilizers on the grain yield and yield components of maize (Karama site………...….42
Table 7: N and P content (%) in maize grain and stover………...54
Table 8: Effect of FYM and mineral fertilizers on N and P uptake in maize grain and stover ( Kg/ha)………...56
Table 9: Agronomic Nutrient Use Efficiency of maize at Rubona and Karama (kg grain/ kg of fertilizer applied)………..58
Table 10: Effect of FYM and mineral fertilizers on soil pH at Rubona………....59
Table 11: Effect of FYM and mineral fertilizers on soil pH at Karama ………..….59
Table 12: Effect of FYM and mineral fertilizers on soil Organic C (%)………...60
Table 13: Effect of FYM and mineral fertilizers on soil total N (%)………...….61
Table 14: Effect of FYM and mineral fertilizers on soil Available P (mgkg-1)…….…..62
Table 15: Effect of FYM and mineral fertilizers on soil NH4+(mg/kg-1) ………..63
Table 16: Effect of FYM and mineral fertilizers on soil NO3- (mg/kg-1)………..64
Table 17: Effect of FYM and mineral fertilizers in soil CEC(cmolkg-1)………..65
Table 18: Changes on soil Exchangeable K (cmolkg-1) under different fertilizers……...65
Table 19: Changes on soil Exchangeable Ca(cmolkg-1) under different fertilizers……...66
Table 20: Changes on soil Exchangeable Mg (cmolkg-1) under different fertilizers…….66
Table 21: Changes in Soil ECEC (cmolkg-1) under different fertilizers………....67
LIST OF FIGURES
Figure 1: Conceptual framework……….…5
Figure 2: Map of Rwanda……….23
Figure 3: Maize grain yield response to N and P ( Karama Site)………...45
Figure 4: Maize grain yield response to N and P ( Rubona Site)………...45
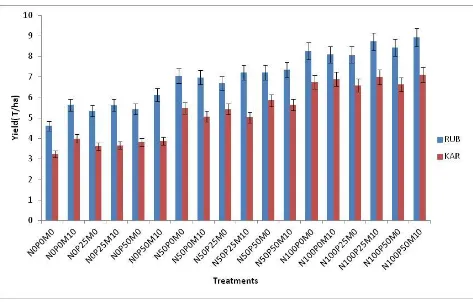
Figure 5: Comparison of yields in Rubona (RUB) and Karama (KAR)………...47
Figure 6: Relationship between 1000 seed weight and maize grain yield at Rubona site………..49
Figure 7: Relationship between 1000 seed weight and maize grain yield at Karama site………..49
Figure 8: Relationship between ear length and maize grain yield at Rubona site………..50
Figure 9: Relationship between ear length and maize grain yield at Karama site……….50
Figure 10: Relationship between ear girth and maize grain yield at Rubona site…………..…...51
Figure 21: Relationship between ear girth and maize grain yield at Karama site………..51
Figure 32: Relationship between stover yield and maize grain yield at Rubona site……….52
Figure 43: Relationship between stover yield and maize grain yield at Karama site……….52
Figure 54: Relationship between grain N uptake and Maize grain yield (Rubona site)………….53
ABREVIATIONS AND ACRONYMS BNF : Biological Nitrogen Fixation
Cfu : Colony forming units
CIP : Crop Intensification Program
ECEC : Effective Cation Exchange Capacity
FAO : Food and Agriculture Organization of the United Nations FYM : Farmyard manure
GDP : Gross Domestic Product
IFDC : International Fertilizer Development Center IFIA : International Fertilizer Industry Association ISAR : Rwanda Agriculture Research Institute ISFM : Integrated Soil Fertility management Kg/ha : Kilograms per hectare
Km2 : Square kilometer
LSD : Least Significant Difference
MINAGRI : Ministry of Agriculture and Animal Resources MINALOC : Ministry of Local Government
MINECOFIN : Ministry of Finance and Economic Planning MSV : Maize Streak Viruses
RAB : Rwanda Agriculture Board
SAS : Statistical Analysis System
SSA : Sub-Sahara Africa
TLB : Turcicum Leaf Blight
TSP : Triple Super Phosphate
ABSTRACT
CHAPTER ONE 1.0 INTRODUCTION
1.1 Background
Rwanda is a landlocked country with a total area of 26,333km2. According to the estimates of 2002 Census, Rwanda‟s population is 10 million and is projected to increase
to 15 million by the year 2020. With 310 inhabitants per km2, Rwanda is among the countries of Africa with the highest population density and the majority live in rural
areas. The Rwanda‟s climate is conditioned by landscape in such a way that the further to the west, the lower the altitude, the warmer the temperature and the lesser the precipitation with annual rainfall ranging between 900 and 1,600 mm (MINAGRI, 2004).
Agriculture represents one-third of Rwanda‟s gross domestic product and employs 80 percent of its workforce (MINECOFIN,2002). Rwandan agriculture is today
characterized by low agricultural productivity due to progressive soil fertility decline over the years. Increased use of both organic and inorganic fertilizer and other agro– inputs is necessary to help boost food security in Rwanda. However, the use of fertilizers
to increase crop yields is at an early stage of development. Although the current use of fertilizers in the country (12 kg/ha/year) (MINAGRI 2009), is slightly above the average
for the Sub-Saharan African (9kg/ha/year), it is far below the target of the Abuja Fertilizer Declaration of 50 kg/ha/year by 2015 (Sanginga and Woomer, 2009).
Maize (Zea mays L.) crop is the most important cereal and a widely distributed in
MINAGRI (2009). Almost all agro-climatic zones of the country have great suitability in the production of maize (NISR, 2012).
Grown by 62% of farm households for various purposes (direct human consumption, for sale on the local market, or dried and stored for a stock of foodsecurity), maize plays an
important role in the socio-economic life of rural households (Terpend et al., 2007).
According to FAO (2010), maize presents the highest average grain yield (around 4.5 t/ha) as
compared with major cereals grown in Rwanda such as wheat (2.1 t/ha) and rice (3t/ha).
However, the constraints to the development of this crop are many, which include soil fertility
decline, lack of agricultural credit, access to good quality seeds, late onset of rains for planting
and water control for producers (Terpend et al., 2007 and MINAGRI, 2011).
Nevertheless, the Government of Rwanda and partners in development are putting more efforts towards the development of the maize program. In that context, maize is among
the selected crops in Crop Intensification Program (CIP), which is more profitable in terms of inputs access and value addition by smallholder farmers. The aim of the present study was to determine the effects of farmyard manure and mineral fertilizers application
on maize yield as well as on some selected soil properties.
1.2 Statement of the Problem
Declining land productivity in Rwanda as a result of soil fertility reduction is a major problem facing smallholder farmers today. This decline primarily results from a
continuous cultivation without adequate addition of external nutrient inputs (MINAGRI, 2004). Improved fertility management through combining organic and mineral fertilizers
The prevailing fertilizers recommendations are blanket application which did not consider the Integrated Soil Fertility Management ( ISFM) practices such as inclusion of
organic sources for example farmyard manure, cereal – legume rotation , intercropping, use of improved seeds, timely planting and weeding (IFDC, 2009).
Maize production offers many advantages. It is a product that contributes to food security (eaten
fresh and dry) and it can be cultivated for income generation. However, at farm level yields are
often very low because of poor nutrient use efficiency as a result of poor management of soil resources (organic and inorganic fertilizer inputs) (MINAGRI, 2004). Hence the need
for the current study which incorporates some ISFM practices.
1.3 Objectives
1.3.1 Overall Objective:
The overall objective of this study was to increase food security through maize production and to improve soil productivity through use of organic and inorganic
fertilizers.
1.3.2 Specific Objectives:
The specific objectives of the study were:
1. To determine the maize yield response to mineral and organic fertilizers application. 2. To determine the effect of organic and inorganic fertilizers on nutrient uptake and
nutrient use efficiency by maize.
1.4 Research Hypotheses
The research hypotheses of the study postulated that:
1. There is positive response of maize grain yield to mineral and organic fertilizers
application.
2. Application of mineral and organic fertilizers increase maize nutrient uptake and nutrient use efficiency.
3. Use of mineral and organic fertilizers affects soil bio-chemical properties.
1.5 Significance of the study
Nutrient deficiencies, mainly nitrogen (N) and phosphorous (P) are the most limiting soil
fertility constraints to maize yields in Rwanda. By complementing cattle manure and mineral fertilizers (ISFM practice), soil productivity and smallholder farmers‟ livelihoods could be improved and result to increased incomes from higher maize yields production.
Cattle manure is best provided by zero grazing approach which is currently being promoted in the whole country (MINAGRI, 2011).
The vision of Rwanda is to increase production of various food crops where maize crop has been identified as one of the crops that could contribute on this vision. In that context, maize is being among selected crops in Crop Intensification Program (CIP), which is
more profitable in terms of accessing inputs and value addition to small land holdings (MINAGRI 2011).
1.6 Conceptual Framework
Low fertility of soils under study is manifested in chemical and biological properties,
which in turn result in low yields. By adding cattle manure combined with inorganic fertilizer (N, P) and proper timing of planting, it is expected that soil physical, chemical and biological properties will be improved and consequently increase maize grain yields.
Figure 1 shows the steps to be taken to improve soil productivity and the outcomes expected.
PROBLEM
INTERVENTIONS
MEASUREMENTS
RESULTS
Figure 1: Conceptual framework Soil chemical
properties
Soil biological properties
Improved soil chemical and biological properties
Increased maize yield
Increased food security
Higher awareness by farmers on the ISFM practices mainly organic
+ inorganic fertilizers application Low soil fertility
Chemical properties
Biological properties
Low yields of maize
Cattle manure Inorganic fertilizer (NP)
CHAPTER TWO 2.0 LITERATURE REVIEW
2.1 Introduction
Everywhere in the world people settle first in areas with high potential fertile soils,
adequate rainfall and mild temperatures. As populations grow, soil nutrient capital is gradually depleted when farmers are unable to sufficiently compensate losses by
returning nutrients to the soil via crop residues, manures and mineral fertilizers. Increasing pressures on agriculture, result in much higher nutrient outflows and the subsequent breakdown of many traditional soil fertility maintenance strategies. These
traditional fertility maintenance strategies such as fallowing, intercropping cereals with legume crops, manure production in mixed crop-livestock farming and opening new
lands have not been replaced by an effective fertilizer supply (Sanders et al., 1996).
The bulk of food in Africa is produced on smallholder farms (Cleaver and Schreiber,
1994; Gladwin et al., 1997), where rapid depletion of nutrients is highest and the major problem affecting food production in Africa (Badiane and Delgado, 1995). This is because the smallholder farmer is poorly resourced and unable to invest in soil fertility
inputs, particularly mineral fertilizers. This is not surprising since about half of Africa's population is classified as “absolute poor” subsisting on per capita incomes of less than 1
US$ per day (Badiane and Delgado, 1995).
The situation is critical especially when the poor farmer has to bear the full cost of production owing to the removal of subsidies on mineral fertilizers. The major effect of
In order to sustain soil and crop productivity, it is necessary to explore alternative soil fertility replenishment strategies, which are effective and affordable to farmers, especially
the smallholder farmer.
2.2 Soil Nutrient Depletion
The magnitude of nutrient depletion in Africa‟s agricultural land is enormous. Stoorvogel
and Smaling (1990), indicated that, an average of 660 kg N ha-1, 75 kg P ha and 450 kg K ha-1 have been lost during the last 30 years from about 200 million hectares of cultivated lands in 37 countries of Sub-Saharan Africa, excluding South Africa. This is equivalent
to 1.4 t of urea ha-1, 375 kg of triple superphosphate (TSP) ha-1 or 0.9 t of phosphate rock (PR) ha-1 and 896 kg of potassium chloride (KCl) ha-1 during the said period. These figures represent the balance between nutrient inputs (in fertilizers, manure, atmospheric
deposition, biological nitrogen fixation (BNF) and sedimentation) and nutrient outputs (in harvested products, crop residue removals, leaching, gaseous losses, surface runoff and
erosion (Stoorvogel and Smaling, 1990).
Food production has therefore depended on nutrient mining approach since very small amounts of nutrients are returned through fertilizer application (Ofori and Fianu, 1996).
The use of crop residues as sources of nutrients and soil organic matter amendment has long been a major component of many farming systems in Africa.
2.3 Soil Nutrient Replenishment
halting soil fertility decline. This may be accomplished through the application of mineral and organic fertilizers.
Nitrogen inputs at the field scale mainly come from inorganic fertilizers, biological
nitrogen fixation (BNF), biomass transfers, animal manures or composts produced outside the field and nitrate capture from subsoil depths beyond the reach of crop roots.
The main issue in replenishment is not the size of the capital N stocks, but the cycling rate (Giller et al., 1997). Therefore, appropriate strategies are those that will provide sufficient levels of N inputs while at the same time slowly rebuilding stocks.
Replenishing N stocks by these strategies would require very large inputs of organic N. For example, an increase in soil organic N concentration in the topsoil from 0.1 to 0.3 %
is equivalent to an application of about 320 t ha-1 of dry biomass. Such large applications are clearly impractical, so in the short to medium term, increased soil N supply will
depend on regular inputs of organic N sources (Sanchez, 1997). Given the largely biological nature of N cycle, organic inputs (manure and plant biomass application) play a crucial role in N replenishment. Also, organic inputs have an important advantage over
inorganic fertilizers with regard to fertility replenishment, in that they provide a source of carbon for microbial utilization. Soil microorganisms need a C substrate for growth and
energy. They utilize the N from organic inputs, which results in the formation of soil organic N. Part of the N bound in the more recalcitrant forms in the organic inputs will also build up soil humic substance.
Phosphorus replenishment is usually accompanied by nitrogen replenishment because
phosphorus can build the fertility of the soil either immediately or within a few years, and that the residual effect of such replenishment lasts for at least 10 years (Lopez, 1996).
Application of superphosphate in the order of 150 to 500 kg P ha-1 is probably the most direct way to replenish P capital and the effect lasts for several years in high P-fixing
soils (Goedert, 1987). The phosphorus content of plant residues and manures is normally insufficient to meet crop requirements. Plant materials applied as organic inputs (biomass transfer, manures and composts) contain 8 to 12 kg P ha-1 when applied at the rate of 4 t dry matter ha-1 (Palm, 1995). The decomposition of organic inputs produces organic acids that may dissolve (solubilize) phosphate rock. A combination of phosphate rock with
compost has been shown to increase the availability of phosphorus (Negassa et.al, 2003). In intensive cropping, soil productivity can be sustained only through integrating mineral phosphorus application with organic inputs (manure, composts and plant residues) and
this is the most effective means of replenishing soil phosphorus.
Potassium deficiencies do occur in specific circumstances, but is not to the same extent as N and P deficiencies. The level of K-mining is six times that of P-mining, but crop
responses to K fertilization, however, are rare in Africa except in sandy savanna soils (Ssali et al., 1986). This is probably due to the high K capital in many parts of Africa,
even though it is rapidly being depleted.
2.4 Use of Organic Manures
The organic manure improves soil fertility by influencing its physical, chemical and biological properties. It improves water circulation and soil aeration, and increases the
soil moisture holding capacity (Soltner, 1985). According to Nyle and Brady (2003), the organic manure also improves the soil by the formation of clay humic complexes which
increase the soil adsorbent capacity of basic nutrients (calcium, magnesium and potassium) and enhances the activity of microorganisms involved in the mineralization
process.
Hoyt and Turner (1975) cited by Nabahungu, (2003), stated that the soil pH can also be significantly increased by adding organic residues into the soil. This is attributed to
higher concentrations of basic nutrients in organic amendments and hydrous oxides reduction in soils (Hue, 1992). Plants can only use nutrients that are in an inorganic form. Manure N and P are present in organic and inorganic forms, and are, therefore totally
unavailable to plants. The organic forms must be mineralized or converted into inorganic forms over time before they can be used by plants.
The availability of K in manure is considered similar to that in commercial fertilizer since
the majority of K in manure is in the inorganic form (Motavalli et al., 1989). In general, 90 to 100 % of K in manure is available during the first year of application. Zhang et al.
(1998) found that 2 kg manure-N were equivalent to 1 kg of urea-N in terms of plant uptake and yield response during the first year following cattle feedlot manure
However, the nutrient content of manure varies, and the reason is that the fertilizer value of manure is greatly affected by diet, amount of bedding, storage and application method
(Harris et al., 2001). Cross and Strauss (1985) reported the following nutrient contents for municipal wastes, 0.4 – 3.6 % N, 0.3– 3.5 % P2O5, and 0.5 – 1.8 % K2O, while Leonard (1986) reported 1.1 % N, 1.1 % P2O5 and 0.5 % K2O for poultry manure at 70 % moisture content.
2.5 Use of Mineral Fertilizers on Crop Production
Mineral fertilizers are used to supplement the natural soil nutrient supply in order to
satisfy the demand of crops with a high yield potential and produce economically viable yields; compensate for the nutrients lost by the removal of plant products or by leaching or gaseous loss (IFIA,2000). In Rwanda, mineral fertilizers have contributed to increased
yields of maize even though achieving potential yields is still a challenge due to other important factors involved in crop production (MINAGRI, 2011). In most recent
projective studies of global agricultural production into the 21st century, suggest that a global food crisis is unlikely but that many countries and regions will continue to suffer
from chronic malnutrition. From a resource perspective, growing world population and per capita incomes will likely require more intensive agricultural crop production. Higher yields will in turn increase the demand for agricultural inputs, especially mineral
fertilizers (FAO, 2004).
Lack of credit, poor marketing capabilities, high transport costs, lack of availability of fertilizer, inadequate demand to stimulate investment in production and distribution, lack
constrain fertilizer use. The lack of credit has been identified as a major determinant of fertilizer use in many African countries including Rwanda especially for poor and middle
households (IFDC, 2009). The assessment of agricultural inputs market in Rwanda reveals that agri-inputs use in Rwanda is among the lowest in Africa, only 15% of the
farmers used mineral fertilizers in 2005 while 26% of the farmers in 2011 were reported having used mineral fertilizers alone or in mix with organic fertilizers (IFDC, 2009; MINAGRI, 2011). The reasons are mainly unavailability of right agri-inputs at the right
time and of right amounts in rural areas. Equally important is the cost of agri-inputs, farmers‟ purchasing power, poor extension services and the weakness of the private
sector. Fertilizer recommendations are outdated and so the advisory sector does not stand confident (IFDC, 2009). However, many reports in the literature have shown that continuous use of sole fertilizers may lead to shortage of nutrients not supplied by the
chemical fertilizers and may also lead to chemical soil degradation (Mafongoya et al., 2006).
2.6 Importance of Combined Organic and Mineral Fertilizers
Integrated nutrient management implies the maintenance or adjustment of soil fertility and of plant nutrient supply to an optimum level for sustaining the desired crop productivity on one hand and to minimize nutrient losses to the environment on the other
hand. It is achieved through efficient management of all nutrient sources. Nutrient sources to a plant growing on a soil include soil minerals and decomposing soil organic
For sustainable crop production, integrated use of chemical and organic fertilizer has proved to be highly beneficial. Several researchers have demonstrated the beneficial
effect of combined use of chemical and organic fertilizers to mitigate the deficiency of many secondary and micronutrients in fields that continuously received only N, P and K
fertilizers for a few years, without any micronutrient or organic fertilizer. Research has shown that that combinations of organic and mineral fertilizers result in greater crop yields compared with sole organic or sole mineral fertilizers (Chivenge et al., 2009).
Vanlauwe et al. (2002b) reported that grain yield increases of up to 400% over the control in cases where the control yields are low. This increase in grain yield has been attributed
to improved N synchrony with combined inputs through direct interactions of the organic and N fertilizers.
Based on the evaluation of soil quality indicators, Dutta et al. (2003) reported that the use
of organic fertilizers together with chemical fertilizers, compared to the addition of organic fertilizers alone, had a higher positive effect on microbial biomass and hence soil
health. Application of organic manure in combination with chemical fertilizer has been reported to increase absorption of N, P and K in sugarcane leaf tissue in the plant and ratoon crop, compared to chemical fertilizer alone (Bokhtiar and Sakurai,2005). Kaur et
al. (2005) compared the change of chemical and biological properties in soils receiving FYM, poultry manure and sugarcane filter cake alone or in combination with chemical
fertilizers for seven years under a cropping sequence of pearl millet and wheat. Results showed that all treatments except chemical fertilizer application improved the soil organic C, total N, P and K status. Sutanto et al. (1993) in their studies on acid soils for
produced excellent responses. Boateng and Oppong (1995) studied the effect of farmyard manure and method of land clearing on soil properties on maize yield and reported that
plots treated with poultry manure and NPK (20-20-0) gave the best yield results.
In Rwanda, farmers still need to pursue sustainable intensification to maintain food security, mitigate the effects of weather variability and climate change, protect land and
increase incomes (IFDC, 2002). ISFM is a sustainable approach that acknowledges the need for both organic and mineral inputs to sustain soil health and crop production due to
positive interactions and complementarities between them (ASHC, 2012).
2.7 Crop Nutrient Uptake and Nutrient use Efficiency 2.7.1 Crop Nutrient Uptake
The goal of balancing nutrient inputs with crop removals is twofold; it reduces the
build-up of nutrients and addresses environmental concerns while keeping soil fertility management costs to a minimum. Actual uptake and removal of nutrients varies with
crop yield, variety and soil fertility from year to year. Crop nutrient uptake is affected by soil and climatic conditions. Low soil moisture, poor aeration due to compaction or excessive moisture, low soil temperature and high lime in the root zone, nutrient
imbalances and other factors may restrict uptake of plant nutrients (CFI, 1998).
Maximum nutrient uptake varies among crops and generally occurs prior to maximum growth rates but plants require a balanced supply of nutrients throughout their
development (Jones et al., 2011). These authors also reported that low nutrient uptake early in the early stages of plants growth lowers nutrient quantity for the seed affecting
crop growth rates vary with crop, variety and growing conditions. Sanchez and Doerge (1999) and Jones et al. (2011) also reported that timing the application of nutrients so that
they are available before peak crop nutrient demand as critical. Adequate nutrients early in the growing season are necessary to maximize yield and ensure that especially N and P
are available for good grain and seed fill.
Nutrient uptake is dependent on both the ability of the roots to absorb nutrients and the concentration at the surface of the roots. Roots spread out both laterally and vertically as the plant grows to take advantage of areas within the soil that have more water and
nutrients. Nutrient uptake varies with stage of plant growth (Jones and Jacobsen, 2001). Plants have been reported to have difficulty in absorbing nutrients in dry soil because
most nutrients are elemental and not in ionic forms. Therefore during the dry seasons, nutrient levels in plant tissues may be lower than normal (Sanchez and Doerge, 1999).
Potassium and other nutrient deficiencies commonly occur in crops during dry years even though the soil test shows adequate amounts. Tillage practices are also reported to influence soil temperature, moisture and aeration which eventually affect nutrient uptake.
Fertilizer placement may also influence nutrient availability and may depending upon conditions, either enhance or reduce nutrient uptake (Jones et al., 2011). Mahamoud et al.
(2009), as quoted by Malathesh (2005) reported that P uptake increased at different growth stages of maize with increasing rates of nitrogen and phosphorus. Nitrogen content of maize grain ranged between 1.36 and 1.75 percent and P content between 0.15
and 0.22 percent, with nitrogen rates of 5 to 200kg/ha. Under irrigated conditions the relative N uptake was related to fertilizer application and soil nitrate contents. N content
2005). Similarly, the N amount in the grains of maize generally increased with increasing nitrogen application. Sharma (1983) as quoted by Malathesh (2005) found out that
addition of FYM at 12t/ha along with fertilizer levels of up to 60kg N, 30kg P2O5 and 30kg K2O per hectare significantly improved the nitrogen uptake by the maize crop.
Mahmoud et al. (2009) reported that the increase of N uptake appeared to be more
obvious when compost was mixed with the mineral N fertilizer as compared to the 100% compost or 100% N mineral fertilizer alone on improving soil physical properties or to a higher mineralization of composts which is due to mineral N inputs. Crop response to P
depends on the availability of P in the soil solution and the ability of the crop to take it up. The ability of a plant to take up P depends on its root distribution relative to P
location in the soil. This is because P is highly immobile in soil and does not move far in the soil to get to the roots.
2.7.2 Nutrient Use Efficiency
Efficient use of nutrients in agriculture may be defined differently when viewed from agronomic, economic or environmental perspectives (Mikkelsen, 2005). Nutrient use
efficiency can be expressed in several ways: by partial factor productivity (PFP, kg crop yield per kg nutrient applied); Agronomic Efficiency (AE, kg crop yield increase per kg nutrient applied); Apparent Recovery Efficiency (RE, kg nutrient taken up per kg nutrient
applied) and Physiological Efficiency (PE, kg yield increase per kg nutrient taken up) (Roberts, 2008).
Estimates of fertilizer use efficiency usually differ depending upon the climate, crop and
application) and management practices (Munir et al., 2006). Over or under application of fertilizer result in reduced nutrient use efficiency or losses in yield and crop quality. Soil
testing is thus crucial for determining the nutrient supplying capacity of the soil and also for making appropriate fertilizer recommendations (Roberts, 2008). Roberts (2008)
emphasized that great synchrony between crop demand and nutrient supply is necessary to improve nutrient use efficiency, especially for N.
Nitrogen Use Efficiency (NUE) is a term used to indicate the ratio between the amount of fertilizer N removed from the field by the crop and the amount of fertilizer N applied
(Brentrup and Palliere, 2010). Crop removal efficiency, that is removal of nutrient in harvested crop as a percentage of nutrients applied, is commonly used to explain further
the nutrient use efficiency (Roberts, 2008). Kayuki et al. (2012) reported that at very high N application rate the NUE declined despite the slight increase in grain yield and this had
earlier been reported by Kogbe etal. (2003). Maranville et al. (2002) added that nitrogen use efficiency (grain weight per unit of N supplied from soil and/or fertilizer) is reduced due to poor crop cultural practices, sub-optimal yields and N losses or deficiency of other
nutrients.
The efficiency of fertilizer P use by crops ranges from 10 to 30% in the year that is applied. The remaining 70 to 90% becomes part of the P pool which is released to the
crop over the following months and years (Malhi et al., 2002 and Johnston and Syres, 2009). Phosphorus use efficiency is sometimes measured by expressing total P uptake as a percentage of the P applied (Syres et al., 2008). Kogbe and Adediran (2003) reported
Application of 40kg P2O5 /ha appeared to be the optimum since at higher rates, the yields were depressed.
2.8 Maize Response to N and P Fertilizers
The major objective of an efficient fertilization program is to be certain that adequate N and P are available during the growing season so that plant growth and yields are not limited by nutrient supplies (Alley et. al, 2009). The maize must have adequate quantity
of nitrogen (N) and phosphorus (P) for profitable production. The maize plant requires N and P soon after germination to initiate the growth of stems, leaves and ear structures.
Significant amounts of N are transferred from leaf tissue to grain during the grain-fill process. Phosphorus uptake is more constant throughout the season and generally
parallels to dry weight increases.
Inadequate N availability during the first two to six weeks after planting can result in reduced yield potentials (Jones, 1985). However, the majority of N is needed during the
period of maximum growth (month prior to tasseling and silking). Phosphorus availability is equally critical during the early stages of plant growth because the movement of P to plant roots is reduced with cold soil temperatures (Sharpley et al.,
1994). Thus, P deficiencies are most often observed during the early part of the growing season.
The beneficial and environmentally sensitive maize production requires that N and P be managed in an efficient manner. Economic returns from the use of these nutrients can be maximized, when the potential for surface and groundwater enrichment with N and P can
methods, and timing). Nitrogen and P uptake follows the same general trend as plant grows (Alley et al., 2009). Zingore (2011) in his study concluded that the application of
N and P alone led to a significant increase in maize grain yields on the high fertility fields, but on the depleted soils, baseline yields were very low, and were increased to less
than 1 t/ha by applying N and to less than 2 t/ha by applying N and P. Mukuralinda et al. (2010) on their study on P uptake and maize response to organic and inorganic fertilizer inputs in Rubona, Southern Province of Rwanda showed that the combination of green
manure with TSP at a rate of 50 kg ha-1 significantly increased maize yield from 24 to 508 % when compared to the control. Equally, the same study showed higher P uptake
(15.6-18.6 kg ha-1) than the control (5 kg P ha-1).
2.9 Role of Soil Biota in Soil Fertility Improvement
In soil, microorganisms occur in great numbers and variety. They are essential for maintaining soil fertility and plant growth as they play an important role in nutrient
cycling and availability (Fritze et al., 1994). Microorganisms being a part of all natural and man- made ecosystems, compose biocenoses, which are significant, and essential
biochemical elements responsible for the entirety of biogenic element transformation in the soil environment which exert critical effects on biochemical activity and ecological stability, as well as biological productivity of many fields such as forest, agricultural and
grassland ecosystems. Soil organisms mediate both the synthesis and decomposition of organic matter and therefore influence cation exchange capacity, the soil N, S, and P
biologically active substances (amino acids, vitamins, antibiotics, toxins) and nitrogen
fixation from the atmosphere (Kennedy and Gewin, 1997).
Increased soil microbial activity can improve carbon turnover, increase crop nutrient supply and produce a more stable soil structure. Soil microbes improve structure by stabilizing the aggregation of soil particles through the production of organic „glues‟ and
fungal hyphal networks (Martens, 2001). The disruptive effect of tillage in intensive stubble retention cropping systems could be reduced significantly by the associated
increase in microbial activity (Martens, 2001). Soil microbes also reduce the loss of inorganic fertilizers through erosion and leaching by short-term immobilization of the
nutrients from the inputs. Further, soil microbes play a key role in the stabilization of soil structure as well as reduced reliance on agrochemicals and persistence of pesticides in soil (Martens, 2001). The two main soil microbial groups, fungi and bacteria often play
different roles in nutrient cycling and are affected differently by changes in soil pH, moisture, C:N ratio and substrate type (West, 1986).
2.10 Environmental Factors Affecting Maize Production
Maize is grown in tropical, sub-tropical and temperate climates (FAOAGL, 2002). The
highest production, however, occurs between 21 and 270C with annual precipitation of 500 to 2000 mm. Soil water availability is often the main factor limiting rain fed maize
production. In these water-limited systems, efficient capture and retention of precipitation is essential to maximize crop growth. This is especially true for summer annual crops such as maize, which exhibit yield reductions in response to soil water deficits at any
losses in individual seasons have approached 60% in regions such as southern Africa
(Rosen and Scott, 1992).
The maize crop can tolerate a wide range of temperatures (from 5 to 450C), but very low or very high temperatures can have a negative effect on yield. Nielsen (2007) found that maximum temperatures greater than 32oC around tasseling and pollination speeded up the differentiation process of their productive parts and resulted in higher rates of kernel abortion and yield reduction. Soil characteristics have an important bearing on the
productivity of the maize crop. Olson and Sander (1988) described suitable soil environment for maize and observed that maize is grown across a wide range of soils
from raw sands to clays, strongly acid to strongly alkaline soils, and shallow to deep soils, with large variations in crop productivity. Below pH 5, toxicity of Al, Mn and Fe may be encountered, though maize is relatively tolerant. At very low pH, soils are likely
to be deficient in P due to tying up with the active Al component.
In addition, production of NO3- from NH4+ is greatly retarded due to inactivity of the nitrobacter organism. At high pH levels, nutritional problems are often encountered with
the elements P, Zn and Fe. For example, in calcareous soils with pH 7.5 to 8.4, P is deficient because virtually all phosphate ions are converted to low solubility tricalcium
CHAPTER THREE 3.0 MATERIALS AND METHODS
3.1.0 Description of the Study Areas
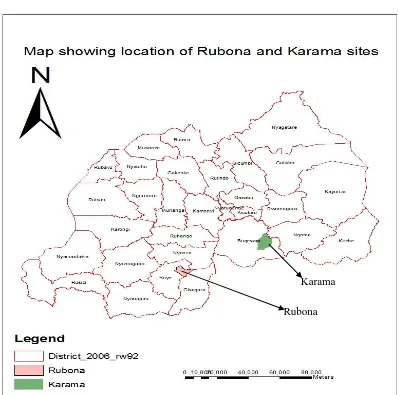
The study was conducted at two sites, Rubona and Karama which are sub-stations of the
Soil Research Stations of Rwanda Agriculture Board (RAB) (Fig. 2).
3.1.1 Rubona Station
This sub-station is situated in Southern Province of Rwanda, Huye District. The area lies
between latitudes S 02028‟875‟‟ and longitudes E 029045‟790‟‟ of the Greenwich meridian. The altitude of Rubona is estimated at 1650 m above sea level. The annual
rainfall is estimated to be between 1160 and 1400 mm, while the average annual temperature is 18.90C. The area experiences a long dry season of 2-3 months (Jun – August) each year. The soils in this area are Ultisols according to USDA classification
(ISAR,1987) and are clay loam/sandy clay in textural class.
3.1.2 Karama Station
This Station is situated in Eastern Province of Rwanda, Bugesera District. The area lies
between latitudes S 02016‟001‟‟and longitudes E 030015‟351‟‟ of Greenwich meridian. The altitude of Karama station is estimated at 1400 m above sea level. The annual
rainfall of the area is around 855 mm with an annual average temperature of 20.80C. The area is characterized by a long dry season of 3-4 months. The soils are classified under
Figure 2 shows the location of Rubona and Karama in Huye and Bugesera Districts of Rwanda.
Figure 2: Map of Rwanda. Source: ArcGIS, NRM Unit (RAB). 3.2. Initial soil Fertility Status
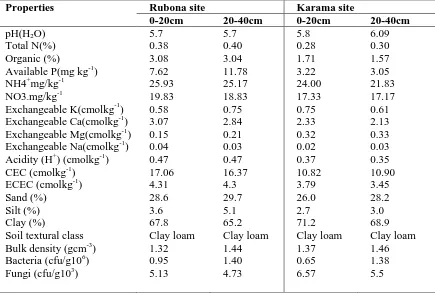
In order to characterize the soil of the experimental fields, samples were taken across the fields from two depths, 0-20 and 20-40 cm and bulked for laboratory analysis. In the laboratory, part of the soil samples were air-dried, crushed using a wooden mortar and pestle and then sieved through a 2 mm mesh. The other part of soil samples was stored in fridge (40C) for mineral N and microbial analyses. The sieved samples were stored in polythene bags for laboratory chemical and physical analyses at the Soil Research
Laboratory of RAB at Rubona. The physical and bio-chemical properties of the soil before planting are shown on Table 1.
Table 1: The initial physical and bio-chemical characteristics of the soil at Rubona and Karama sites
The initial soil status analyzed before the commencement of the experiments showed that the soil was fairly fertile in terms of physical properties and some chemical properties.
The soil textural class was Clay loam at both Rubona and Karama sites. The soil pH before application of treatments ranged from 5.7 which is moderately acidic at Rubona
site to 6.09 which is slightly acidic atKarama site (Table 1). The soil available P was low at Karama (3.22 mg kg-1 at 0-20cm and 3.05 mg kg-1at 20-40 cm) and high at Rubona site (7.62 and 11.78 mg kg-1, respectively, at 0-20 and 20-40 cm depths).The exchangeable cations (K, Na, Ca and Mg) were not also high at the two sites. The total N(0.38%) and
Properties Rubona site Karama site
0-20cm 20-40cm 0-20cm 20-40cm pH(H2O)
Total N(%) Organic (%)
Available P(mg kg-1) NH4+mg/kg-1
NO3-mg/kg -1
Exchangeable K(cmolkg-1) Exchangeable Ca(cmolkg-1) Exchangeable Mg(cmolkg-1) Exchangeable Na(cmolkg-1) Acidity (H+) (cmolkg-1) CEC (cmolkg-1) ECEC (cmolkg-1) Sand (%)
Silt (%) Clay (%)
Soil textural class Bulk density (gcm-3)
Bacteria (cfu/g106) Fungi (cfu/g103)
organic carbon(3.08%) were moderate. The bulk density of the top soil (0-20 cm) was 1.32 gcm-3 and 1.44 gcm-3 at 20-40 cm depth at Rubona while in Karama site, the bulk density was 1.37 gcm-3 and 1.46 gcm-3 at 0-20 cm and 20-40 cm depths, respectively.
The analysis for microbial biomass at the initial stage showed 0.95 cfu/gm106 and 1.40 cfu/gm106 for bacteria, and 5.13 cfu/gm103 and 4.73 cfu/gm103 for fungi, at the depths 0-20 cm and 20-40 cm, respectively, at Rubona site. While at Karama site, the number of bacteria recorded was 0.65 cfu/gm 106 and 1.38 cfu/gm106at 0-20 cm and 20-40 cm, respectively, while the number of fungi recorded was 6.57cfu gm103 and 5.5 cfu/gm103 with respect to the depths.
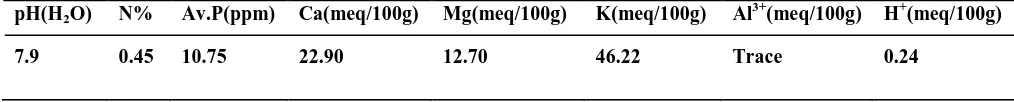
3.3. Characterization of Manure Used in the Experiments
The manure used in the experiment was analyzed for pH, total N, available P and
exchangeable cations (Ca, Mg, K, Al3+ and H+) following the procedures as outlined by Okalebo et al.,(2002). Table 2 shows the results of manure characterization.
Table 2: Some chemical composition of the manure used in the experiments
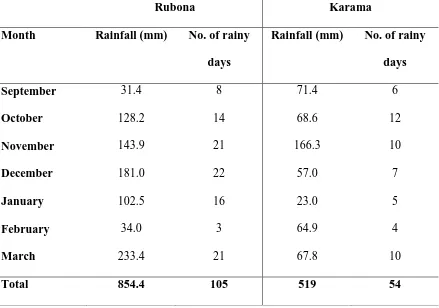
3.4. Rainfall pattern during season A 2013 at Rubona and Karama stations
Table 3 shows the amount and distribution of rainfall received during the growing season at both sites.
pH(H2O) N% Av.P(ppm) Ca(meq/100g) Mg(meq/100g) K(meq/100g) Al3+(meq/100g) H+(meq/100g)
Table 3: Rainfall pattern at Rubona and Karama during the growing season
Rubona Karama
Month Rainfall (mm) No. of rainy days
Rainfall (mm) No. of rainy days
September 31.4 8 71.4 6
October 128.2 14 68.6 12
November 143.9 21 166.3 10
December 181.0 22 57.0 7
January 102.5 16 23.0 5
February 34.0 3 64.9 4
March 233.4 21 67.8 10
Total 854.4 105 519 54
Source: RAB, Meteo. Services.
Rubona received higher rainfall (854 mm) than Karama (519 mm) during season A of 2013. In terms of rainfall pattern, rainfall at Rubona was well distributed throughout the
season, recording a total of 105 rainy days as compared to 54 rainy days at Karama during the same period.
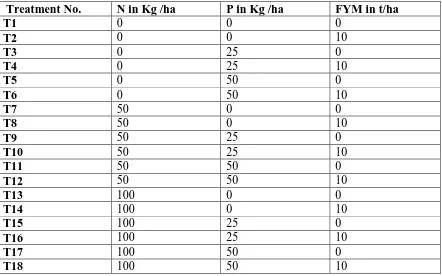
3.5. Experimental Design and Treatments Layout
The experimental sites were located at Rubona and Karama were conducted on the RAB
experimental fields. The two trials sites,that is Rubona and Karama are located in Huye and Bugesera districts, respectively. The treatments were a factorial design arranged in a
manure) at three levels for nitrogen (0, 50 and 100 kg/ha), three levels for phosphorus ( 0, 25 and 50 kg/ha) and two levels for manure (0 and 10 tons/ha) resulting to 18
treatments. The experiment was replicated three times. Table 4: The experimental treatments and their design
Treatment No. N in Kg /ha P in Kg /ha FYM in t/ha
T1 0 0 0
T2 0 0 10
T3 0 25 0
T4 0 25 10
T5 0 50 0
T6 0 50 10
T7 50 0 0
T8 50 0 10
T9 50 25 0
T10 50 25 10
T11 50 50 0
T12 50 50 10
T13 100 0 0
T14 100 0 10
T15 100 25 0
T16 100 25 10
T17 100 50 0
T18 100 50 10
3.6. Planting and Fertilization
Maize variety, ZM 607 was used as the test crop. The planting dates were on 16th October 2012 at Karama and on 22th October 2012 at Rubona sites. Land preparation was done by hand using hoes, loosening a layer of up to 0-20cm depth. Planting holes were prepared
where the soil and cattle manure were mixed. Plot size was 4.5 m x 4.5 m with a spacing of 75 cm between the rows and 30 cm within the rows. Two seeds were planted per hole and thinned to one 10 days after emergence. At planting, TSP was applied and
weeks and another at six weeks after emergence. Fertilizers were pre-weighed for each plot before going to the field and applied using dollop cups to ensure uniform distribution
to all plots. The trial was maintained weed free during the entire study period.
3.7. Yield Measurements
The grain and straw harvesting was done on 21th March 2013 at Karama and on 29th March 2013 at Rubona. The whole plants on the plots were harvested, except for the
border rows, by cutting at the ground level and weighed as fresh weight. A sub-sample of 6 plants were randomly selected and weighed. The plants were then separated into ears
(cob + grains) and stover (stem, leaves and husks). The plant parts namely ears and stover were weighed and their weights recorded as fresh weights. The ears were further separated into cobs and grains after shelled and weighed. The various plant parts were put
in brown paper envelopes, oven dried at 600C for 48 hours and then weighed as dry matter. The lengths of six husked maize ear per plot were measured with tape and the
mean value calculated. All the weights were converted and calculated on a dry weight basis.
The ear girth was also taken from a sample of six ears per plot with the use of tailor‟s
tape and the values were recorded and averaged. One thousand numbers of grains were also counted from each plot and weighed.
3.8. Soil Sampling and Analysis
organic carbon, available N (NH4+ and NO3-), total nitrogen, calcium, magnesium, sodium, potassium, CEC and ECEC. Microbial population (bacteria and fungi biomass)
was also determined at the beginning and at the end of the experiments. Bulk density and soil texture were determined at the beginning of the experiment.
3.8.1. Soil pH
Soil pH was measured in a 1:2 soil-water ratio using a glass electrode (H19017 Microprocessor) pH meter. Approximately 25 g of soil were weighed into a 100 ml
polythene beaker and 50 ml of distilled water was added to the soil. The soil-water solution was stirred thoroughly and allowed to stand for 30 minutes. After calibrating the
pH meter with buffers of pH 4.01 and 7.00, the pH was read by immersing the electrode into the upper part of the soil solution and the pH values recorded.
3.8.2. Total Nitrogen and Carbon in Soil
Both total N and C in the soil were determined using the flash combustion method using the CN Elemental Analyzer (Krotz et al., 2013). Fifteen grams of soil was weighed in a tin capsule. This was done twice: first after filling the tin capsule and second after
folding the tin capsule.
The weight of each sample was recorded in the sample table which is contained in the
Eager Experience Software which calculates and records the data as obtained from the CN analyzer. The flash elemental analyzer system completely oxidizes the sample with a
sample was burned in a pure oxygen environment. The carbon in the sample was converted into carbon dioxide, nitrogen into free air or oxides and hydrogen to water. A
stream of helium gas carried those gases into a quartz column (which carries the reduction processes) filled with copper that reduced the nitrogen oxides to nitrogen and
removes excess oxygen. The gas stream then flowed through a magnesium perchlorate trap (adsorption filter) which removed water before CO2 and N2 went into a gas chromatograph (GC) column at room temperature. N2 then flowed through the gas chromatograph column first (retention time -110 seconds) then CO2 (retention time- 190s) and the thermal detector (TD) was used to give the quantitative data. Helium is
used as a carrier gas because it is chemically inert.
3.8.3. Determination of Soil Available Nitrogen (NH4+ +NO3-)
Soil mineral nitrogen (NH4+ +NO3-) was determined using the flow injection method using the Flow Injection Analyzer (FIA). The method uses cadmium reductor for nitrates and gas diffusion method for ammonium (Singh, 1988). Nitrates in the soil sample were
extracted using 2M KCl solution. Five grams of air-dried soil was weighed into a 50ml polythene bottle and 25ml of 2M KCl was added and mechanically shaken for one hour. The suspension was centrifuged and filtered through Whatman No.1 filter paper and the
filtrate was then introduced into the flow injection system.
The procedure for determination of nitrates is reduction to nitrite in a cadmium reductor.
(Nitrates are reduced into nitrites because nitrates cannot react with sulphanilamide). The nitrites reacted with sulphanilamide to form a diazo-compound which further reacted with NED to form an Azo dye (pink in colour) whose absorbance was read at 540nm.
results obtained were expressed in ppm units. To obtain ppm in the soil, the following formula was used:
w= (CxV)/W
Where: w= mg NO3--N/kg soil; C= concentration nitrate as mg/l NO3- -N; V= volume of the extract in ml; W= weight of the sample in g.
For ammonium, the soil was also extracted by 2M KCl solution. Five grams of air-dried soil was weighed in 50ml polythene bottle and 25ml of 2M KCl was added and shaken mechanically for one hour. The suspension was then transferred into centrifuge tubes and
centrifuged for 5 minutes then filtered through Whatman No. 1 filter paper to obtain a clear filtrate. The filtrate was then introduced into the flow injection system. The soil
sample extract was injected into a carrier stream which is merged with sodium hydroxide stream. In the resulting alkaline stream gaseous ammonia is formed which diffused
through a gas permeable membrane into an indicator stream. The indicator stream which comprises of a mixture of acid-base indicators reacted with ammonia gas. A colour shift resulted which was measured photometrically at 590nm. The results were expressed in
mg NH4+-N mg/kg (ppm) sample using the following formula: w= (cxv)/W
Where: w= mg NH4+-N/kg soil (ppm); c= concentration ammonium as mg/l NH4+-N;
v= volume of the extract in ml; W= weight of soil sample in g.
3.8.4. Determination of Available P in Soil
HCl and 0.025N H2SO4 solutions. The hydrochloric acid serves to replace the bulk exchangeable metal cations. The sulphate ions in the acid medium fulfils the replacement
of the soluble P available to plants which is held in exchangeable form.
Five grams of dried soil was weighed in 50ml polythene bottle and 25ml of extracting solution was added. The suspension was shaken mechanically for one hour and then
transferred into centrifuge tubes and centrifuged for 5 minutes which was then filtered through Whatman No.1 filter paper to obtain a clear filtrate. Five milliliters of working
standard series, soil extract and blank were pipetted into test tubes. One milliliter of ammonium vanadate-molybdate mixture was added and mixed well and its optical
density read on the UV-Visible spectrophotometer after one hour at 430nm. To obtain the concentration of P in the soil (ppm), the ppm in solution obtained from the UV-Visible spectrophotometer was multiplied by the dilution factor, which is the ratio of soil sample
in grams to the extracting solution which in this case was the ratio 1:5 obtained from 5g of soil sample in 25ml extracting solution.
3.8.5. Determination of Magnesium in the Soil
Measurement of the level of magnesium in the soil was done at the beginning and at the end of the experiment. The content of magnesium in the soil was determined using the
Mehlich1 double acid extraction method ( Savoy, 2009). Five grams of dried soil was weighed in 50ml polythene bottles and 25ml of extracting solution (0.1N HCl and
0.025N H2SO4) was added.
filter paper to obtain a clear filtrate. One milliliter of the extract was then pipetted into test tubes. Five milliliters of magnesium compensating solution was added, followed by
2ml titan yellow and 2ml sodium hydroxide mixing after each addition. The optical density was then read on the UV-Visible spectrophotometer after one hour at 540nm.
3.8.6. Determination of Ca, K and Na in Soil
To assess the fertility of the soil, Ca, Na and K were determined at the beginning and at the end of the experiment. The method used was the Mehlich1 double acid extraction
method (Savoy, 2009). Five grams of soil sample was weighed into 50ml polythene bottle and 25ml extracting solution was added (0.1N HCl and 0.025N H2SO4). The suspension was mechanically shaken for one hour and then transferred to centrifuge tubes where it was centrifuged for 5 minutes and then filtered through Whatman No.1 filter paper to obtain a clear filtrate. The concentrations of the cations in the soil extract were
then measured using the flame photometer. A calibration graph was obtained from the working standard series against elements (Ca, K and Na) concentrations (in meq/100g
soil) from which the concentrations of cations were read.
3.8.7. Determination of Exchangeable Acidity in Soil
The determination of exchangeable acidity (H+ and Al3+) was done by weighing 5g of soil sample which was leached using potassium chloride (K+ ions replace exchangeable H+ and Al3+ held against permanent negative charges of the exchange complex). The total exchangeable acidity was determined by titrating with NaOH. The amount in milliliters of NaOH needed to bring the potassium chloride back to its original pH is equivalent to
Seventy five milliliters of 1M KCl solution was used for leaching. To the filtrate, 2-3 drops of phenolphthalein indicator were added and filtrate was titrated with 0.05N NaOH
until the colour changed from colourless to pink. The amount of NaOH used for reaction, that is bringing back to original pH was equivalent to amount of H+ and Al3+ exchanged and was calculated. Each ml of NaOH used is equivalent to milliequivalent per 100g of soil.
3.8.8. Effective Cation Exchange Capacity (ECEC)
Effective cation exchange capacity was determined by the sum of exchangeable bases (Ca2+, Mg2+, K+ and Na+) and exchangeable acidity (Al3+ + H+).
3.8.9. Soil Texture Size Determination
The soil texture was determined by the Hydrometer method as outlined by Okalebo et al.,(2002). Approximately 40 g of soil was weighed into 250 ml beaker and oven dried at
105 0C over night. The sample was removed from the oven and then placed in a desiccator to cool, after, which it was weighed and the oven dry weight taken. A 100 ml of dispersing agent commonly known as Calgon (Sodium Bicarbonate and Sodium
Hexa-metaphosphate) was measured and added to the soil. It was then placed on a hot plate and heated until the first sign of boiling was observed. The content in the beaker was washed
completely into a shaking cup and then fitted to a shaking machine and shaken for 5 minutes. The sample was sieved through a 50 microns sieve mesh into a 1.0 L cylinder.
The sand portion was separated by this method while the silt and clay went through the sieve into the cylinder. The sand portion was dried and further separated using graded sieves of varying sizes into coarse, medium and fine sand. These were weighed and their
The 1.0 L cylinder containing the dispersed sample was placed on a vibration-less bench and then filled to the mark. It was covered with a watch glass and allowed to stand
overnight. The Hydrometer method was used to determine the silt and the clay contents. The cylinder with its content was agitated to allow the particles to be in suspension, it
was then placed on the bench and hydrometer readings taken at 30 seconds, 4 minutes, 1 hour, 4 hours and 24 hours intervals. At each hydrometer reading the temperature was also taken. Coarse silt, medium silt, fine silt and clay portions were then calculated
graphically. The various portions were expressed in percentage and using the textural triangle the texture was determined.
3.8.10. Bulk Density
Bulk densities of the soil profile, at each site from 0 – 20 cm and 20 – 40 cm depths were determined by the core ring method. An undisturbed soil core was taken from the field by
a core sampler and dried in a hot air oven at 1050C to a constant weight. The weight of the soil per unit volume was then calculated from the known volume of the core sampler.
Calculation:
Where:
3.8.11. Determination of Microbial Population in Soil
The measurement of bacteria and fungi was done at the beginning and at the end of the
experiment. Both bacteria and fungi in the soil samples were determined using the dilution plate counting method (Ogunmwoyi et al., 2008).
Nutrient agar (NA) and potato dextrose agar (PDA) was prepared and poured into sterile
petri dishes. The mixture was allowed to solidify and then labeled. 0.1gm of a broad– spectrum antibiotic e.g. chloramphenicol was added to a liter of PDA before dispensing
to inhibit growth of bacteria. Nine ml sterile dilution blanks was made with water in test tubes and labeled as 10-1, 10-2,….10-5. 1gm of well mixed soil sample was taken and suspended it in the first (10-1) 9ml water blank to effect the first diluents and shaken well to mix. Serially, the diluted soil suspension was made in water using the dilution tubes by transferring 1ml from first diluents (10-1) to the second water blank to effect the 10 -2
diluent. The same serial dilution was repeated up to the desired dilution. Aseptically, 0.1 ml inoculums of 10-1and 10-3 dilutions was transferred and spread on plates of PDA and NA plates, respectively. NA plates were incubated at 370C for approximate 18hrs and PDA at room temperatures for 24-72 hrs after which the plates were observed every day.
The colony forming units were counted in the plates using a colony counter and the