Scholarship@Western
Scholarship@Western
Electronic Thesis and Dissertation Repository
7-12-2012 12:00 AM
Evaluating the Montreal Cognitive Assessment (MoCA) and the
Evaluating the Montreal Cognitive Assessment (MoCA) and the
Mini Mental State Exam (MMSE) for Cognitive Impairment Post
Mini Mental State Exam (MMSE) for Cognitive Impairment Post
Stroke: A Validation Study against the Cognistat
Stroke: A Validation Study against the Cognistat
Lauren Friedman
The University of Western Ontario
Supervisor
Drs. Mark Speechley
The University of Western Ontario Joint Supervisor Robert Teasell
The University of Western Ontario
Graduate Program in Epidemiology and Biostatistics
A thesis submitted in partial fulfillment of the requirements for the degree in Master of Science © Lauren Friedman 2012
Follow this and additional works at: https://ir.lib.uwo.ca/etd
Part of the Analytical, Diagnostic and Therapeutic Techniques and Equipment Commons, Clinical Epidemiology Commons, and the Epidemiology Commons
Recommended Citation Recommended Citation
Friedman, Lauren, "Evaluating the Montreal Cognitive Assessment (MoCA) and the Mini Mental State Exam (MMSE) for Cognitive Impairment Post Stroke: A Validation Study against the Cognistat" (2012). Electronic Thesis and Dissertation Repository. 852.
https://ir.lib.uwo.ca/etd/852
This Dissertation/Thesis is brought to you for free and open access by Scholarship@Western. It has been accepted for inclusion in Electronic Thesis and Dissertation Repository by an authorized administrator of
(Spine Title: MoCA vs. MMSE in Post Stroke Cognition: A Validation Study)
(Thesis format: Monograph)
by
Lauren E. Friedman
Graduate Program in
Epidemiology and Biostatistics
School of Graduate and Postdoctoral Studies The University of Western Ontario
London, Ontario, Canada
ii
CERTIFICATE OF EXAMINATION
Joint Supervisor Examiners
Dr. Mark R. Speechley Dr. John Koval
Joint Supervisor
Dr. Robert W. Teasell Dr. Iris Gutmanis
Supervisory Committee
Dr. Marnin Heisel Dr. Jennie Wells
The thesis by
Lauren Elyse Friedman
Entitled:
The Evaluation of the Montreal Cognitive Assessment (MoCA) and the Mini Mental State Exam (MMSE) for Cognitive Impairment Post Stroke: A Validation Study
against the Cognistat
is accepted in partial fulfillment of the requirements for the degree of
Master of Science
Date
iii
Objective. To identify the better of two commonly used screening tools for detecting
probable cognitive impairment in stroke patients in a large regional rehabilitation hospital
(Parkwood Hospital, London, Ontario). This was a validation study of the Mini-Mental
State Exam (MMSE) and the Montreal Cognitive Assessment (MoCA), using the
Cognistat, as the criterion or ‘gold standard’. It was hypothesized that the MoCA is a
superior screening instrument to the MMSE for the detection of cognitive impairment in
stroke patients.
Methods. The MMSE and the MoCA were administered by occupational therapists and
the Cognistat was administered by the student investigator. A second Cognistat was
administered by two occupational therapists for the reliability sub-study. Age was
abstracted in a chart review and patients were asked their level of education. ROC curves,
sensitivity, specificity, positive and negative predictive values and positive likelihood
ratios were analyzed. Intraclass correlation coefficients and kappa statistics were also
calculated.
Results and Conclusion. The MMSE and the MoCA have relative strengths and
weaknesses. The MoCA had a slightly better diagnostic accuracy than the MMSE and
demonstrated to be the more sensitive tool. These results should be viewed with some
caution due to the use of the Cognistat as the gold standard.
Keywords: MoCA, MMSE, Cognistat, cognitive impairment, post-stroke, validity,
iv
I dedicate this thesis to my loving parents, Maureen and Michael Friedman who have
v
I would like to acknowledge and express my sincere gratitude to my supervisors, Drs.
Mark Speechley and Robert Teasell who were instrumental in the successful completion
of this thesis. I appreciate their guidance and advice throughout my career as a graduate
student. I would also like to acknowledge the occupational therapy team on the stroke
unit at Parkwood Hospital, London, Ontario for their time and hard work during data
collection. Lastly, I would like to acknowledge the Canadian Stroke Network for
vi
CERTIFICATE OF EXAMINATION ...ii
ABSTRACT...iii
ACKNOWLEDGMENTS ...iv
DEDICATION...v
TABLE OF CONTENTS ...vi
LIST OF TABLES ...viii
LIST OF FIGURES ...ix
LIST OFAPPENDICES ...x
LIST OF ABBEVIATIONS ...xi
CHAPTER 1: PURPOSE AND OBJECTIVE...1
CHAPTER 2: LITERATURE REVIEW ...3
2.1 Screening and the Validity of Screening Tests ...3
2.2 The MMSE...4
2.3 The MoCA ...9
2.4 The MMSE and the MoCA in Stroke Patients ...14
2.5 The Cognistat ...18
CHAPTER 3: OBJECTIVES AND HYPOTHESIS...27
CHAPTER 4: METHODS...28
4.1 Subjects ...28
4.2 Sample Size...29
4.3 Recruitment...29
4.4 Measures ...29
4.5 Data Collection ...31
4.6 Statistical Measures ...33
4.7 Data Analysis ...35
vii
5.3 The Cognistat ...46
5.4 Reliability Sub-study ...47
CHAPTER 6: DISCUSSION...49
6.1 The MMSE and the Cognistat...50
6.2 The MoCA and the Cognistat ...52
6.3 The Cognistat ...53
6.4 Validity of the Cognistat...55
6.5 Reliability Sub-study ...57
6.6 Limitations ...58
6.7 Clinical application and future research ...59
REFERENCES ...61
APPENDICES ...66
viii
Table 1: Descriptive Statistics of the study sample ...38
Table 2: The sensitivity, specificity, positive and negative predictive values and positive likelihood ratio (and (95% CI).for the MMSE and the MoCA with one or more impaired domains on the Cognistat...40
Table 3: The sensitivity, specificity, positive and negative predictive values and positive likelihood ratio (and 95% CI) for the MMSE and the MoCA with two or more impaired domains on the Cognistat...41
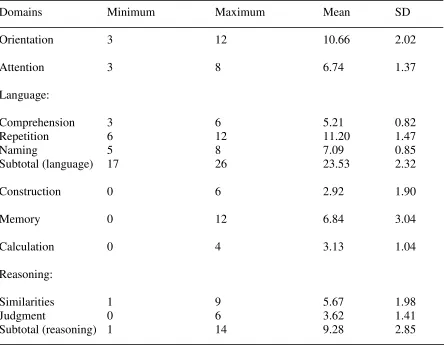
Table 4: Descriptive statistics for the Cognistat metrics ...46
Table 5: The frequency and percent of passes and failures on each screen on the Cognistat ...47
ix
Figure 1: Standard 2x2 Table ...34
Figure 2: Study population flow chart ...37
Figure 3: ROC curve for the MMSE ...41
Figure 4: ROC curve for the MMSE with executive function removed on the Cognistat.42
Figure 5: ROC curve for the MoCA ...42
Figure 6: Coordinates of the ROC curves...43
Figure 7: ROC curve for the MMSE when two or more domains are impaired on the Cognistat ...44
Figure 8: ROC curve for the MoCA when two or more domains are impaired on the Cognistat ...44
x
Appendix A: MoCA ...67
Appendix B: 2x2 Tables ...68
Appendix C: Letter of Information and Consent Form ...69
Appendix D: HSREB Approval Forms...75
xi AUC – Area Under the Curve
CI – Cognitive Impairment
Conf I – Confidence Interval
MCI – Mild Cognitive Impairment
MMSE – Mini Mental State Exam
MoCA – Montreal Cognitive Assessment
ROC – Receiver Operator Characteristics
Chapter 1
Purpose and Objectives
Purpose
Post-stroke cognitive impairment (CI) is frequent but remains underdiagnosed and
carries a poor prognosis (Godefroy et al., 2011). Post-stroke CI includes reduced mental
speed, neglect, attention deficits, aphasia, apraxia, and memory impairments (Godefroy et
al., 2011); (Nokleby et al 2008). Some form of cognitive impairment “is observed in 40
to 70% of patients and the severity of the impairment meets the criteria for dementia in
half of the cases” (Godefroy et al., 2011). Identifying CI in stroke patients initially is
facilitated by the use of an accurate screening tool. It is important that individuals who
have suffered a stroke and who screen positive for CI are then assessed to confirm the
level of impairment and provide direction for appropriate treatment. Treatment is
designed to prevent further cognitive decline and/or provide rehabilitation to improve
cognition. The Mini-Mental State Examination (MMSE) and the Montreal Cognitive
Assessment (MoCA) are two commonly employed screening instruments for detecting CI
after stroke. In the rehabilitation of stroke patients the most accurate tool should be used
to screen for CI leading then to further assessment and treatment. Early detection of
cognitive impairment is essential in facilitating the prevention of further cognitive decline
Objective
The main objective of this study was to identify the better of two commonly used
screening tools for detecting probable CI in stroke patients admitted to a large regional
rehabilitation hospital (Parkwood Hospital, London, Ontario). This was a validation
study of the MMSE and the MoCA, using the Cognistat, as the criterion or ‘gold
standard’. It was hypothesized that the MoCA is a superior screening instrument to the
MMSE for the detection of cognitive impairment in stroke patients. The rational for the
hypothesis stems from a review of literature. The MoCA has been demonstrated to be a
more effective tool in the detection of cognitive impairment compared to the MMSE in
several populations including those with Parkinson’s disease, cerebral small vessels
Chapter 2
Literature Review
2.1 Screening and the Validity of Screening Tests
The term screening, as used in this thesis, is defined as the administration of tests
to ‘sort out apparently well persons who probably have a disease [or impairment] from
those who probably do not’. A screening test is not intended to be diagnostic.” (Porta,
2008:224; parentheses added.) There are two rationales for screening for CI in stroke
patients. First, it is known that CI after stroke is common, but there are insufficient
resources to provide full clinical assessments for all patients. Second, screening is part of
secondary prevention, where a major focus is to improve outcomes through early
detection and prompt initiation of therapy.
Although screening tests are not diagnostic, both screening and diagnostic tests
are evaluated using a common set of epidemiologic methods. One major question is the
validity of the test when judged against a criterion or ‘gold standard’. Four basic
statistics used to evaluate a screening test are sensitivity, specificity, positive predictive
value, and negative predictive value. Two additional statistics that are extensions of the
above are the Area Under the Curve (AUC) and the Likelihood Ratio. These are
Two commonly used screening tests for CI in stroke patients are the Mini- Mental
State Examination (MMSE) and the Montreal Cognitive Assessment (MoCA). These
are described in the following sections.
2.2 The Mini- Mental State Examination (MMSE)
The Mini- Mental State Examination (MMSE) was designed by Folstein, Folstein
and McHugh in 1975) was designed in 1975 by Marshal Folstein to provide a
standardized, brief and practical assessment of cognitive status in geriatric patients. It is
used as a brief screening tool for cognitive impairment and does not identify specific
disorders (Crum, Anthony, Bassett, & Folstein, 1993). It concentrates only on the
cognitive aspects of mental functions and excludes questions on mood, abnormal mental
experiences as well as the form of thinking (Folstein, Folstein & McHugh.,1975). The
MMSE has been used with different cultural and ethnic subgroups and has been
translated into several different languages (Crum et al., 1993). A modified version has
also been created for the hearing impaired (Crum et al., 1993).
The MMSE is easily administered and requires only 5- 10 minutes to complete
depending on the impairment of the individual. The MMSE includes 30 items grouped
into five categories: orientation, registration, attention and calculation, recall and
language. The test is divided into two sections; the first requires verbal responses to
orientation, memory and attention questions. The second requires naming, reading and
a polygon (Folstein, Folstein & McHugh.,1975). A copy of the William Molloy version
of the MMSE is not included in the appendix due to copyright.
The MMSE is scored out of 30 possible points with higher scores indicating
higher functioning. However, there has been considerable discussion over scoring and
cutoff points. The most widely used cutoff is a score of less than 24 (Folstein et al 2001).
Several studies have suggested that different cutoff scores are needed for different
populations, age and education levels (Lopez, Charter, Mostafavi, Nibut, & Smith, 2005).
In a study conducted by Tombaugh and McIntyre (1992), cutoff levels were determined
depending on the severity of the CI: a score of greater than or equal to 24 indicated no
impairment, a score of 18 to 23 indicated mild impairment and a score of less than 17
indicated severe impairment. In a 2001 study by Folstein and colleagues, the following
cutoffs were determined: greater than or equal to 27 is normal, 21 to 26 is mild
impairment, 11 to 20 is moderate impairment and less than or equal to 10 is severe
impairment. Cutoff points were also established depending on educational level because a
single cutoff point may miss cases among more educated people and cause false positives
among those with less education.In a study by Crum et al. (1993) with a sample size of
over 1800 participants, normative data were obtained. MMSE scores were found to be
related both to age and educational level. Across increasing levels of education, the
MMSE score increased and the range of scores narrowed with a median score of 29 for
those 18 to 24 years of age, down to 25 for those 80 years of age and older (Crum et al.,
1993). The median score was 29 for individuals with at least nine years of education, 26
1993). The greatest variability was seen in the lowest educational groups and the oldest
ages. In a similar study by Grigoletto and colleagues (1999) scores were inversely
proportional to age and increased with increasing level of education. When scoring the
test, it is important to use normative data to locate an individual patient’s MMSE score
within the percentile distribution shown for that patient’s age and educational level,
which in turn provides a method of comparison that takes into account age and education
(Crum et al., 1993).
To distinguish between the effects of dementia and the influences of age and
education on MMSE score, Monsch and colleagues (1995) studied a group of healthy
older adults and found a significant influence of both age and education on MMSE scores
(p=0.006). They also investigated the validity of the MMSE in a clinical setting (n=120,
50 healthy controls and 70 dementia patients). They produced a ROC curve and
determined that a cutoff score of less than 26/30 generated a maximum sensitivity and
specificity of 74% and 98% respectively. A second ROC curve was created with scores
adjusted for age and education and resulted in a similar optimal cutoff score of less than
26/30 with a sensitivity of 74% and a specificity of 100% (Monsch et al., 1995); positive
predictive value was 100% and negative predictive value 79% (Monsch et al., 1995).
Spering and colleagues (2012) attempted to validate the MMSE in a group of
ethnically diverse, highly educated individuals. They determined that in this sample, a
cutoff score of 27 provided better estimates of diagnostic accuracy than the original
specificity of 58% and 98% respectively. A cutoff score of 27 resulted in a sensitivity
and specificity of 79% and 90% respectively (Spering et al., 2012). O’Bryant and
colleagues (2008) found similar results in a sample of predominantly white individuals.
Therefore there was an improvement in diagnostic accuracy with higher cutoff scores in a
sample of ethnically diverse participants with high levels of education (16 or more years)
(Spering et al., 2012). Interestingly, this study also found that the sensitivity and
specificity varied between ethnic groups. This study provides a range of cutoff scores for
different ethnic and linguistic groups so that appropriate cutoff scores can be used for a
given setting (Spering et al., 2012)
A meta-analysis by Mitchell (2009) of 34 studies examined the diagnostic
accuracy of the MMSE in distinguishing between individuals with dementia and healthy
subjects, mild cognitive impairment (MCI) versus healthy subjects and dementia versus
MCI. They found that the MMSE was best at confirming suspected diagnosis in
specialist settings and was modestly effective at ruling out dementia in these settings. In
non-clinical settings, the MMSE was most effective at ruling out dementia.
The MMSE has known limitations. As previously mentioned, the ideal cut-off
varies according to age and education as 12% of the variance in MMSE scores can be due
to age and education alone (Mitchell, 2009). Even after adjustment, the accuracy is lower
in those with less education (Mitchell, 2009). Many older adults have chronic conditions
and disabilities such as arthritis or motor impairments that may affect their ability to
floor or holding a pencil to complete a sentence or to draw a figure (Pangman, Sloan, &
Guse, 2000). There is a floor effect in patients with advanced dementia, and in those with
little education or in non-English speaking groups, and a ceiling effect for those with
mild disease, no disease and for those with high cognitive functioning or high education
(Mitchell, 2009). Other disadvantages of the MMSE include difficulty identifying MCI
and difficulty in recording change in cases of severe dementia. Furthermore, age,
education, cultural and socioeconomic background can cause a considerable bias in the
MMSE scores (Harefuah, 2006).
Although the MMSE is the most widely used screening tool for cognitive CI
many difficulties in detecting change in cognition have been reported, the greatest being
the lack of sensitivity in identifying small changes in CI. Individuals who meet the
criteria for MCI can score in the normal range on the MMSE demonstrating that it cannot
accurately distinguish MCI from normal (Nasreddine et al., 2005). The MMSE has been
shown to be insensitive to conditions associated with frontal-executive and subcortical
dysfunction and to milder forms of cognitive impairment (Pendlebury, Cuthbertson,
2.3 The Montreal Cognitive Assessment (MoCA)
The Montreal Cognitive Assessment (MoCA), a screening tool developed by
Nasreddine and colleagues (2005) was designed to be used by clinicians in the detection
of CI. It was developed to screen patients who present with cognitive complaints but still
perform in the normal range on the MMSE. The MoCA has been shown to be useful for
the detection of mild stages of CI while the MMSE has been shown to be superior for
more advanced stages of cognitive impairment (Nasreddine et al., 2005). The tasks tested
in the MoCA are more similar to those seen in a typical neuropsychological testing
battery when compared with those included in the MMSE (Waldron-Perrine & Axelrod,
2012).
The MoCA, like the MMSE takes approximately 10 minutes to complete, has a
total of 30 possible points and takes 1 minute to score. The test is divided into eight
domains: visuospacial/executive function, naming, memory, attention, language,
abstraction and orientation. Visuospacial abilities are assessed using a clock drawing task
and copying a three dimensional cube. Executive functions are assessed using an
alternation task drawing a line from a number to a letter in ascending order. Naming is
assessed using three animals (lion, camel, rhinoceros). By repeating a list of digits in
forward and backwards order, a target detection task, as well as a serial subtraction task,
attention abilities are evaluated. Language is assessed through repetition of two
similarity task. Lastly, orientation to time and place is evaluated. A copy of the MoCA
can be found in Appendix A.
Nasreddine and colleagues (2005) conducted a validation study for the MoCA in a
community and an academic centre setting. Ninety-four patients met the clinical criteria
for MCI, 93 had mild Alzheimer Disease and 90 were healthy elderly controls. Clinical
diagnosis was made using neuropsychological evaluation as the gold standard. Both the
MoCA and the MMSE were administered to all participants. Using a cutoff score of 26, a
mean educational level of 13 years and a one-point educational correction for those with
less than or equal to 12 years of education, the MMSE had a sensitivity of 18% in
detecting MCI whereas the MoCA detected 90% of MCI participants (Nasreddine et al.,
2005). In the group with mild Alzheimer Disease, sensitivity was 78% and 100% for the
MMSE and the MoCA respectively (Nasreddine et al., 2005) while the specificity for
both tools was excellent at 100% for the MMSE and 87% for the MoCA. The MoCA
places more emphasis on tasks of frontal executive functioning and attention than the
MMSE, which may make it more sensitive in detecting CI (Smith, Gildeh, & Holmes,
2007).
The differences between groups, (MCI, Alzheimer Disease and healthy older
adults) were much more pronounced using the MoCA than the MMSE. The mean score
of the MCI participants fell within the normal range on the MMSE but in the abnormal
range on the MoCA (Nasreddine et al., 2005). The majority of the MCI participants and
some mild Alzheimer participants had MMSE scores in the normal range. However, few
(Nasreddine et al., 2005). Seventy-three percent of MCI participants scored in the
abnormal range on the MoCA but in the normal range on the MMSE (Nasreddine et al.,
2005).
In a similar study conducted by Smith and colleagues (2007), MoCA was
prospectively validated in a memory clinic in the United Kingdom with a sample of 26
patients. MoCA had superior sensitivity than the MMSE in identifying MCI and
dementia but specificity was only 50%. However, the results of this study sample may
not be generalizable to a larger population because the study took place in a memory
clinic where CI would be expected to be very common. Other limitations include a small
sample size and a short follow up period of 6 months. In a recent study, Larner (2012)
assessed the MoCA compared with the MMSE in a memory clinic setting. Standard
clinical diagnostic criteria (DSM-IV) were used to diagnose dementia and MCI. The
MoCA was found to be more sensitive than the MMSE, 97% vs. 65% respectively but
less specific, 60% vs. 89% respectively (Larner, 2012). The MoCA had better diagnostic
accuracy than the MMSE with an area under the curve of 0.91 versus 0.83 (Larner,
2012).
Paul and colleagues (2011) examined the relationships between MoCA scores and
regional brain volumes determined by Magnetic Resonance Imaging (MRI) in 111 older
adults (ages 51-85) who were enrolled in a study on cognitive aging. A subset of 69
participants underwent MRI. Modest (r= 0.27) correlations were found between
frontal gray matter, total hippocampus, weighted subcortical hyperintensities and total
brain volume (Paul et al., 2011). The total MoCA score did not significantly correlate
with any of the neuroimaging measures but a trend was seen between total MoCA score
and total subcortical hyperintensities (r= -0.26) (Paul et al., 2011). Total MMSE scores
did not significantly correlate with any of the neuroimaging indices (Paul et al., 2011).
However, individual domain scores on the MoCA correlated with many of the
neuroimaging indices. Larger brain volume significantly correlated with better
performance on the visuospacial/executive, attention and learning domains (Paul et al.,
2011).
In a recent study by Rossetti et al. 2011, normative MoCA data was stratified by
age and education in a large (n=2653), ethically diverse population-based sample. As
expected, they found that participants with more education had higher MoCA scores.
MoCA scores decreased only slightly with age among those with greater than 12 years of
education and more so in those with less education (Rossetti, Lacritz, Cullum, & Weiner,
2011). Even with the one point education increase, the majority of the participants scored
below the cutoff of less than 26, indicating that this cutoff and the one point increase may
not be appropriate (Rossetti et al., 2011). High failure rates were seen on certain items
such as drawing a cube, delayed free recall, sentence repetition, placement of clock
hands, abstraction and verbal fluency. In addition, overall mean total scores were lower
than previously published normative data would suggest (mean= 23.36, SD= 3.99)
(Rossetti et al., 2011). This suggests that caution is required when interpreting MoCA
Using the MoCA to determine whether a patient is cognitively impaired requires that
scores should be evaluated in comparison to other individuals of a similar background as
opposed to a defined cutoff score (not unlike the MMSE) (Waldron-Perrine & Axelrod,
2012).
Given that it is still unclear whether the published cutoff score of 26 is appropriate
across populations, Waldron-Perrine and Axelrod (2012), attempted to determine optimal
cutoff scores on the MoCA compared with a neurological battery (including the MMSE)
administered by a psychologist. Subjects included 185 veterans (95% male) at an
urban-based Veteran’s Affairs hospital on the basis of referral from their physician (referrals
included mental health, neurology and in-house extended care facility (van Gorp et al.,
1999). The MoCA demonstrated adequate sensitivity, specificity and overall
classification rates in predicting impairment compared to all neuropsychological testing
variables. However, the optimal cutoff score to detect impairment was less than or equal
to 20 which is considerably lower than the published cutoff score of 26.
Freitas and colleagues (2012) analyzed the influence of sociodemographic factors
(age, sex, educational level, marital and employment status, geographic region) and
health variables (subjective memory complaints by the participant and evaluated memory
complaints, depressive symptoms and family history of dementia) on the participants’
MoCA scores. This study was conducted in a community-based sample of volunteers
who were recruited at national health and social security services in all geographic
found that age and educational level significantly influenced the MoCA score, accounting
for 49% of the variance (Freitas et al., 2012). In this study, gender, marital and
employment status as well as whether individuals lived in urban or rural areas had no
effect on the MoCA scores. Similar results were found regarding health variables on
MoCA scores. There was no significant association between family history of dementia
or memory complaints on MoCA score (Freitas et al., 2012). However, depressive
symptoms and subjective memory complaints of the participant had significant negative
correlations with the MoCA scores and these variables also showed a significant
intercorrelation (Freitas et al., 2012).
2.4 The MoCA versus the MMSE in Stroke Patients
The MMSE and the MoCA have been compared in several studies identifying
cognitive deficits in patients with Parkinson’s disease (Dalrymple-Alford et al., 2010;
Hoops et al., 2009; Zadikoff et al., 2008), cerebral small vessel disease (Wong et al.,
2009), as well as cardiovascular disease (McLennan, Mathias, Brennan, & Stewart,
2011), where the MoCA was found to be a more sensitive tool in detecting cognitive
impairment compared to the MMSE. The MMSE has been criticized as being an
insufficient screening test for patients with vascular cognitive impairment because of its
lack of sensitivity to visuospatial and executive function deficits (Ihara, Okamoto, &
Takahashi, 2012). However, few studies have been performed that assess the validity of
the MoCA and the MMSE in stroke patient populations; none have utilized a stroke
Pendlebury and colleagues (2010) compared the MoCA and the MMSE in a
population-based study of transient ischemic attack (TIA) and stroke patients (n = 413).
The MoCA identified substantially more cognitive deficits than the MMSE in these
patients (Pendlebury et al., 2010). Using a cutoff score of ≥ 27, 58% of patients with a
normal MMSE had an abnormal MoCA. The MoCA differentiated well between different
levels of cognitive ability, whereas over half the patients with MMSE scores ≥ 27 were
designated as cognitively impaired using the MoCA. This echoes the findings of the
original MoCA study by Nasreddine and colleagues (2005). However, a major limitation
in this study was that sensitivity and specificity for these screening tools could not be
determined because of the lack of a gold standard. Dong and colleagues (2010), tested
whether the MoCA was more sensitive than the MMSE for detecting CI in a population
of 100 sub-acute stroke patients in Singapore. They also reported the MoCA to be more
sensitive than the MMSE in screening for CI in this population; however, there was no
gold standard. In addition, three Singapore versions of the MoCA were used with
modifications that had not been validated (Dong et al., 2010). Blake and colleagues
(2002), screened 112 stroke patients recruited from a previous randomized control trial
for CI on the MMSE and a variety of other screening tools (not including the MoCA).
Overall, the MMSE was determined to not be a useful screening tool in detecting CI
using the cutoff point of <24 with 88% specificity and 62% sensitivity (Blake,
McKinney, Treece, Lee, & Lincoln, 2002).
In a sample of 95 stroke patients, Godefroy and colleagues (2011) assessed the
neuropsychological battery as the gold standard. Using the published cutoff score of 26,
the MoCA demonstrated high sensitivity (0.94) but low specificity (0.42) when compared
to the gold standard. The inverse was found for the MMSE with a sensitivity of 0.66 and
a specificity of 0.97 (Godefroy et al., 2011). The areas under the curve for both the
MoCA and the MMSE were greater than 0.88 suggesting that both tests had a similar
ability to detect post-stroke cognitive impairment (Godefroy et al., 2011). Age and
education adjusted test scores were also computed. The adjusted MMSE and MoCA
scores were less than or equal to 24 and less than or equal to 20 (much lower than the
published cutoff score) respectively. For the MMSE, the adjusted sensitivity was 0.7 and
the adjusted specificity was 0.97. The adjusted MoCA scores had a sensitivity and
specificity of 66% and 90% respectively (Godefroy et al., 2011). These results differed
from those of previous studies, as the MoCA proved to be no more sensitive than the
MMSE when screening for cognitive impairment when adjusted cutoff scores were used.
This was unanticipated as MoCA better tests executive function and psychomotor speed,
which are frequently impaired in patients with stroke (Godefroy et al., 2011).
A recent study by Pendlebury and colleagues (2012) suggests that the MoCA
cutoff of less than 26 for MCI is derived from a memory clinic population and may not
be entirely appropriate for use with individuals who have suffered a stroke or have
evidence of cerebrovascular disease. The authors examined the relation between the
MoCA, the MMSE and another test, the Addenbrooke’s Cognitive Examination-Revised
(ACER-R) at one or more years after a transient ischemic attack or stroke, for the
recommended in the National Institute of Neurological Disorders and Stroke- Canadian
Stroke Network Vascular Cognitive Impairment Harmonization Standards working
group. They found no difference in age, education level and sex distribution between
patients with stroke or TIA; however, when compared to those with TIA, the stroke
patients had lower mean MMSE, MoCA, ACE-R and memory scores (Pendlebury,
Mariz, Bull, Mehta, & Rothwell, 2012a). Furthermore, out of 91 stroke and TIA
participants who completed the battery, 42% had MCI (Pendlebury, Mariz, Bull, Mehta,
& Rothwell, 2012a). Sensitivity (77%) and specificity (83%) for MCI were optimal with
a MoCA cutoff score of less than 25 with a positive and negative predictive value of 0.64
and 0.87 respectively (Pendlebury, Mariz, Bull, Mehta, & Rothwell, 2012b). The
sensitivity and specificity for the MMSE were 77% and 81% respectively with a positive
predictive value of 0.75 and a negative predictive value of 0.82; however, these optimal
values where reached with a cutoff score of less than 29 (Pendlebury, Mariz, Bull, Mehta,
& Rothwell, 2012b).
Toglia and colleagues (2011) compared the ability of the MoCA and the MMSE
to classify stroke patients as cognitively impaired on an acute inpatient rehabilitation unit.
Using a cutoff score of 27 (higher than the published cutoff by Folstein) on the MMSE
and 26 on the MoCA, the MoCA classified more patients as cognitively impaired than the
MMSE, 89% verses 63% respectively (Toglia et al., 2011). The sensitivity and specificity
of these tools were not determined. These authors also examined the relationship between
each test and discharge functional status. Functional status was measured using the motor
(mRFE) scores. Results indicate that the MoCA was marginally more strongly associated
with discharge functional status than the MMSE (r=0.4; P< 0.01 and r=0.3; P>0.05
respectively) (Toglia et al 2011). In addition, the MoCA visuoexecutive sub-score was
the strongest predictor of functional status (Toglia et al 2011).
In a similar study, Schweizer and colleagues (2012) examined how MoCA and
MMSE scores related to cognitive impairment against several other neurocognitive tests
and their association with the ability to return to work in a population of aneurysmal
subarachnoid hemorrhage patients (n=32). They found that 42% of the patients were
impaired on the MoCA and none were impaired on the MMSE. The MMSE failed to
detect cognitive impairment in any domain (Schweizer, Al-Khindi, & Macdonald, 2012).
The MoCA, unlike the MMSE, correlated with neurocognitive test performance,
suggesting that the MoCA can be used as a proxy for neurocognitive assessment if the
latter is not feasible (Schweizer et al., 2012). Superior performance on the animal naming
and abstraction subtests of the MoCA score were associated with return to work
following an aneurysmal subarachnoid hemorrhage; however, more research is needed to
address this issue (Schweizer et al., 2012).
2.5 The Cognistat
Cognitive status examinations usually provide a global score, and to be useful at
the bedside they are brief, have a structured format and they originate from traditional
mental status examinations (Kiernan, Mueller, Langston, & Van Dyke, 1987). However,
reliance on a global score may not be accurate. In contrast, there are long batteries of
cognitive testing that require several hours to administer, are tiring for the patients, are
impractical for routine use at the bedside and are expensive (Kiernan et al., 1987). The
Cognistat, previously known as the Neurobehavioural Cognitive Status Examination
developed by Kiernan and colleagues (1987), independently assesses multiple domains of
cognitive functioning and thereby provides a differentiated profile of the patient’s
cognitive status. The scoring system was designed so that successful performance in
several cognitive domains does not obscure deficits in others (Macaulay, Battista, Lebby,
& Mueller, 2003). This tool takes approximately 20- 40 minutes to complete depending
on the level of impairment and takes about 2 minutes for the administrator to score.
The Cognistat begins with an assessment of consciousness to determine if the
patient is alert or impaired as this can affect test performance (Kiernan et al., 1987).
Level of consciousness is rated by observation. The Cognistat then assesses cognition
using independent tests to evaluate seven major cognitive ability areas: orientation,
attention, language (fluency, comprehension, repetition and naming), construction,
memory, calculation and reasoning (similarities and judgment). There are a total of 10
independent scores.
The Cognistat follows a ‘screen and metric’ approach. With the exception of the
memory and orientation tests, the tests all begin with a screen item that is more difficult
and if the patient passes the screen then the skill is considered intact and no further
testing of that skill is required (Kiernan et al., 1987). If the patient fails the screen, then
(Kiernan et al., 1987). A copy of the Cognistat is not included in the appendix due to
copyright.
The screen for the attention domain is to repeat a six digit sequence and the metric
is to repeat digit sequences that increase in difficulty. Language is assessed in four areas;
fluency, comprehension, repetition and naming. Fluency is assessed by showing the
patient a picture of a fishing scene and recording the patient’s description. No points are
given for this section, and it is evaluated qualitatively with attention to word finding
difficulties (Kiernan et al., 1987). In the screen for the attention domain, the patient
follows a three-step command, and if they fail, they are asked to follow a series of
commands. To test repetition, the patient is asked to repeat a complex sentence for the
screen and if they fail they must repeat a series of phrases that are increasingly difficult
for the metric. To assess the construction domain, the patient is asked to draw two
figures from memory after a 10 second study period. If they fail this task, the patient is
given the metric which requires the construction of 3 mosaic patterns using 4 tiles out of
8. To test memory, the patient is asked at the beginning of the test to repeat and
remember four words that they will need to know later on in the examination.
Approximately 10- 15 minutes later, after an interference task consisting of the language
and construction domains, the patients is asked to recall the four words. Next, the screen
for the calculation domain is assessed by asking the patient to multiply 5 by 13. If failed,
the metric involves four simpler arithmetic questions involving addition, subtraction and
division. The reasoning domain is divided into similarity tasks and judgment tasks. To
painting and music. If the patient fails this screen, they are then presented with four more
word pairs in which the similarity is progressively more difficult to identify (Kiernan et
al., 1987). To assess judgment, the patient is asked questions in the form of “What would
you do if…” The patient is asked one scenario for the screen and if they fail, they are
asked three additional questions for the metric.
The creators of the Cognistat collected normative data on 60 subjects who were
volunteers from their medical centers. They were divided into two groups: young (n=30,
ages 20 to 39) and old (n=30, ages 40 to 66). There was very little variability among
these subjects on any of the domains and no significant difference was found between the
two age groups (Kiernan et al., 1987). They also provide standardization data for geriatric
(n=59, ages 70 to 92) and neurosurgical patient (n=30, mean age 54.2 years) populations.
The geriatric sample were volunteers who had no history of medical or psychiatric
conditions and had not received any psychiatric drugs (Kiernan et al., 1987). The mean
test scores fell within the normal range established by the young and old groups,
however, the mean scores in construction, memory and similarities were significantly
lower thereby resulting in a broader range of normal functioning in the geriatric
population (Kiernan et al., 1987). The neurosurgical patients had brain lesions (for
example stroke, brain tumor, etc.) and their scores were all significantly lower than those
of the geriatric group except for the judgment section (Kiernan et al., 1987).
Kiernan and colleagues (1987) address a few issues of reliability and validity with
does not discriminate average from superior performance, the range of scores within the
normal healthy population is very small (Kiernan et al., 1987). Healthy subjects perform
almost perfectly on all domains and, because of this ceiling effect, test-retest studies in
normal populations would not be relevant (Kiernan et al., 1987). Kiernan and colleagues
(1987) suggested a split-half reliability study; however; this is also not practical as the
Cognistat has too few items.
In a validation study, Drane and Osato (1997) examined the ability of the
Cognistat to accurately distinguish between healthy elderly residents in a retirement
center and patients with dementia in a nursing home. The nursing home patients were
diagnosed with dementia as defined by DSM-III-R criteria. The Cognistat demonstrated
100% sensitivity by identifying cognitive impairment in all of the patients diagnosed with
dementia but the specificity was only 30% therefore there was a high rate (70%) of false
positives among the healthy controls (Drane & Osato, 1997). However, the sample size
was very small (n=20). Drane and Osato (199) found that the largest group differences
were between the memory and construction domains. It was explained that by expanding
the normal range for elderly adults the specificity of the Cognistat would improve (Drane
& Osato, 1997; Macaulay et al., 2003). It was also noted that a possible reason for the
differences in the memory score may be due to the screen and metric approach as this
procedure leads to variations in the duration of the overall stimulus retention interval
(Drane & Osato, 1997). Those who successfully completed the screen had shorter
Macaulay and colleagues (2003) established age-corrected norms for the older
adult population (age 60 to 85). There were 123 participants who were recruited from
several organizations such as senior centers, retirement groups and low income and
elderly housing. Comparisons of test performance across several age groups (60-64,
65-69, 70- 74, 75-79 and 80-84) were made. The results suggested the need for age specific
profiles. Results show a different pattern of change for memory functioning across age
groups (Macaulay et al., 2003). They suggest an extension of the normal range of
functioning on the memory domain for individuals in the 65-69 and 70-74 year- old age
groups and a further extension for those in the 75-79 and 80 84 year-old age groups
(Macaulay et al., 2003). Harris and colleagues (1990) in an earlier study found similar
results. Results from this study supported extending the normal range for normal healthy
people over the age of 65 on the construction, memory and reasoning domains however,
the sample size was very small (Harris et al., 1990).
Nokleby and colleagues (2008) assessed the concurrent validity of three screening
tests; the Cognistat, the Screening Instrument for Neuropsychological Impairments in
Stroke (SINS) and the Clock drawing test in 49 stroke patients in a stroke rehabilitation
setting. The Norwegian standard battery of neuropsychological assessment was used as
the gold standard. Sensitivity in detecting deficits in any domain was 82% for the
Cognistat composite score, 71% for the SINS composite score and 63% for the Clock
Drawing Test (Nokleby et al, 2008). The Cognistat memory subtest performed best as an
indicator of memory problems. For the detection of any cognitive deficit, the Cognistat
composite Cognistat language score, comprising the results of the comprehension,
repetition and naming subtests. The composite score performed better than the three
language subtests alone with an AUC of 82% (Nokleby et al, 2008).
A study by Schwamm and colleagues (1987) was designed to determined whether
the Cognistat was a more sensitive tool in the detection of cognitive impairment when
compared with the MMSE in 30 patients with documented brain lesions. The Cognistat
proved to be more sensitive than the MMSE; the MMSE had a false negative rate of 43%
versus the Cognistat with a false negative rate of 7%. In another study by Van Gorp and
colleagues (1999), the sensitivity and specificity of the MMSE, the Mattis Dementia
Rating Scale (MDRS) and the Cognistat were compared in a sample of Alzheimer’s
disease patients (n=22), vascular dementia patients (n=19) as well as normal healthy
elderly individuals (n=12). Subjects with Alzheimer’s disease met criteria as defined by
the National Institute of Neurological and Communication Disorders. Patients with
vascular dementia met DSM-III-R criteria. With the published cutoff score of 23, the
MMSE had a sensitivity of 71%, 100% specificity and an overall accuracy of 77% (van
Gorp et al., 1999). However, with a cutoff score of 26 the overall accuracy increased to
98% and sensitivity also increased to 98% and the specificity remained at 100% (van
Gorp et al., 1999). The sensitivity of the Cognistat ranged from 33% in the attention
subtest to 88% in the memory subtest (van Gorp et al., 1999). The memory subtest was
the only subtest that had less than 100 specificity (83%) (van Gorp et al., 1999). The
memory and construction subtests resulted in the highest accuracy (86% and 80%
Cognistat manual presents different profiles for patients with Alzheimer’s disease and for
those with vascular dementia, van Gorp and colleagues (1999) compared the mean profile
configuration of the Cognistat subscales for these two patient groups. Both 100% of the
controls and 100% of the dementia patients were successfully classified as impaired or
unimpaired (van Gorp et al., 1999). However, within the dementia groups the Cognistat
subtest scores correctly classified 67% of the Alzheimer’s disease subjects and 75% of
the vascular dementia subjects (van Gorp et al., 1999). Therefore, the Cognistat subtest
score pattern did not differentiate between Alzheimer’s disease and vascular dementia.
Mysiw and colleagues (1989) administered the Cognistat and the MMSE to 38
stroke patients before inpatient rehabilitation to determine the extent to which the scores
predict rehabilitation outcome. Results demonstrated that the Cognistat was a more
sensitive indicator of impairment than the other tool especially in the orientation and
memory subtests (Mysiw et al., 1989). Toedter and colleagues (1995) conducted a study
to determine whether reliable responses to standardized psychological measures
including the Cognistat could be obtained in a group of 106 stroke patients in a
rehabilitation hospital. Interestingly, the results demonstrated that the Cognistat was
predictive for those stroke rehabilitation patients who had very low likelihood of being
able to respond consistently and failed to identify those who would respond in a reliable
manner (Toedter et al., 1995).
The Cognistat was chosen as the “gold standard” for the present study for a
multiple domains of cognitive functioning, providing a differentiated profile of the
patient’s cognitive status like a neuropsychological battery. However, the batteries are
long and tiring and require a neuropsychological specialist to administer, which can also
be costly. For these practical reasons, the Cognistat was used in place of a truly
definitive ‘gold standard’, to provide a standardized criterion for the comparative
evaluation of the MMSE and MoCA.
Several studies have compared the Cognistat to the definitive gold standard for
cognitive impairment, the neuropsychological battery. Karzmark (1997) examined the
validity of the Cognistat using a comprehensive neuropsychological assessment as the
gold standard in a sample of 50 outpatient referrals to the neuropsychological assessment
service of a general medical hospital. The sensitivity and specificity of the Cognistat was
74% and 86% respectively (Karzmar, 1997). However, the sensitivity of the individual
subtests ranged from 20% to 48% and the specificity of the individual subtests ranged
from 64% to 97% respectively (Karzmar, 1997). This suggests that the results of the
Cognistat depend highly on the severity and the nature of the sample assessed and the
criterion used (Karzmar, 1997). In summary, a review of literature found the Cognistat
has demonstrated to be a highly sensitive tool; however, its validity has yet to be tested in
Chapter 3
Objectives and Hypothesis
General Objective
To evaluate two screening tools for cognitive impairment in stroke patients in a
rehabilitation setting.
Specific Objective
To conduct a validation study of the MMSE and the MoCA using the Cognistat as the
criterion or ‘gold standard’.
Hypothesis
It is hypothesized that the MoCA is a superior screening instrument to the MMSE for the
detection of cognitive impairment in stroke patients. The rational for the hypothesis stems
from a review of literature. The MoCA has been demonstrated to be a more effective tool
in the detection of cognitive impairment compared to the MMSE in several populations
including those with Parkinson’s disease, cerebral small vessel disease, cardiovascular
Chapter 4
Methods
Ethics Approval: This study was approved by The University of Western Ontario Health
Sciences Research Ethics Board. Please see Appendix D for approval certificate.
Initial REB approval was granted from August 24, 2011 to October 31, 2011. An
extension was requested, and approved effective November 29, 2011. Some patients
were recruited between October 31 and November 29 according to the originally
approved protocol. The REB was subsequently informed of this issue.
4.1 Subjects
Initial Eligibility Criteria: Individuals admitted to the stroke rehabilitation inpatient unit at Parkwood Hospital, London, Ontario, between August 2011 and March 2012 who
were between 18 and 97 years of age. Patients admitted to the stroke rehabilitation unit as
a rule must have experienced a recent stroke with subsequent disability, be able to learn,
have definable rehabilitation goals and be able to participate physically in the
rehabilitation program.
Exclusion Criteria: Individuals who were aphasic, dysphasic, or who had severe visual or
hearing limitations were excluded from the study as the scores on each of the tests may
be affected. These limitations were initially screened for by the physicians obtaining
consent. If this was missed, the occupational therapists assigned to the patient informed
the student investigator of the patient’s condition. Patients who were unable to speak or
4.2 Sample Size
The sample size of 88 was calculated using the statistical program G* Power
3.1.2. A Chi-Square Goodness of Fit test was performed with 1 degree of freedom.
Cohen’s (1992) medium effect size of 0.3 was used and it is defined as an effect size that
represents an effect likely to be visible to the naked eye of an observer. Therefore for
clinical use, this is the value at which we will detect a difference. Cohen’s effect sizes are
widely used.
4.3 Recruitment
Dr. Robert Teasell or Dr. John Clement, members of the patient’s health care
team, first contacted the potential participants (all patients who met inclusion and
exclusion criteria) to recruit them. The patients then received a Letter of Information and
a Consent Form (Please see Appendix C). The study began once the patients were fully
informed about the study and consent was obtained.
4.4 Measures
The measures used in the present study were reviewed in Chapter 2. Some of the
following material repeats those earlier descriptions.
The MMSE
The MMSE is easily administered and requires 5- 10 minutes to complete depending on
the impairment of the individual. The MMSE includes 30 items grouped into 5
categories: orientation, registration, attention and calculation, recall and language. The
and attention questions. The second requires naming, reading and writing and the ability
follow verbal and written commands, write a sentence and copy a polygon (Folstein &
Folstein, 1975). The MMSE is scored out of 30 possible points and all points can be
summed up quickly by the administrator. The score places the patient on a scale of
cognitive function.
The MoCA
The MoCA, like the MMSE takes approximately 10 minutes to complete, has a total of
30 possible points and takes 1 minute to score. The test is divided into eight domains:
visuospatial/executive function, naming, memory, attention, language, abstraction,
delayed recall and orientation. Visuospatial abilities are assessed using a clock drawing
task and to copy a three dimensional cube. Executive functions are assessed using an
alternation task drawing a line from a number to a letter in ascending order. Naming is
assessed using three very common animals (lion, camel, rhinoceros). By repeating a list
of digits in forward and backwards order, a target detection task, as well as a serial
subtraction task, attention abilities are evaluated. Language is assessed via repetition of
two syntactically complex sentences and a fluency task. Abstraction is evaluated using a
similarity task. Lastly, orientation to time and place is evaluated.
The Cognistat
The Cognistat, previously known as the Neurobehavioural Cognitive Status Examination,
begins with an assessment of consciousness, attention and orientation. Then, it assesses
cognition using independent tests to evaluate five major cognitive ability areas: language,
construction, memory, calculation and reasoning (Kiernan et al., 1987). With the
is more difficult. If the patient passes the screen then the skill is considered intact and no
further testing of that skill is required (Kiernan et al., 1987). If the patient fails the screen,
then the metric is administered which consists of a series of questions of graded difficulty
(Kiernan et al., 1987). An important advantage of the Cognistat is that it independently
assesses multiple domains of cognitive functioning and thereby provides the clinician
with a differentiated profile of the patient’s cognitive status (Kiernan et al., 1987). This
tool takes approximately 20- 40 minutes to complete depending on the level of
impairment and takes about 2 minutes for the administrator to score.
4.5 Data Collection
MoCA and MMSE
For each patient, an occupational therapist administered both the MoCA and the
MMSE consecutively. The occupational therapists recorded which of the two tests they
administered in order to ensure that they were administering them in alternating order
across patients. These screening tools were administered by the occupational therapist
that was assigned to the patient during their therapeutic stay in the stroke rehabilitation
unit. Published cutoff scores of 24 and 26 were used to establish cognitive impairment
with the MMSE and the MoCA respectively. The screening tools took approximately 10
minutes each to complete.
Cognistat
The Cognistat was then administered by the student investigator as soon after the
sub-study was conducted in order to ensure the reliability of the test administration by the
student investigator. Two of the occupational therapists administered the Cognistat in
addition to the student investigator on 20 patients. For half of the patients the student
investigator administered the Cognistat first and for the second half the occupational
therapists administered it first. The patients were aware of the additional testing which
was explained in the Letter of Information. The second Cognistat was performed within
the same week as the first. The screen and metric approach was not used in this study
(this will be discussed in Chapter 6- Discussion). A patient was deemed cognitively
impaired if they scored in the impaired region in one or more domains on the Cognistat.
A Cognistat composite score out of 82 possible points was also calculated by summing
the scores of each individual domain. The Cognistat took an additional 20 minutes to
complete although the timing varied depending on the patient’s level of impairment.
As the student investigator was not a trained clinician, she initially observed the
occupational therapists administer the Cognistat on several patients. Once she felt
comfortable, the student investigator administered the tool under the supervision of an
occupational therapist. The occupational therapist then decided when she was prepared
for test administration.
After the student investigator received the original copy of the first two Cognistats
from the reliability sub-study administered by the occupational therapists, she noticed
that some of the scoring did not follow the precise instructions from the Cognistat
therapists and went through the instruction manual and scoring for each domain on the
Cognistat so that the test would be scored as accurately as possible.
Each test was administered in a private quiet room on the stroke rehabilitation
unit to ensure that there were no distractions for the patient as well as to provide a
comfortable testing environment. During testing, if the patient required, they were
permitted to take a break before beginning the next test. Once all three tests were
administered, the student investigator asked the patients their level of completed
education. The side and location of the stroke as well as medication history was obtained
through chart review and was recorded given that these factors had potential to explain
some of the patient variance in performing the tests. Data input was in Microsoft Office
Excel 2003 and data analysis was conducted using SPSS 20.0 (IBM Corporation, 2011)
and SISA (Uitenbroek, 1997), an on-line software program.
4.6 Statistical Measures
The following statistical measures were calculated using SISA at
http://www.quantitativeskills.com/sisa/statistics/diagnos.htm. Please refer to Figure 1
for the labeling of cells from the 2 x 2 table.
Sensitivity - ‘the probability of correctly diagnosing a diseased person (case) or the probability that any given case will be identified by the test’ (Porta, 2008) (p.227).
Sensitivity = a / a + c
Positive Predictive Value (PPV) - ‘the probability that a person with a positive test result is a true positive (does have the disease)’ (Porta, 2008) (p.191). PPV= a / a + b
Negative Predictive Value (NPV) - ‘the probability that a person with a negative test result is a true negative (does not have the disease)’ (Porta, 2008) (p.191). NPV= d / c + d
Positive Likelihood Ratio – ‘For a positive result, the likelihood ratio equals the ratio sensitivity/(1 – specificity)’ (Porta, 2008) (p.145). It is ‘the ratio of the proportion of
diseased people with a positive test result (sensitivity) to the proportion of nondiseased
people with a positive result (1 – specificity)’ (Fletcher & Fletcher, 2005) (p.49). As a
ratio statistic, the null value is equal to unity. For example, a test with both a sensitivity
and a specificity of 50% (i.e. a random coin toss) would have an LR of 1.0, whereas an
almost perfect test with both a sensitivity and specificity of 99% would have an LR of 99.
While a negative likelihood ratio can also be calculated for a negative test result, for
brevity in this thesis the term ‘likelihood ratio’ denotes the positive LR.
95% Confidence Interval – an interval estimate can be calculated to gauge the precision
of each of the above point estimates. For example, for an estimate of sensitivity, the 95%
CI indicates that we can be 95% certain that the true sensitivity of the test in the
population falls within the stated limits.
“True” Condition
Present Absent
+ A B
Test
Result - C D
4.7 Data Analysis
Descriptive Statistics
The database was created in SPSS 20.0 (IBM Corporation, 2011). This statistical
software as well as SISA was used to carry out all data management and the calculation
of descriptive statistics. Minimum, maximum, mean, standard deviation and frequencies
were determined where appropriate for age, education, MMSE and MoCA scores, the
Cognistat composite score and sex. If the patient had greater than 12 years of education
(eg, college, university) they were coded as having 13 years of education. The mean,
minimum and maximum scores on the Cognistat were also determined for the metrics for
all domains. The frequency and percent passes and failures were also determined for all
the screens on the Cognistat.
Validation Study
Cognitive impairment on the MMSE and the MoCA was first determined using
published cutoff scores of 24 and 26 for the MMSE and the MoCA respectively (M. F.
Folstein, Robins, & Helzer, 1983; Nasreddine et al., 2005). Since these published cutoff
scores may not be accurate in stroke patients, additional analyses were performed to
refine the cutoff scores for both tests. Receiver Operator Characteristic (ROC) curves
were generated to examine the ability of the MMSE and the MoCA to discriminate
between impaired verses normal status compared to the gold standard, the Cognistat. A
patient is deemed impaired if the score was in the impaired region in one or more
domains and not impaired if there were no impairments in any domain on the Cognistat.
predictive value were calculated. Optimal cutoff points were determined using the
coordinates of the ROC curve. The optimal cutoff points were those with maximum
sensitivity and specificity. A second ROC curve was generated for the MMSE where the
executive function domains were removed on the Cognistat and participants were
re-evaluated as impaired or not impaired. This was done to provide a better comparison
between the MMSE and the Cognistat as the MMSE does not measure executive
function. This was not done for the MoCA as the MoCA does test executive function.
Additional ROC curves were generated for both the MMSE and the MoCA using the
criterion of two or more impaired domains on the Cognistat being necessary to be deemed cognitively impaired. This was to assure that the original criteria were not too stringent.
Reliability Sub-Study
Inter-rater reliability was calculated between the student investigator and the two
occupational therapists for the Cognistat. The two occupational therapist were made into
one group for the inter-rater reliability calculations. The intraclass correlation coefficient
(ICC) was calculated for all metrics on the Cognistat as they are scored as continuous
variables. The metrics include: orientation, attention, language comprehension, language
repetition, language naming, language total score, construction, memory, calculation,
reasoning similarities, reasoning judgment and total reasoning score. Fluency was not
included as no score is given for the domain as previously mentioned. The ICC for the
Cognistat composite score was also determined. The kappa statistic was determined for
all the screens as they are binary variables (pass and fail). Every domain has a screen