Radar Displays
Peeyush Kaushik
Electronics and Communication Engineering Department , Dronacharya College of Engineering, Gurgaon, India
Abstract:
Radar is an object-detection system that uses radio waves to determine the range, altitude, direction, or speed of objects. Modern radar systems typically use some sort of raster scan display to produce a
map-like image. Early in radar
development, however, numerous
circumstances made such displays difficult to produce. People ultimately developed several different display types. Early radar displays used adapted oscilloscopes with various inputs. Radar systems require an indicator system to display the video information generated. The paper briefly describes various types of displays.
Keywords:
CRT (Cathode Ray Tube); A-Scope, Range Height Indicator (RHI); Plan Position Indicator (PPI); B-Scope; C-Scope
1. INTRODUCTION TO RADAR
The word RADAR is a contraction of Radio Detecting and Ranging. As implied by this contraction, radars are used to detect the presence of an aim and to determine its location. The radar antenna transmits pulses of radio waves or microwaves that bounce off any object in their path. The object returns a tiny part of the wave's energy to antenna that is usually located at the same site as the transmitter. The electronic principle on which radar operates is very similar to the principle of sound-wave reflection. If you know the speed of sound in air, you can then estimate the distance and general direction of the object. The time required for an echo to return can be roughly converted to distance if the speed of sound
is known. Radar uses electromagnetic energy pulses in much the same way. The radio-frequency (RF) energy is transmitted to and reflected from the reflecting object. A small portion of the reflected energy returns to the radar set, called echo. Radar sets use the echo to determine the direction and distance of the reflecting object.
by water vapor, raindrops, or atmospheric gases (especially oxygen) are avoided in designing radars, except when their detection is intended. Radar relies on its own transmissions rather than light from the Sun or the Moon, or from electromagnetic waves emitted by the objects themselves, such as infrared wavelengths (heat). This process of directing artificial radio waves towards objects is called illumination, although radio waves are invisible to the human eye or optical cameras.
2. RADAR DISPLAYS
The information available from a radar receiver may contain as many as several million separate data bits per second. From these and other data, such as the orientation of the antenna, the indicator
should present to the observer a
continuous, easily understandable, graphic picture of the relative position of radar targets. It should provide size, shape, and insofar as possible, indications of the type of targets. A cathode-ray tube (CRT) fulfils these requirements to an astonishing degree. The cathode-ray tube's principal shortcoming is that it cannot present a true
three-dimensional picture. The
fundamental geometrical quantities
involved in radar displays are the RANGE, AZIMUTH ANGLE (or BEARING), and ELEVATION ANGLE. These displays relate the position of a radar target to the origin at the antenna. Most radar displays include one or two of these quantities as coordinate of the crt face. The actual range of a target from the radar, whether on the ground, in the water, or in the air is known as SLANT RANGE. The majority of displays use as one coordinate the value of slant range, its horizontal projection (GROUND RANGE), or its vertical
projection (ALTITUDE). Range is
displayed by means of a linear time-base
sweep, starting from a given point or line at a definite time in each pulse cycle. Thus, distances along this range sweep actually measure slant range. The sweep speed determines the scale factor, which relates the distance on the tube to actual range. The sweep length is the total distance represented. Distances are expressed in miles (statute or nautical) or yards. The origin of the range sweep may be on or off the tube face.
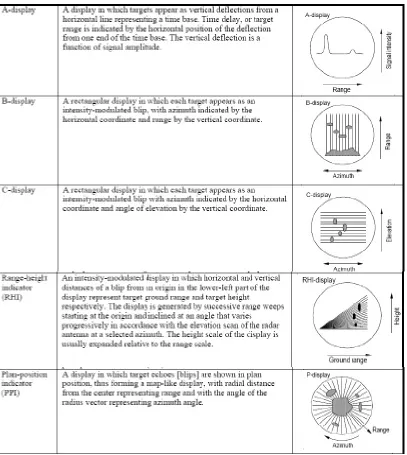
The most common types of displays, called scopes, are the A-scope, the RANGE-HEIGHT INDICATOR (RHI) SCOPE, PLAN POSITION INDICATOR (PPI) SCOPE, B-Scope and C- Scope discussed in the next section.
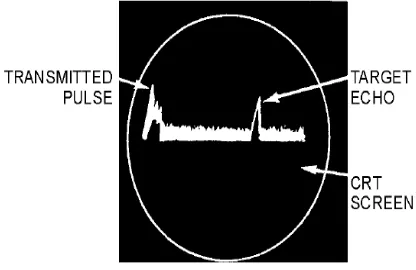
2.1 A-SCOPE
The A-scope display, shown in figure 2.1, presents only the range to the target and the relative strength of the echo. Such a display is normally used in weapons control radar systems. The bearing and elevation angles are presented as dial or digital readouts that correspond to the actual physical position of the antenna.
The A-scope normally uses an
Fig 2.1 A- Scope Radar Display Key Features:
• A sawtooth voltage generator is attached to the X-axis to move the oscilloscope spot across the screen at a fixed speed.
• The start of the "sweep” is triggered to coincide with the start of a radar pulse being sent out of the antenna.
• The speed of the sweep is set to make it reach the far end (typically right side) of the display at the end of the pulse's maximum return time.
• Any reflected signal is amplified and sent directly to the display's Y-axis input, displacing the beam upward.
• A target will appear along the X-axis as a function of time, and corresponds to the distance to the target.
• The magnitude of the deflection along the Y-axis is indicative of the echoing area.
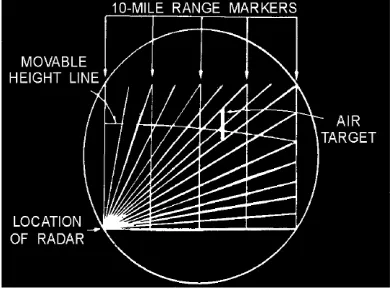
2.2 RANGE HEIGHT INDICATOR (RHI)
The RHI is an intensity-modulated display with height (altitude) as the vertical axis and range as the horizontal axis. This display is often used with height finding
search radars to obtain altitude
information. The sweep originates in the lower left side of the scope. It moves across the scope, to the right, at an angle
that is the same as the angle of transmission of the height-finding radar. The bottom horizontal line indicates the line-of-sight to the horizon. The area directly overhead is straight up the left side of the scope. Target echoes are displayed on the RHI as blips. The operator determines altitude by adjusting a movable height line to the point where it bisects the centre of the blip. Target height is then read directly from an altitude dial or digital readout. Vertical range markers are also provided to estimate target range. The range-height indicator (rhi) scope, shown in figure 2.2,
is a two-dimensional presentation
Fig 2.2 RHI Scope Radar Display
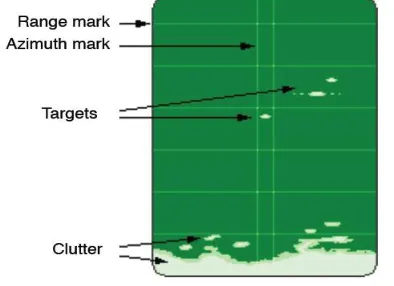
2.3 PLAN POSITION INDICATOR (PPI)
The PPI, also called the P-Scope, is by far the most commonly used radar display. It is an intensity-modulated circular display on which echo signals are shown in plan position with range and azimuth angle displayed in polar coordinates. It is a polar coordinate display of the area surrounding
the radar platform. Own ship is
represented as the origin of the sweep, which is normally located in the center of the scope, but may be offset from the center on some sets. The PPI uses a radial sweep pivoting about the center of the
presentation. This results in a map-like picture of the area covered by the radar beam. A long-persistence screen is used so that the display remains visible until the sweep passes again.The origin of the polar coordinates is at the location of the radar, and is normally located at the center of the display. The PPI uses a radial sweep pivoting around the center. The result is a map-like display of the area covered by the radar beam. Azimuth angle to the target is indicated by the target's angular position in relation to a line extending vertically from the sweep origin to the top of the scope. The top of the scope is usually true north. Figure 2.3 shows the PPI display.
Fig 2.3 PPI Scope Radar Display
Key Features: • The PPI display provides a 2-D "all
• The distance out from the center of the display indicates range, and the angle around the display is the azimuth to the target.
• The current position of the radar antenna is typically indicated by a line extending from the center to the outside of the display, which rotates along with the antenna in real-time.
• It is essentially a B-scope extended to 360 degrees. The PPI display is typically what people think of as a radar display.
2.4 B- SCOPE
A B-scope provides a 2-D "top down" representation of space, with the vertical axis typically representing range and the horizontal axis azimuth (angle). B-scope
displays were common in airborne radars in the 1950s and 60s, which were mechanically scanned from side to side, and sometimes up and down as well. The B-scope's display represented a horizontal "slice" of the airspace on both sides of the aircraft out to the tracking angles of the radar. The spot was swept up the Y-axis in a fashion similar to the A-scope's X-axis, with distances "up" the display indicating greater range. This signal was mixed with a varying voltage being generated by a mechanical device that depended on the current horizontal angle of the antenna. The result was essentially an A-scope whose range line was rotated to point up, and then rotated back and forth about a zero point at the bottom of the display. The radio signal was sent into the intensity channel, producing a bright spot on the display indicating returns.
Fig 2.4 B-Scope Radar Display
Key Features:
• A B-scope provides a 2-D "top down" representation of space, with the vertical axis typically
representing range and the
horizontal axis azimuth (angle). • B-scope displays were common in
airborne radars in the 1950s and 60s, which were mechanically scanned from side to side, and sometimes up and down as well. • The spot is swept up the Y-axis
similar to the A-scope's X-axis,
with distances further "up" the display indicating greater range. • This signal is mixed with a varying
voltage being generated by a mechanical device that depends on the current (horizontal) angle of the antenna.
• The radio signal is sent into the intensity channel, producing a
bright spot on the display
indicating returns.
2.5 C – SCOPE
A C-scope displays a "bull’s
azimuth vs. elevation. The "blip" was displayed indicating the direction of the target off the centreline axis of the radar, or more commonly, the aircraft or gun it was attached to. They were also known as "moving spot indicators", the movin being the target blip. Range is typically
Fig 2.5 C-Scope Radar Display
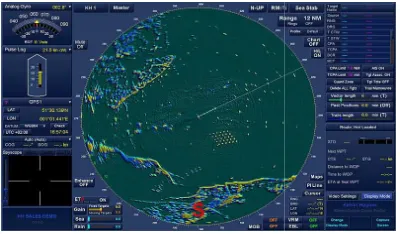
3. ADVANCED RADAR DISPLAY SYSTEMS
As computer workstations
increase in capability of displaying more information, the necessity for simple intuitive Graphical User Interfaces (GUI)
for computer monitors becomes
paramount. Touch screens can reduce HMI complexity and minimize response time
Fig 3 An example of advanced radar display: Marine Radar The radio signal is sent into the
intensity channel, producing a
bright spot on the display
eye" view of azimuth vs. elevation. The "blip" was displayed indicating the direction of the target off the centreline axis of the radar, or more commonly, the aircraft or gun it was attached to. They were also known as "moving spot indicators", the moving spot being the target blip. Range is typically
displayed separately in these cases, often as a number at the side of the display. Almost identical to the C
scope, which overlays a graphical
representation of the range to the target. The C-scope gives the target azimuth angle against the target elevation (vertical) angle, essentially giving the direction to the target but not its actual range. The vertical dimension on a C-scope presents the targets relative elevation and the horizontal dimension presents the targets relative azimuth. This is basically a “gun sight” configuration that might be used, for example, in an early interceptor aircraft.
Scope Radar Display
3. ADVANCED RADAR DISPLAY
As computer workstations continue to increase in capability of displaying more information, the necessity for simple intuitive Graphical User Interfaces (GUI)
for computer monitors becomes
ouch screens can reduce HMI complexity and minimize response time
for human interaction. Although touch screens have these advantages, humans tire when required to touch a screen for hours, so a combination of touch screen and mouse is considered optimal. The use of color coding to alert operators of events has been shown to reduce re
An example of this for radar systems would be to change background color when the system becomes not ready, so
that it becomes readily apparent.
Artificially Intelligent decision aids have also proved useful. These aids would help the user decide a course of action for specific events. Software
have also facilitated the incorporation of various other useful information elements. An example is geographical information in the form of map overlays and cursor location. Symbolic repr
on target classification is often used to present targets.
3 An example of advanced radar display: Marine Radar
displayed separately in these cases, often as a number at the side of the display. Almost identical to the C-scope is the
G-, which overlays a graphical
representation of the range to the target. scope gives the target azimuth angle against the target elevation (vertical) angle, essentially giving the direction to the target but not its actual range. The vertical scope presents the targets relative elevation and the horizontal nsion presents the targets relative azimuth. This is basically a “gun sight” configuration that might be used, for example, in an early interceptor aircraft.
raction. Although touch screens have these advantages, humans tire when required to touch a screen for hours, so a combination of touch screen and mouse is considered optimal. The use of color coding to alert operators of events has been shown to reduce response time. An example of this for radar systems would be to change background color when the system becomes not ready, so
that it becomes readily apparent.
4. CONCLUSION
The purposes of radar systems are to detect and locate targets. The information that is gathered by the radar system must be communicated to the human user of the system for analysis, interpretation, and
decision-making. This fact clearly
demonstrates the importance of display systems for radar systems, since the advantage was provided by a better display
system, not better detection capability. The paper included all different types of radar displays and brief description about how each display was different from other displays. The most common Analog Radar Displays were A-Scope, PPI and RHI.
Modern displays have started to
incorporate new designs, and will possibly be the advantage in future military conflicts.
REFERENCES
[1].Fog, Agner, “Man-Machine
Interface: Compendium on
User-friendly Design,” Copenhagen
Engineering College, 2000.
[2].Sharma, Rajeev, V.I. Pavlovic, T.S.
Huang, “Toward Multimodal
Human-Computer Interface,”
Proceedings of the IEEE, vol. 86, no. 5, pp. 853-969, May 1998.
[3].Reintjes, J. Francis and Godfrey T. Coate, Principles of Radar. New York: McGraw-Hill, 1952.
[4].Houze Jr, R. A., Biggerstaff, M. I., Rutledge, S. A., & Smull, B. F. (1989).
[5].Interpretation of Doppler weather radar displays of midlatitude mesoscale convective systems. Bulletin of the American
Meteorological Society, 70(6), 608-619.
[6].Houze Jr, R. A., & Betts, A. K. SA Rutledge, MI Biggerstaff, and BF Smull, 1989: Interpretation of Doppler weather radar displays of midlatitude mesoscale convective systems. Bull. Amer. Meteor. Soc, 70, 608-619.
[7].Baker, C. H. (1962). Man and radar displays. 1962.