Volume 2, No. 6, Nov-Dec 2011
International Journal of Advanced Research in Computer Science
REVIEW ARTICLE
Available Online at www.ijarcs.info
Comparative Analysis of Different Parameters in Propagation Model for Mobile
Communication System
Mukesh Sabharwal*
Department of Electronics and Communication Engineering Maharishi Markandeshwer University
Mullana, Ambala, India [email protected]
Vijay Kumar
Department of Electronics and Communication Engineering Kurukshetra University
Kurukshetra, India [email protected]
Mohit Bansal
Department of Electronics and Communication Engineering Maharishi Dayanand University
Rohtak, India [email protected]
Abstract- Nowadays the wireless technology becomes popular and receives growing acceptance as a Broadband Wireless Access (BWA) system. Wireless system has potential success in its line-of-sight (LOS) and non line-of-sight (NLOS) conditions which operating with different frequency. Estimation of path loss is very important in initial deployment of wireless network and cell planning. Numerous path loss (PL ) models (e.g. Okumura Model, Hata Model) are available to predict the propagation loss, but they are inclined to be limited to the lower frequency bands. Radio propagation is essential for emerging technologies with appropriate design deployment and management strategies for any wireless network. It is site specific and can vary significantly depending on terrain, frequency of operation, velocity of mobile terminal, interface sources and other dynamic factor. Accurate characterization of radio channel through key parameters and a mathematical model is important for predicting signal coverage, achievable data rates, specific performance attributes of alternative signaling and reception scheme s. Empirical path loss models for macro cells such as free path loss, Hata Okumura, COST 231 Hata and ECC 33 models are analyzed and compared. The received signal strength is calculated with respect to distance to determine the model that can be adopted to minimize the number of handoffs and avoid ping pong effect. This paper proposes a comparison study of different propagation model such as Okumara-Hata model, COST 231 Hata model, ECC-33 to calculate path loss for highway and urban between Bhubaneswar and Cuttack. Comparative study with real time measurement obtained from Bharat Sanchar Nigam Limited (BSNL) a GSM based wireless networks for Bhubaneswar and Cuttack has been implemented. A suitable empirical model for different environments is to be proposed. Also calculate received signal strength for each environment under all three models and calculate the probability for each case.
Keywords: Cellular mobile, Handoff, Path loss, Ping Pong, Received signal strength.
I. INTRODUCTION
Wireless communication is the fastest growing segment of the wireless industry. As such, it has captured the attention of the media and imagination of the public. The vision of the wireless network communications supporting information exchange between people or devices is the communications frontier of the next few decades and much of it already exists in some form. However, many technical challenges remain in designing of wireless networks that deliver the performance necessary to support emerging applications. This thesis analyses the comparison of three different models with calculating path loss for urban and highway. In addition, calculate the received signal strength (RSS) of base station with noise and without noise for the same area. We approach this problem by doing comparative study of different types of path loss models. And using these models we can measure the RSS which helps to deciding the handover. The basic characterization of the propagation of the wireless channel can be described as large-scale and small-scale fading. Large-scale fading deals with spatial characteristics of the channels. Basic
propagation models indicate that average received signal strength (RSS) power decreases logarithmically with distance.
II. PATH LOSS
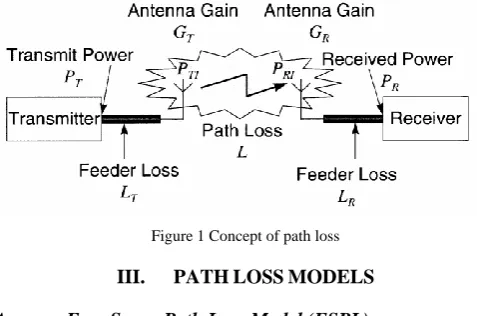
Figure 1 Concept of path loss
III. PATHLOSSMODELS
A. Free Space Path Loss Model (FSPL):
Path loss in free space defines how much strength of the signal is lost during propagation from transmitter to receiver [4]. FSPL is diverse on frequency and distance. The calculation is done by using the following equation:
The free space path loss frequency coverage of this model is in the range of 200 MHz to 1900 MHz and distances of 1 Km to 100 Km. It can be applicable for base station effective antenna heights (ht) ranging from 30 m to 1000 m. The Okumura model is a well known classical empirical model to measure the radio signal strength in build up areas. This model is perfect for using in the cities having dense and tall structure.The Hata model is an empirical formulation of the graphical path-loss data provided by the Okumura and is valid over roughly the same range of
The standard formula for empirical path loss [dB] in urban areas under the Okumara Hata model is given by:
(2) Where,
d is distance in Km.
A is fixed loss depends on frequency f.
These parameters are given by empirical formula.
(3)
(4) Where,
f is frequency measured in MHz
hb is height of base station antenna in meters. hm is height of mobile station antenna in meters. a (hm) is correlation factor in dBm.
For effective mobile antenna height a (hm) is given by
(5) The path loss model for highway is given by
For without noise factor
(6) For with noise factor
(7)
C. COST-231 Hata Model:
Hata model is used for the frequency range of 150 MHz to 1500 MHz to predict the median path loss for the distance d from transmitter to receiver antenna up to 20 km, and transmitter antenna height is considered 30 m to 200 m and receiver antenna height is 1 m to 10 m [5]. To predict the path loss in the frequency range 1500 MHz to 2000 [MHz], COST 231 Hata model is initiated as an extension of Hata model. To extend Hata-Okumura- model for personal communication system (PCS) applications operating at 1800 to 2000 MHz, the European Co-operative for Scientific and Technical Research (COST) came up with COST-231 model. This model is derived from Hata model and depends upon four parameters for prediction of propagation loss: frequency, height of received antenna, height of base station and distance between base station and received antenna. It is used to calculate path loss in three different environments like urban, suburban and rural (flat). This model provides simple and easy ways to calculate the path loss. Although our working frequency range (3.5 GHz) is outside of its measurement range, its simplicity and correction factors still allowed to predict the path loss in this higher frequency range.
The standard formula to calculate path loss in urban areas under COST-231 Hata model is given by
(8) Where
(9) The path loss model for highway under COST-231 Hata is
same as for Hata-Okumara model that is given by For without noise factor
(10) For with noise factor
(11)
D. Hata-Okumura Extended Model or ECC-33 Model:
Hata-Okumura model with report is referred to as ECC-33 model. In this model path loss is given by
(12) communication system. It depends on frequency, antenna height, receive terminal location relative to obstacles and reflectors, and link distance, among many other factors. Macro cells are generally large, providing a coverage range in kilometers and used for outdoor communication. Several empirical path loss models have been determined for macro cells. Among numerous propagation models, the following are the most significant ones, providing the foundation of mobile communication services [7]. models depends on the propagation environment. In our thesis, we analyze three different models which have been proposed connection break with active base station. Therefore the signal strength must be greater than threshold point to maintain the connection with active BS. The signal gets weaker as mobile moves far away from active base station and gets stronger signal towards new base station as it move closer. There is an option named Handoff if RSS of active base station decreases below threshold level to maintain the connection. Path loss is
an important factor in handoff. The RSS can be calculated with different path loss models like Hata-Okumara, COST-231 etc [11].
The received signal strength for Okumara Hata model, COST-231 Hata model and ECC-33 model are calculated as
(17)
A is connector and cable loss in dBm
With existing draft, the formula for highway area under ECC-33 model not defined. For this model, only urban path loss can be calculated [12]. threshold value and probability of handover becomes maximum, at that point handover take place otherwise connection lost.
(18) Where,
Tinit: initial threshold point at which initial handoff process starts to find out target base station with suitable parameters. Timin: it is minimum threshold point at which execution phase of handoff start and below this point connection breaks with current base station or delay produces if handoff execution is completed and packets lost.
VII. RESULTANDCONCLUSION
preferable than ECC-33 model and gives very close values to experimental values.
Table1 Simulation parameters
Parameter Value
Base station transmitter power 43 dBm Mobile transmitter power 30dBm Base station antenna height 35m Mobile antenna height 1.5m Transmitter antenna gain 17.5dB Threshold level for mobile -102dBm Threshold level for base station -110dBm
Frequency 900 MHz
Connector loss 2dB
Cable loss 1.5dB
Duplexer loss 1.5dB Maximum uplink loss 167.15dB
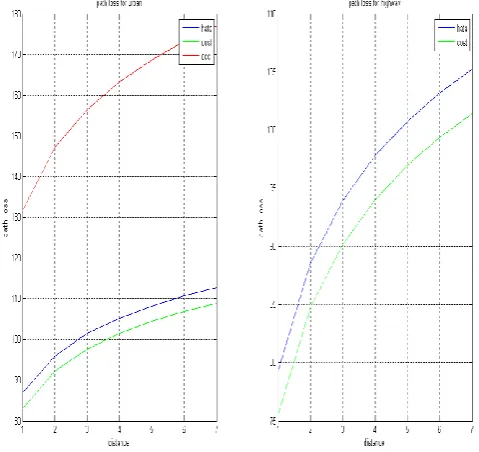
A. Path loss for Various Method:
The path loss of various models has been calculated and presented in table 2 for urban area.
Table 2: Path loss for various models (dB)
Distance Hata –Okumara COST -231 Hata ECC -31
1 125.4388 125.123 119.444 2 135.9055 135.59 134.8942 3 142.0311 141.7212 144.2851 4 146.3772 146.0674 151.1061 5 149.7484 149.4385 156.4873 6 152.5028 152.193 160.9426 7 154.8316 154.5218 164.7507
B. Graphical Result for Path Loss:
Figure 2(a) shows the comparison results of path loss for various models. The allowable uplink and downlink loss for base station transceiver are 167.15dB and 167.61dB. The number of handoffs per call is related to cell size, if cell size is smaller number of handoff comes maximum and result shows that path loss model which cover maximum distance minimizes the number of handoff. The path loss calculation using Hata- Okumura and COST-231 model are less than the threshold value up to 13 and ECC-33 model exceed the threshold value at 3. Therefore these two models except ECC-31 are more preferable. Hence, Okumara-Hata model and COST-231 Hata model are better option other than ECC-31. Figure 2(b) shows the comparison of highway using Hata-Okumara, COST-231 Hata models. As distance increases, Hata Okumara model has greater path loss as compared to COST. Therefore COST model is better option than Hata for highway environment to calculate path loss.
Figure 2 Path loss comparisons for (a) urban area and (b) highway
C. Received Signal Strength for Urban:
Table 3: Received Signal Strength for Urban (dB)
Distance Hata- Okumara COST 231 Hata ECC 31
1 -35.5147 -35.456 -60.1828 2 -44.438 -44.38 -75.331 3 -52.905 -52.846 -87.792 4 -55.293 -53.234 -91.172 5 -54.342 -54.283 -94.632 6 -53.026 -52.967 -95.345 7 -60.429 -60.37 -104.505
Table 3 shows calculated received signal strength for various models that have been used in proposed work like Okumara-Hata, COST-231 Hata and ECC-33 model in urban area.
Figure 3 RSS for urban (dB)
dB. And other two models show less value than threshold value. Therefore Hata Okumara model and COST-231 model are preferable for maximum coverage area and helps to reduce the number of handoff as compared to ECC-33 model.
The general area around highway could be suburban because of location. Received signal strength is also a major parameter to measure for highway. Table 5.4 shows RSS for Hata and COST-231 Hata model with experimental values.
Table 4: RSS for Highway
istance Hata –Okumara COS -231 Hata Experimental
values
1 -25.572 -25.513 -25 2 -34.496 -34.437 -34 3 -42.962 -42.903 -42
4 -43.35 -43.291 -43 5 -44.399 -44.34 -44 6 -43.083 -43.024 -43 7 -50.487 -50.428 -50
D.Graphical Representation for Highway:
Figure 4: RSS for Highway
Figure 4 Show RSS for highway have been calculated. Received signal strength for COST 231 and Hata- Okumura models are calculated and compared with experimental value as shown in table 5.4. The modified COST 231, Hata-Okumura suburban models for highway are matches with the experimental values.
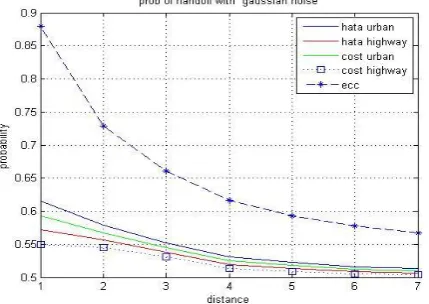
Figure 5 Comparison between probabilities of handoff for different models with Gaussian noise
Figure 6 Comparison between probabilities of handoff for different models with Gaussian noise
Result shows the highest probability as compared to Hata-Okumara and COST-231 models for same parameters. Therefore, Hata-Okumara and COST-231 models are the better option as compared to ECC-33 model.
VIII. REFERENCES
[1]. K.Ayyappan, P. Dananjayan “Propagatin Model for Highway in Mobile Communication System”.
[2]. Armoogum.V, Soyjaudah.K.M.S, Fogarty.T and Mohamudally.N, “Comparative Study of Path Loss using Existing Models for Digital Television Broadcasting for Summer Season in the North of Mauritius”, Proceedings of Third Advanced IEEE International Conference on Telecommunication, Mauritius Vol. 4, pp 34-38, May 2007.
[3]. Chi Ma, Enda Fallon, Yansong Qiaoz, “VOSHM: a velocity optimized seamless handover mechanism for WiMAX networks” School of Computing 9th. IT & T Conference,2007.
[4]. Ken-Ichi Itoh, Member, IEEE, Soichi Watanabe, Jen-Shew Shih, and Takuro Sato, Senior Member, IEEE, “Performance of Handoff Algorithm Based on Distance and RSSI Measurements” IEEE, 2002.
[5]. V.S. Abhayawardhana ,I.J. Wassell, D. Crosby, M.P. Sellars, M.G. Brown, Cambridge Broadband Ltd., Selwyn House, Cowley Rd., Cambridge CB4 OWZ, UK “Comparison of Empirical Propagation Path Loss Models for Fixed Wireless Access Systems” IEEE.
[6]. K.Ayyappan, P. Dananjayan, “Propagation Model For Highway In Mobile Communication System”, IEEE.
[7]. G.S Tomar and Verma. S, “Analysis of handoff initiation using different path loss models in mobile communication system”, Proceedings of IEEE International Conference on Wireless and Optical Communications Networks, Bangalore, India, Vol. 4, May 2006.
and RSS measurements”, IEEE Transactions on vehicular Technology, Vol. 57, No.6, pp 1460-1468, November 2002.
[9]. Abhayawardhana V.S, Wassell.I.J, Crosby D, Sellars. M.P.and Brown. M.G, “Comparison of empirical propagation path loss models for fixed wireless access systems”, Proceedings of IEEE Conference on Vehicular Technology , Stockholm, Sweden, Vol. 1, pp 73-77, June 2005.
[10]. Maitham Al-Safwani and Asrar U.H. Sheikh, “Signal Strength Measurement at VHF in the Eastern Region of Saudi Arabia”, The Arabian Journal for Science and Engineering, Vol. 28, No.2C, pp.3 -18, December 2003.
[11]. S. Hemani and M. Oussalah, “Mobile Location System Using Netmonitor and MapPoint server”, Proceedings of Sixth
annual Post graduate Symposium on the Convergence of Telecommunication, Networking and Broadcasting, PGNet ,pp.17-22,2006.
[12]. T.S. Rappaport, “Wireless Communications”, Pearson Education, 2003.
[13]. William C.Y. Lee, “Mobile Cellular Telecommunications”, McGraw Hill International Editions, 1995.