Volume 8, No. 5, May – June 2017
International Journal of Advanced Research in Computer Science RESEARCH PAPER
Available Online at www.ijarcs.info
A Research on Data Mining using Machine Learning
Babita Kumari
M.TECH. Student UIET, M.D. University, Rohtak Haryana, IndiaRainu Nandal
Assistant Professor UIET, M.D. University, RohtakHaryana, India
Jyoti Kataria
M.TECH. Student UIET, M.D. University, RohtakHaryana, India
Abstract: Data mining is the mathematical techniques of reading patterns in large sets of data involving methods belonging to the various fields like artificial intelligence, machine learning, and statistics. It is a subfield of computer science. This field is in high demand in the 21st century because it is implementable in all fields of science, social media and business. We are using the concepts of machine learning to train our system against a set of English phrases and words which may have weight .This weight is how we decide whether the phrases have a positive, negative or neutral net sentiment ratio. We then read data from sources and perform statistical analysis on this data to take some useful decisions. These choices can display to be of vital importance in numerous fields from industrial employer, Medical, Engineering and Media. Data mining is the exploration and evaluation of massive statistics gadgets, so that it will discover significant sample and policies. The basic concept is to catch out powerful way to mix the PC’s (personal computer) capacity to technique the information along the human eyes potential to encounter styles. The layout and art work effectively with big data unit that is purpose of record data mining. Information discovery from database is the wider process of data mining. Data Mining is the approach of reading facts from specific perspectives and encapsulates the results as helpful facts. It has been defined as "the nontrivial technique of figuring out legitimate, novel, probably beneficial, and ultimately comprehensible patterns in document.
Keywords:data mining, machine learning, artificial intelligence, information technology, data visualization
I. INTRODUCTION
Data mining is a cutting-edge location within the vicinity of IT Data mining is defined as a method of studying hidden valuable understanding with the resource of way of reading massive portions of information units , which may be saved in databases or records warehouse using numerous information mining strategies which includes tool studying, artificial intelligence(AI) and facts. Diverse Congresses in various industries are taking blessings of information mining which consist of deliver chain, marketing and marketing, medical, aerospace and so forth., to increase their company overall performance. Therefore, the dreams for a preferred statistics mining approach goes upward spiral. A upon and it need to be usable thru humans information mining techniques want to be relied upon and be usable with the beneficial aid of human beings from any vicinity from any subject with very little know-how of statistics mining. As the prevent give up result, in 90’s a bypass-enterprise employer famous procedure for statistics mining that is abbreviated crisped, first published after going through a number of workshops, and contributions from over 3 hundred companies.Data mining is a numerous region which mixes the statistics of laptop era, analytics; tool gaining knowledge of, Artificial intelligence, Data Visualization, records cleansing. Using two analyzing strategies a truth is mined i.e Supervised studying or unsupervised getting to know [5].
• Supervised Learning:
Supervised mastering (frequently moreover known as directed statistics mining) the varying below research may be cut up into corporations:
Describing variables and one (or greater) based completely unstable.
Figure 1: supervised learning
massive a part of the facts set to preserve with directed facts mining strategies.
• Unsupervised Learning:
All of the variables are dealt with in same way there is no distinction among based totally and explanatory variables that is unsupervised learning. However, in assessment to the decision random statistics mining, despite the reality that there may be some aim to gain. This aim is probably as records discount as stylish or extra specific likes assemble. The dividing path among supervised learning and unsupervised analyzing is the identical that distinguishes evaluation for cluster assessment.
Figure 2: Unsupervised learning
Supervise gaining knowledge of requires, cause variable must be properly described and its value are given that is enough kind. Unsupervised studying common both the intention variable has splendid been register for too minor a several of instances or unknown the target variable. Data search has superior into a crucial and lively vicinity of research since of the conceptual annoying situations and realistic applications affiliated with the hassle of coming across thrilling and formally unknown statistics coming out of actual-international databases. The important demanding conditions to the data search and relate to worries in manipulate the algorithms are as come behind.
1. Vast datasets and excessive capacity.
2. Above becoming and evaluate the statistical importance.
3. Coherent of styles.
4. Non-massive deficient records and statistics incorporation.
5. Mixed changing and expendable information.
The particular training of six sports activities or duties as follows that are used in data mining term.
1. Classification 2. Estimation 3. Forecast
4. Affinity collecting or affiliation policies 5. Clustering
6. Description as well as visualization
First 3 obligations - category, estimation and forecast policies are examples of handle statistics mining or
Supervised getting to know: In point information mining, the purpose is to use them available file to make a model that represent one or extra discrete function(s) of attraction (aim assign or beauty attributes) in title of relax of the obtainable quality.
The subsequent 3 responsibilities – affiliation regulations, clustering along with outline are sample of undirected data extract i.e. no element is select out because of the fact the a,
the imprecate goal is toward installation a few courting amongst every attributes [6].
A. Classification
Classification includes inspecting the capabilities of a freshly furnished object and promoting to pull a predefined elegance. The class undertaking is signalize by the properly-explain training, and a schooling put together with redirected examples. The venture is on collect a version that may be carried out to dull data as a way to classify it. Examples of type obligations include:
• Classification of credit score applicants as low, excessive danger or medium.
• Classification of mushrooms as wholesome to be eaten or poisonous.
• Determination of which home cellular phone traces are used for internet gets entry.
B. Estimation
It deals with permanent valued consequences. Predetermined some enter records; we use guess to give you a price for a few unknown continuous movable acting as income, credit card balance or height.
C. Prediction
Any prediction may be notion of as magnificence or judgment. The distinction is actually without a doubt one of accent. When records mining is apply to grade a cellular phone channel as typically used being get proper of access to or a credit score card transaction as fraudulent, we do not count on as a way to bypass back tardily to appearance if the beauty become proper. Our kind may arise accurate or wrong; but the unreliability is because of half-finished data most effective: away in the actual global, the applicable movements have already capture vicinity.
D. Association Rules
A rule which implies reliable association correlation among a set of objects (which include “occur collectively” or “one implies the other”) in database
E. Clustering
Cluster assessment may be used simultaneously a separate information mining apparatus to advantage perception into the records distribution, or as a preprocessing step for specific records mining algorithms working on the detected clusters. Many clustering algorithms were superior and are categorized from numerous factors which consist of partitioning strategies, hierarchical strategies, density based totally techniques, and grid-based totally strategies .Further facts set can be numeric or particular.
General Types of Clusters:
So that some component in a collection is nearby (or extra comparable) to each different dot inside the cluster in comparison to any other nib that isn't always within the cluster.
Center-based:
Contiguous clusters:
Table I data exploration Sr.
No.
Vocabulary Syntax based Logical
1 Character Vector-space
based
Collaborative tagging
2 Words Language model Temperature/frames
3 Phrase Full-parsing Ontologism/first order theories
4 Part-of-speech tag
A cluster is a hard and fast of things in order that a problem in a cluster is nearest (or greater comparable) to at the least one or extra extraordinary points in the cluster in assessment to any factor that isn't always in the cluster.
Density-based clusters:
A cluster is a thick location of factors, it certainly is divide via consistent with the little-density areas, taken away one-of-a-kind regions this is of excessive density.
Shared premises or notation Clusters gather clump that percent a few commonplace homes or constitute a particular idea.[14]
F. Description and Visualization
Is a powerful shape of pictorial facts mining? It isn't always continuously clean to give you massive visualizations; however the proper photograph virtually may be nicely well worth one thousand affiliation guidelines because the humans are extraordinarily practiced at extricate which means from optic scenes. Expertise discovery goals are described via the intentional use of the device. There are styles of desires:
Verification: The machine is restricted to confirm the individual’s hypothesis.
Discovery: In which the system autonomously unearths new patterns.
II. MODEL
The model of hoe problem is defined and getting through the various steps for the solution is given below in the figure 3.
Figure 3: The Crisp Dm Process
1.1 Problem Definition: We begin by problem definition. In our case the problem is reading the phrases and the words in the phrases. In the industry Data miners, Business Managers, team leads and domain masters need to
work closely to define the project objective, requirements in the business context. [1]
1.2 Data exploration: Masters of the respective domain understand the metadata and what it means. This is the phase where a data mining expert decides the source of his data and starts collecting it .This is a vital phase because the data collected here will decide the outcome of an important decision. [8]
1.3 Data Preparation: This is the phase where domain experts build the Model of data for modeling process. They collect clean and cleanse the data for example. A data from excel sheets usually starts from the 2nd row. This is not true for a data from CSV file because it is neither in block form like the excel sheet data and neither does it start from the 2nd row. Proper steps have to be taken to prepare the data manually or through computational techniques. [8]
Figure 4:Process Data Prepration
1.4 Modeling: This is the phase where we decide on a technique to be used to analyze data. It could be KNN where we come to a conclusion by plotting a graph using a threshold and seeing which way the overall data is leaning towards. [10]
Figure 5:Diagram Of Modleling
company reasons and observe questions like: Has the industrial organisation task been finished by manner of the model? Have all industrial company issues been reviewed? At the end of the assessment phase, the facts mining experts determine how to use the records mining consequences. [9]
1.6 Deployment: Data miners evaluate the results by exporting the results into database tables or into other applications, for example XLS files [11].
III. LITRATURE REVIEW
We studied the whole flow of data mining from data extraction, data cleaning, data exploration and modeling to evaluation and finally taking decisions. This whole life cycle is called CRISP_DM process model.
IBM learning center is providing a high level of implementation skills to students and working professionals [1].
We are using similar technique to achieve a sentiment conclusion about phrases. Example, “Abki Bar Modi Sarkar”, is a positive phrase which is popular as well while,”Ab ki bar nahi chahiye aisi sarkar” is a negative phrase. Both have different sentiment and this need to be identified using words like ‘Nahi’. Then we studied concepts and techniques of data mining from math works [2].
This gave us a lot of insight on how to use MATLAB for data mining and machine learning. We read about why MATLAB is the best language for data mining [3].
We went on and read the blog by Loren on the art of MATLAB and we used analyze twitter. One can hold a perspective of social media these days, there is no denying it is now a mundane part of our digital life. Enough, that social media metrics are now considered part of altimetry, an alternative to the established metrics such as citations to measure the impact of scientific paper [4].
We studied various techniques for data preparation .This is a crucial step which needs to be done very meticulously .Doing this right can save us from getting faulty values and also save a lot of time in processing .This is usually very time consuming and knowledge of reading different datasets can be helpful [8] like XLS format CSV format or text format. Hatzivassiloglou V, McKeown KR wrote about prediction of orientation of Linguistics [7].
Salford’s article on choosing the right target data is also very important and in order to ensure we have the right audience we first need to extensively study our problem statement .We read a lot of articles in this regard so that we can separate the Area of interest from the rest [12].
They were using the techniques of machine learning and data mining for Natural language processing. They used Regression techniques to learn and mold adjectives of the decision result to the actual result. We also studied S Padmaja and Prof S Sameen Fatima of Osmania University, team paper [13].
They did an extensive research on how to find out scope of negation in newspaper, which gave us more insight on how to use MATLAB efficiently and more statically to add the world of machine learning.
IV. METHDOLOGY
• We are using Neural Networks [10] to train our system against these words and phrases to assign sentiment values to our system .This way when we read data from twitter, blogs etc we can do sentiment
analysis of those tweets sing our trained system and conclude if the sentiments of the tweets etc are positive, negative or neutral.
• Supervised learning method: We are using stored sentences in an excel sheet [6] [7]. The sentences are stored in such a way that each important phrase in the sentence is extracted and stored separately. We have given these individual phrases some weight we have another matrix called the weight matrix which we are using as training sets.
• We are then comparing the sample test sets with our weight matrix to calculate the net sentiment ratio
• NSR = (Positive Sentiments – Negative
Sentiments)/Total Sentiments [9].
• To test our code we used MATLAB which has an inbuilt tools twisty which has protocols defined inside it which can communicate with twitter[4] : a. To communicate with twitter however we need to
make a developer account.
b. We then net to generate developer credentials and secret pass code
c. This code is then used by twisty to login to twitter. • Now we can read all the tweets by using various
parameters and get tweets relevant to our interest. This part is very important because if the data collected is not relevant then the NSR would be useless. For example MATLAB in Hindi means meaning but it is also software. So if we don’t take this possibility into consideration then the data collected will be useless.
• We finally use the concept of KNN to calculate the overall response of a tweet or data. We plot the NSR values of a 100 tweets and plot it on a graph .we decide a threshold and see which way is the most number of tweets leaning towards.[8]
• Finally we are also using Support Vector Machine for Binary Classification of data [12].
V. CHALLENGES
1. There are extremely many challenges in opposed aspects in Data mining. Some of these challenges are popular among nearly all data statics, judge, and predictive stylish while others arise more industry-specific. Nevertheless, we totally run into a problem here and there (hopefully more like there, not here) and it can be a stressful task to control our daily assignment challenges
2. Data with trend values such as: dusty fact, lost values, insufficient data size, and also bad representation in report examine.
3. Lack of circumstance in the branch of data mining procedure in hypothetical scene
4. The lack of evaluate Theories on chief data mining subject and method. At reasonable cost Academies have trouble accessing commercial-grade. 5. Kind of Data, trying to take in data that arrive from
different documentation and in a nature of different shape (images, map fact text, social, numeric, etc.). 6. Info speed, online machine learning request models
to be timely modified along new, entering data. 7. Dealing with quantities of datasets, or 'Big Data,'
8. Coming extend with the suitable question or issues - "More data make the better formula, but smarter questions beat more data.
9. Left over objective and consider the information to put for you not the parallel. Predetermined notions can be harmful but fortunately it is in our grip to avert these [12]
VI. COMPARISION OF OTHER TECHNIQUE AND ALGORITHM
These techniques are differentiate to decide that can dedicate us superior results to plot using KNN algorithm .For example, A mean result is very close to a median result but the two are very different .Hence decide a technique move hand in hand with understanding what the technique will produce 1. Mean
The mathematics gadget or as we remarkable, “the average,” is the sum of a listing of quantity divided by way of the variety of objects on the listing. It is useful in calculate the overall fashion of a statistics set or providing a rapid photograph of your records. Another benefit of the recommend is that it’s very smooth and quick to determine.
Disadvantage
Mean, taken lonely is a unstable tool. In some information file, the recommend is also almost related to the mode and the center (specific calculations close to the common).This may additionally want to offer arise to just accept as genuine with that the answer accrued is correct to our getting to know even concept it can no longer be genuine. However, in a facts report with a excessive amount of outliers or a skewed distribution, the suggest definitely isn't always correct and you want to go along with a diffused choice
2. Standard Deviation
Standard deviation is used to reveal unfold round a mean or common fee. A massive diploma of fashionable deviation means that data is unfold more far from the recommend, in which as a low popular deviation may suggest that extra information aligns with the mean. In a portfolio of statistics analysis techniques, the standard deviation is beneficial for speedy forecasting dispersion of statistics factors.
Disadvantage:
Alone, the same old deviation is absolutely as volatile due to the fact the mean. For example, if the records have a totally atypical sample inclusive of an atypical curve or a massive quantity of outliers, then the standard deviation acquirer’s offer you with all of the facts you need.
3. Linear Regression
It used to model the relationships between self-explanatory and dependent variables, in scatter plot which are usually charted. Whether those relationships are strong or weak the regression line designate. Linear Regression is usually taught in high school or college statistics courses with applications for science or business for forecasting trends over time.[15]
Disadvantage:
Linear Regression is never very subtle. Sometimes, the outliers on a scatter plot matter significantly. For example, an outlying data point may constitute the input from your most crucial provider or your most selling product. The character of a regression line, anyway, urges you to snub these outliers. As a sketch, examine a snap of a Cameraman in MATLAB database, in which the input sets have the precise same regression track but include widely divergent data points.
VII. APPLICATIONS
• Machine learning is the hot topic right now in the technical world ,and for very good reasons :It represents a major step forward in how computers can learn.[5]
• These are the various fields in which people use machine learning:
• Healthcare analytics: machine learning is used to spot patterns .Ex one study used CAD to study the early mammography survey of women who later developed breast cancer.
• Marketing Personalization: Customers and their needs are the most important in this field and there is nothing better than using machine learning and analytics. That’s the foundation behind marketing personalization. Perhaps you’ve had the experience in which you visit an online store and look at a product but don’t buy it — and then see digital ads across the web for that exact product for days afterward. That kind of marketing personalization is just the tip of the iceberg.
• Data mining used in design and construction of data warehouse for analysis of multidimensional data. • Loan payment prediction and customer credit policy
analysis.
• Clustering and classification costumer target marketing.
• Query tool and visualization data mining are used.
• Semantic integration of distributed, heterogeneous proteomic database.
• Discovery of analysis of genetic network and structural pattern.
• Machine Learning is collaborating with Data Mining and different Data Analytics working for managing the data agency. At its substance, Data Mining transfer to a calculation piece analysis technique mainly concentrates on detection patterns in huge chunks of data. This process compute in discovering patterns, significant insights and effective information to progress predictive framework and future affair related to deals and marketing for certify businesses intelligence
• Association and path analysis.
VIII. PROPOSED WORK
To gather and analyze data sets from blogs, social media etc and perform statistical analysis on the same. To check the response of news and to conclude which news is fraud and which is not etc.
IX. RESULTS
signals. 10 dissimilar patients are taken for our existing occur research work. Such signals are analyzes using various machine learning algorithms like Support Vector Machine which is helpful in classifying the seizure as epileptic or non-epileptic. In this analysis work a single patient reporting length is comparative 7200 samples, recorded at a rate 1000 samples per second, for duration of 7.2 seconds. By analyzing the data we came to know that out of 10 patients (having 7200 samples each) six patients are without epileptic disorder and four patients are having epileptic disorder.
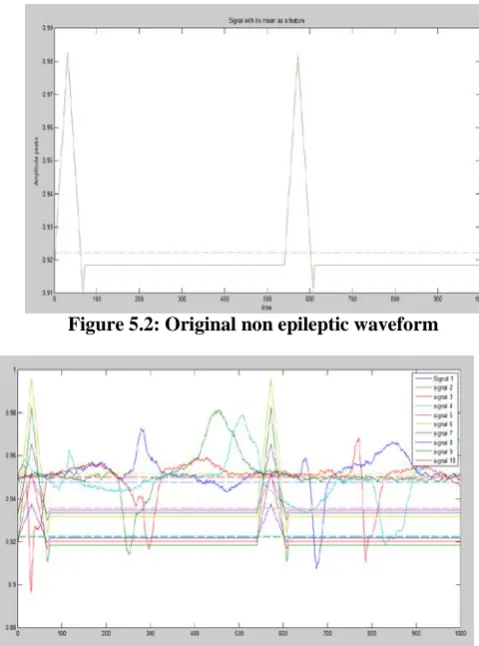
[image:6.595.49.283.229.399.2] [image:6.595.318.544.251.422.2]In the advent of such recordings it is important to analyze the time domain representation of the signal in such cases. Figure 5.1 and 5.2 shows results of time domain waveforms as given in the AAMI database for visualizing it with respect to its mean.
Figure 5.1: Epileptic waveforms measured for 1000 samples
Figure 5.2: Original non epileptic waveform
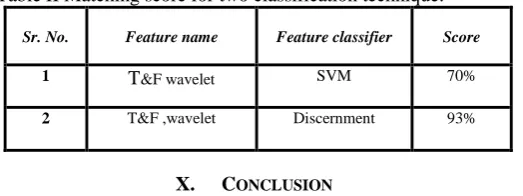
Figure 5.3: Graph showing signals of 10 users with their mean value
Above figure shows signals from 10 users either having epilepsy or without epilepsy. The fluctuating curves shows the patients with epileptic seizures along with their mean as a feature while the smooth peak curves shows the patient without the symptoms of epileptic seizures along with their mean as a feature. In this thesis work, 1000 sampled values from 7500 samples of each user is taken and is analyzed for the epileptic disorder.
[image:6.595.38.278.428.751.2]Similarly visualizing waveforms evaluation will be generated for both epileptic and non epileptic signal by applying fast Fourier transform. Figure 5.4 shows the patient without epilepsy which is analyzed by Fast Fourier Transform which calculates the Energy by Frequency domain analysis while Fig 5.5 shows the patient having epileptic seizures computed by Frequency Domain analysis showing graph between Energy Vs Magnitude.
Figure 5.4 EEG non epileptic signals for frequency domain
Figure 5.5: EEG epileptic signal for frequency domain visualization
Now it is most important for the current research work to introduce the classification technique which is of utmost importance, when any arbitrary signal is given in this then how much will be recognition score, so most importantly there will be two different techniques for complete research work analysis, i.e. support vector machine and discriminate analysis.
Table II shows a good compute result that evolves with respect to identify score.
[image:6.595.319.561.450.603.2]Table II Matching score for two classification technique.
Sr. No. Feature name Feature classifier Score
1 T&F wavelet SVM 70%
2 T&F ,wavelet Discernment 93%
X. CONCLUSION
Analysis was done on data sets of popular news and tweets of famous people with large following. Result was concluded on the basis of degree of fakeness and mass affect in persuasion of people. Results were plotted for the same. Popular techniques can be used to filter the fake tweets and prevent people who spread it from swaying general users.
XI. REFERENCE
[1] Mohamed Baddal, “A Framework for Text Classification using IBM SPSSModeler”, IBM Learning Center, 11 February 2015. [2] Abdul Razzaq, “Data Mining in MATLAB”,MATLAB Central
linkexchange-1304, 15 June 2015.
[3] Sandro Saitta, “Why Is MATLAB the Best Language for Data Mining”, Data Mining Research, 13 Jul, 2007.
[4] Loren Shure. “Analyzing Twitter”, Blogs Math works, Issue, 4 June 2014.
[5] Bernard Marr, “The Top 10 Machine Learning Use Cases Everyone Should Know About”, FORBES, 30 September 2016.
[6] Dave K, Lawrence S, Pennock DM, “Mining the Peanut Gallery: Opinion Extraction and Semantic Classification of Product Reviews”, Proceedings of the 12th international Conference on World Wide Web, New York, USA, 2003, 519–528
[7] Hatzivassiloglou V, McKeown KR, “Predicting The Semantic Orientation Of Adjectives”, Proceedings of the 35th Annual Meeting of the Association for Computational Linguistics and the 8th Conference of the European New Brunswick, Canada , 1997.
[8] Jenn Riley, “Understanding Meta Data”, Primer Publication of National Information Standard Organization Baltimore, 18 January 2017.
[9] S Padmaja and Prof S Sameen Fatima, “Evaluating Sentiment Analysis: Identifying Scope of Negation in Newspaper Articles”, UCE Osmania University, International Journal of Advanced Research in Artificial Intelligence, 17 December 2016.
[10]Ralph,“Metadata Models : What They Are And Why You Need One For Successful DAM ”, Digital Asset Management Blog , Webdam ,9 December 2014.
[11]Saedsayad. Dr. Saeds Sayad, “Model Deployment Methods [12]Heather Hinman, “Data mining Challenges”, Article simply
Salford, 23 July, 2013.
[13]Dinesh Bhardwaj, Sunil Mahajan, “Analysis of data mining trends, applications, benefits and issues”, International Journal of computer science and communication and engineering, volume 5 issue 1, February 2016, IEEE.
[14]Miss Nazneent Arannum S. H. Rizvi, “A systematic review of data mining: concepts and techniques”, International Journal of Research in Computer and Information Technology, Vol. 1 Issue1, 2016, IEEE.