!
"!" # $ $"
% & ''' (
Modelling of Reusability of Procedure Based Software Components Using K-Means
Clustering Approach
Rahul Malhotra
Associate Professor (Deptt. Of ECE) B.M.S.C.E, Sri Muktsar Sahib
Punjab, India [email protected]
Hemani Sharma*
Lecturer, (Dept. of CSE) B.M.S.C.E, Sri Muktsar Sahib
Punjab,India
Abstract: Software reuse is the process of implementing or updating software systems using existing software assets. Software Reuse promises significant improvements in software productivity and quality. There are two approaches for reuse of code: develop the code from scratch or identify and extract the reusable code from already developed codes. A great deal of research over the past several years has been devoted to the development of methodologies to create reusable software components and component libraries, where there is an additional cost involved to create a reusable component from scratch. But the issue of how to identify good reusable components from existing systems has remained relatively unexplored. Our approach, for identification and evaluation of reusable software, is based on software models and metrics. As the exact relationship between the attributes of the reusability is difficult to establish so a Clustering Based approach could serve as an economical, automatic tool to generate reusability ranking of software by formulating the relationship based on its training. The Kmeans based clustering has proved its effectiveness in modeling of data in various domains. Inputs to the clustering system, are provided in form of McCabe’s Cyclometric Complexity Measure for Complexity measurement, Regularity Metric, Halstead Software Science Indicator for Volume indication, Reuse Frequency metric and Coupling Metric values of the software component and output is be obtained in terms of reusability.This Approach is applied on the C based software modules/components and it can further be extended to the Artificial Intelligence (AI) based software components e.g. Prolog Language based software components. It can also be tried to calculate the fault-tolerance of the software components with help of the proposed metric framework.
Keywords: Reuse, clustering, metric, cyclometric, complexity, coupling etc.
I. INTRODUCTION
Software reuse is the process of implementing or updating software systems using existing software assets. Software assets or components include all software products, from requirements and proposals, to specifications and designs, to user manuals and test suites. Anything that is produced from a software development effort can potentially be reused.
The reusability is the quality of a piece of software, that enables it to be used again, be it partial, modified or complete. Software professionals have recognized reuse as a powerful means to potentially overcome the situation called as software crisis[8].Software Reuse promises significant improvements in software productivity and quality. According to Gomes, the idea of software reuse appeared in 1968, opening new horizons for the software design and development. Reusable software components have been promoted in recent years. The software development community is gradually drifting toward the promise of widespread software reuse, in which any new software system can be derived virtually from the existing systems. As a result, an increasing number of organizations are using software not just as all-inclusive applications, as in the past, but also as component parts of larger applications. In this new role, acquired software must integrate with other software functionality[3].
Software reusability is an attribute that refers to the expected reuse potential of a software component. Software reuse not only improves productivity but also has a positive impact on the quality and maintainability of software products.
Given the attractive payoff of reusing software, there have been several efforts undertaken to discuss the topic of reusability, including overviews of software reusability research directions and software reusability in practice. Developers are adopting many of these reuse approaches, including reuse in product lines, design patterns templates, reference architectures and advanced searching, matching, and modeling tools.[8,10] Many other reuse approaches, such as product lines, design patterns, and context-independent techniques, address reuse in different ways and have also demonstrated benefits.
There are two approaches for reuse of code: develop the code from scratch or identify and extract the reusable code from already developed code. For the organization that has experience in developing software, but has not yet used the software reuse concept, there exists extra cost to develop the reusable components from scratch to build and strengthen their reusable software reservoir. The cost of developing the software from scratch can be saved by identifying and extracting the reusable components from already developed software systems or legacy systems[10].
The contribution of metrics to the overall objective of the software quality is very well understood and recognized. But how these metrics collectively determine reusability of a software component is still at its naïve stage[10].
A. Introduction to Clustering Techniques
Clustering means to assign a set of observations in to different groups (known as clusters), so that the observations are same in some sense. At a general level, there are two types of clustering: distance based and conceptual clustering. Distance based clustering divides the data in to subsets on the basis of distance.[6]. Conceptual clustering, cluster the data on the basis of the similar concept the data will have.
An important component of a clustering algorithm is the distance measure between data points. If the components of the data instance vectors are all in the same physical units then it is possible that the simple Euclidean distance metric is sufficient to successfully group similar data instances. It is the ordinary distance between two points that one would measure with a ruler, which can be proven by repeated application of the Pythagorean Theorem. The major focus of clustering research is to extract information from data automatically, by computational and statistical methods. Hence, clustering is closely related to data mining and statistics.
Many clustering methods aim at finding a single partition of the collection of items into clusters. However, obtaining a hierarchy of clusters can provide more flexibility and other methods rather focus on this[6]. A partition of the data can be obtained from a hierarchy by cutting the tree of clusters at some level. Most clustering methods were developed for numerical data, but some can deal with categorical data or with both numerical and categorical data.
The degree of membership of a data item to a cluster is either in [0, 1] if the clusters are fuzzy or in {0, 1} if the clusters are crisp. For fuzzy clusters, data items can belong to some degree to several clusters that don’t have hierarchical relations with each other. This distinction between fuzzy and crisp can concern both the clustering mechanisms and their results. Crisp clusters can always be obtained from fuzzy clusters. Clusters can be seen either as distant compact sets or as dense sets separated by low density regions. Unlike density, compactness usually has strong implications on the shape of determine how the data are organized.
Clustering algorithms can be:
[a] Hierarchical:
A hierarchical algorithm creates a hierarchy of clusters which may be represented in a tree structure called a dendrogram. The root of the tree consists of a single cluster containing all observations, and the leaves correspond to individual observations. In hierarchical clustering algorithm, a valid metric may be used as a measure of similarity between pairs of observations. Algorithms for hierarchical clustering are generally either agglomerative, in which one starts at the leaves and successively merges clusters together; or divisive, in which one starts at the root and recursively splits the clusters.
[b] Partitional:
Partitional algorithms typically determine all clusters at once. These algorithms divide data in to independent clusters
on the basis of distance measures.A division data objects into non-overlapping subsets (clusters) such that each data object is in exactly one subset.
K-Means is an unsupervised clustering technique used to classify data in to K clusters. It is partitional clustering approach, each cluster is associated with a centroid (center point), each point is assigned to the cluster with the closest centroid, Number of clusters, K, must be specified.
Fuzzy C-Means (FCM) is a method of clustering which allows one piece of data to belong to two or more clusters. It processes n vectors in p-space as data input, and uses them, in conjunction with first order necessary conditions for minimizing the FCM objective functional, to obtain estimates for two sets of unknowns. FCM clustering is used to build fuzzy rule bases for fuzzy systems design; and there are numerous applications of FCM in virtually every major application area of clustering
[c] Spectral:
Spectral clustering techniques make use of the spectrum of the similarity matrix of the data to perform dimensionality reduction for clustering in fewer dimensions.
The main requirements that a clustering algorithm should satisfy are scalability; dealing with different types of attributes; discovering clusters with arbitrary shape; minimal requirements for domain knowledge to determine input parameters; ability to deal with noise and outliers; insensitivity to order of input records; high dimensionality; interpretability and usability.
Clustering techniques create applications that are rugged, self-adapting, easier to maintain and often more fault tolerant than conventional systems. An adaptive feedback loop can tailor a system to changes in enterprise policies and make it more resilient. Clustering deals with the issue of how to build programs that improve their performance at some task through clustered data.
A great deal of research over the past several years has been devoted to the development of methodologies to create reusable software components and component libraries, where there is an additional cost involved to create a reusable component from scratch. That additional cost could be avoided by identifying and extracting reusable components from the already developed large inventory of existing systems. But the issue of how to identify good reusable components from existing systems has remained relatively unexplored. Our approach, for identification and evaluation of reusable software, is based on software models and metrics. As the exact relationship between the attributes of the reusability is difficult to establish so a Clustering based approach could serve as an economical, automatic tool to generate reusability ranking of software by formulating the relationship based on its training.
II. A REVIEW OF LITERATURE
analysis model and design model. Advantages and disadvantages of each object-oriented metric was explained. Information regarding theoretical background of the reusability of software and Object oriented metrics for measuring size, complexity are also given in this reference.
(Boetticher, et.al, 1993) discussed various approaches for measuring software reusability, to build reusable components and to identify useful modules in existing programs. Taxonomy of reusability metrics was given which provide the attributes of reusable software. Two main methods are there to measure the reusability. One is Empirical methods stress objective, numerical, and repeatable metrics, such as those obtained by observing the module complexity or size. Other is
Qualitative methods included (or even emphasized) subjective criteria, such as how well a module complies with a set of style, certification, quality guidelines, or simply agrees with the opinions of "experts." These are further divided into two categories module oriented and component oriented.
(Kartalopoulos, S. V. 1996) discussed REBOOT
(reusability based on object oriented technique) that develop a taxonomy of reusability attributes. It provided reusability factors, a list of criteria for factor and a list of metrics for each criteria. Various object oriented concepts were defined in this paper, which are useful for finding the reusability. Information about software reuse, types of software reuse requirements for building software reuse and management issues toward reusable software were also given. This also shows the advantages of this technique over other methods.
(Kartalopoulos, S. V. 1996) discussed REBOOT
(reusability based on object oriented technique) that develop a taxonomy of reusability attributes. It provided reusability factors, a list of criteria for factor and a list of metrics for each criteria. Various object oriented concepts were defined in this paper, which are useful for finding the reusability. Information about software reuse, types of software reuse ,requirements for building software reuse and management issues toward reusable software were also given. This also shows the advantages of this technique over other methods.
(Jang, J-S. R. and Sun, C.T., 1 9 9 5 ) stated that basic reusability attributes depend on qualities of Correctness, readability, testability but it is not possible to directly measure the most of these attributes of reusable software. Attributes of reusable software were clearly defined in their work. (Selby, R. W., 1988) discussed neural network approach to generate the metrics for measuring the reusability and it was proved better over other object oriented metrics. Neural network approach is used to find the reusability index, which give information about software reusability. There were two principle criteria determining which neural network to use. First, a supervised neural network was required. Second, the network needed to be able to classify.
(Selby, R. W., 1988) tried to identify a number of characteristics of those components, from existing systems, that are been reused at NASA laboratory and reported that the developers there has achieved a 32 percent reusability index. (Dunn and Knight, 1991)[6] Also experimented and reported the usefulness of reusable code scavenging. (Chen, Nishimoto and Ramamoorty, 1990) briefly discussed the idea of subsystem extraction by using code information stored in a
relational database. They also described a tool called the C Information Abstraction System to support this process.
(Esteva and Reynolds, 1991)Inductive Learning
techniques based on software metrics are used to identify reusable modules.
(Caldiera and Basili, 1991) A tool, called Care, is used to identify reusable components according to a set of “reusability attributes” based on software metrics.
(Mayobre, 1991) These techniques can be extended and used to help in identifying data communication components.
Chen and Lee developed about 130 reusable C++
components and used these components in a controlled experiment to relate the level of reuse in a program to software productivity and quality. In contrast to Selby, who worked with professional programmers, Chen and Lee’s experiment involved a team of 19 students, who had to design and implement small database system. The software metrics collected included the Halstead size, program volume, program level, estimated difficulty and effort. They found that lower the value of the software complexity metrics, the higher the programmer productivity.
(Richard W. Selby, 2005) discussed that CK metric suit is able to target all the essential attributes of OO-based software.
(Parvinder, 2005) used Tuned and Refined values of the following Metric suit for the reusability data Modeling: A. Weighted methods per class (WMC)
B. Depth of inheritance tree (DIT) C. Number of Children (NOC)
D. Coupling Between Object Classes (CBO) Lack of Cohesion in Methods (LCOM)
III. PRESENT WORK
A. Problem Formulation
reusability is difficult to establish so a Clustering Based approach could serve as an economical, automatic tool to generate reusability ranking of software by formulating the relationship based on its training. The Kmeans based clustering has proved its effectiveness in modeling of data in various domains. Hence, kmeans based clustering approach is experimented for modeling of the reusability of the procedure based systems. Inputs to the clustering system, are provided in form of McCabe’s Cyclometric Complexity Measure for Complexity measurement, Regularity Metric, Halstead Software Science Indicator for Volume indication, Reuse Frequency metric and Coupling Metric values of the software component and output is be obtained in terms of reusability.
B. Methodology
Reusability evaluation System for function Based Software Components can be framed using following steps:
I) Selection and refinement of metrics targeting the quality of function based software system and perform parsing of the software system to generate the Meta information related to that Software. The metric of the Parvinder et. al 2006 is used and the metrics are as under:
The proposed five metrics for function Oriented Paradigm is as follows:
A framework of metrics is proposed for structural analysis of procedure or function-oriented. The code of software is parsed to calculate the metric values. The following suits of metrics are able to target those the essential attributes of function oriented features towards measuring the reusability of software modules, so it tried to analyze, refine and use following metrics to explore different structural dimensions of Function oriented components.
The proposed metrics for Function Oriented Paradigm are as follows:
[a] Cyclometric Complexity Using Mc Cabe’s Measure
According to McCabe, the value of Cyclometric graph, made for the component, where the decisions are made. Hence, the value of CC of a software component should be in between upper and lower bounds as a contribution towards reusability.
If CC is high with high regularity of implementation then there exists high functional usefulness.
[b] Halstead Software Science Indicator
According to this metric volume of the source code of the software component is expressed in the following equation:
)
Where, 1 is the number of distinct operators that appear in the program, 2 is number of distinct operands that appear in the program, N1 is the total number of operator occurrences and N2 is the total number of operand occurrences.
The high volume means that software component needs more maintenance cost, correctness cost and modification cost. On the other hand, less volume increases the extraction cost, identification cost from the repository and packaging cost of the component. So the volume of the reusable component should be in between the two extremes.
[c] Regularity Metric
The notion behind Regularity is to predict length based on some regularity assumptions. As actual length (N) is sum of Regularity of Component coding is calculated as:
N
The above derivation indicates that Regularity is the ratio of estimated length to the actual length. High value of Regularity indicates the high readability, low modification cost and non-redundancy of the component implementation.00
[d] Reuse-Frequency Metric components e.g. printf in C language, then Reuse-Frequency is calculated as: should be some minimum value of Reuse- Frequency to make software component really reusable [24].
[e] Coupling Metric
Functions/methods that are loosely bound tend to be easier to remove and use in other contexts than those that depend heavily on other functions or non-local data. Different types of coupling effects reusability to different extent.
Data Coupling: Data coupling exists between two functions when functions communicate Data Coupling: Data coupling exists between two functions when functions communicate using elementary data items that are passed as parameters between the two.
Stamp Coupling: When two functions communicate using composite data item e.g. structure in C language then that kind of coupling is called Stamp Coupling.
Control Coupling: If data from one function is said to direct the order of instruction execution in another function then Control Coupling is there between those functions.
Let ai be the number of functions called and Data Coupled with function “i”
bi be the number of functions called and Stamp Coupled with function “i”
ci be the number of functions called by function “i” and Control Coupled with function “i”
di be the number of functions Common Coupled with weights of the respective the coupling types.
As coupling increases, there is decrease in understandability and maintainability, so there should be some maximum value of the coupling.
[I] calculate the metric values of the sampled software components.
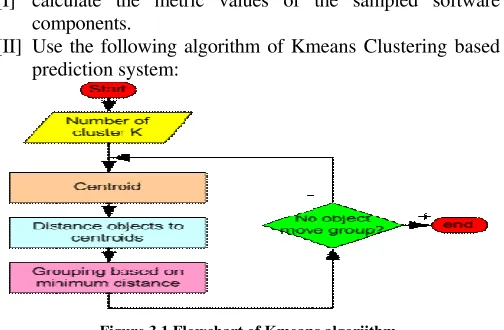
[II] Use the following algorithm of Kmeans Clustering based prediction system:
Figure 3.1 Flowchart of Kmeans algoriithm
Step 1. Begin with a decision on the value of k = number of clusters
Step 2. Put any initial partition that classifies the data into k clusters. You may assign the training samples randomly, or systematically as the following:
[i] Take the first k training sample as single-element clusters [ii] Assign each of the remaining (N-k) training sample to the cluster with the nearest centroid. After each assignment, recomputed the centroid of the gaining cluster.
Step 3. Take each sample in sequence and compute its distance from the centroid of each of the clusters. If a sample is not currently in the cluster with the closest centroid, switch this sample to that cluster and update the centroid of the bigger than the number of cluster, for each data, we calculate the distance to all centroid and get the minimum distance. This data is said belong to the cluster that has minimum distance from this data.
The number of folds is fixed to 10, as long as the number of instances in the training set is not smaller 10. If this is the case the number of folds is set equal to the number of refer to fault-free modules incorrectly labeled as faulty modules. True negatives (TN) correspond to fault-free modules correctly classified as such. Finally, false negatives (FN) refer to faulty modules incorrectly classified as fault-free modules as shown in table 3.1.
Table 3.1. Confusion Matrix of Prediction Outcomes.
Real Data Value of Reusability recall values are calculated described below:
C. Precision
The Precision is the proportion of the examples which truly have class x among all those which were classified as class x. The technique having maximum value of probability of detection and lower value of probability of false alarms is chosen as the best fault prediction technique.
Precision for a class is the number of true positives (i.e. the number of items correctly labeled as belonging to the positive class) divided by the total number of elements labeled as belonging to the positive class (i.e. the sum of true positives and false positives, which are items incorrectly labeled as belonging to the class). The equation is:
D. Recall
Recall in this context is defined as the number of true positives divided by the total number of elements that actually belong to the positive class (i.e. the sum of true positives and false negatives, which are items which were not labeled as belonging to the positive class but should have been) [8]. The
recall can be calculated as follows:
[a] Accuracy
The percentage of the predicted values that match with the expected values of the reusability for the given data.
The best system is that having the high Accuracy, High
Precision andHigh Recall value.
IV. RESULTS AND DISCUSSION
The proposed Neural based methodology is implemented in MATLAB. MATLAB (Matrix Laboratory) environment is one such facility which lends a high performance language for technical computing.
The function oriented dataset considered have the output attribute as Reusability value. The Reusability in the dataset is expressed in terms of six numeric labels i.e. 1, 2, 3, 4, 5 and 6. The label 1 represents Nil and the label 6 represents the Excellent Reusability Label. The statistics of the count of the number of examples of certain reusability label is shown in the Table 4.1. The Graphical representation of the count of the number of examples of certain reusability label is shown in the Figure 4.1
Table 4.1 Statistics of the Reusability Output Attribute in the Dataset
Figure 4.1 Bar-chart of Count of examples of the Reusability Output Attribute in the Dataset
The statistics shows that in the dataset, there are 9 examples of label 1, 10 examples of label 2, 26 examples of label 3, 29 examples of label 4, 17 examples of label 5 and 18 examples of label 6.
The input attribute-wise statistical details of the count of the examples of the labels are shown in figure 4.2, figure 4.3, figure 4.4, figure 4.5, figure 4.6. The input attributes are expressed in the three linguistic labels i.e. 1, 2, and 3. The label 1 corresponds to the Low value, label 2 corresponds to the Medium value and label 3 corresponds to the high value.
Table 4.2 Statistics of the Input Attribute Coupling in the Dataset
Table 4.3 Statistics of the Input Attribute Volume in the Dataset
Table 4.4 Statistics of the Input Attribute Coupling in the Dataset
Table 4.5 Statistics of the Input Attribute Regularity in the Dataset
Table 4.6 Statistics of the Input Attribute Reuse-Frequency in the Dataset
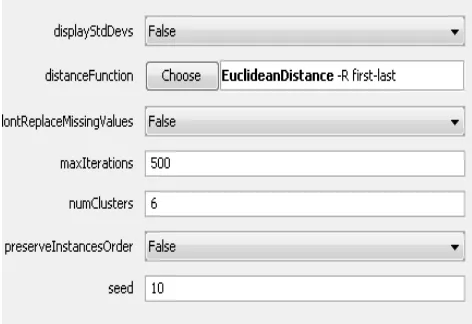
The given data with five Input Attributes i.e. Coupling, Volume, Complexity, Regularity, Reuse_Frequency, and Output attributes is loaded in the Weka environment. First, the Kmeans clustering ignores Reusability output attribute. There following parameters are used in the algorithm:
A. Display StdDevs -- Display std deviations of numeric attributes and counts of nominal attributes is set to ‘False’.
Distance Function -- The distance function to use for instances comparison in which Euclidean Distance is used. The Euclidean distance between points p and q is the length of the line segment connecting them ( don’t Replace
Missing Values -- Replace missing values globally with mean/mode is set to ‘False’.
B. Max Iterations -- maximum number of iterations are set to 500.
D. Preserve Instances Order -- Preserve order of instances is set to ‘False’.
E. Seed -- The random number seed to be used is 10. The snapshot of the parameters set is shown in figure 4.2.
Figure 4.2. Snapshot of the Parameters Set in the Kmeans Clustering Algorithm
The Kmeans clustering algorithm has created clusters numbered as 0 to 5 and assigned the 20 (means 18%) examples to cluster number 0, 24 (means 22%) examples to cluster number 1, 11( means 10%) examples to cluster number 2, 11( means 10%) examples to cluster number 3 and 3 ( means 3%) examples to cluster number 4 and 40 ( means 37%) examples to cluster number 5. Further the cluster numbers are again assigned Predicted Labels as follows:
Table 4.7. The Assignment of Predicted Labels to the Clusters formed by EM
Cluster Number Predicted Label
Cluster 0 5
Cluster 1 6
Cluster 2 2
Cluster 3 1
Cluster 4 3
Cluster 5 4
The confusion matrix calculated is shown in Table 4.8.
Table 4.8 The Confusion Matrix Generated after applying Kmeans Clustering
Real Data Label
Predicted Tabel 1 2 3 4 5 6
1 8 3 0 0 0 0
2 0 5 5 1 0 0
3 0 0 1 2 0 0
4 0 0 12 25 3 0
5 1 1 6 1 11 0
6 0 1 2 0 3 18
The Precision and Recall values for different the Reusability levels if the reusability is shown in table 4.9 and 4.10 respectively.
Table 4.9 Recall Value of Different Classes of the Reusability Values
Reusability Level Class Recall Value
1 0.89
2 0.5
3 0.46
4 0.86
5 0.65
6 1
Table 4.10 Precision Value of Different Classes of the Reusability
As evidenced from the confusion matrix the incorrectly clustered instances are 41 means 37.614% is the inaccuracy value or correctly clustered instances are 68 means the accuracy is approximately 63%.
V. CONCLUSION AND FUTURE SCOPE
A. Conclusion
In this study Kmeans based Clustering approach is evaluated for Reusability Prediction of Function based Software systems. Here, the metric based approach is used for prediction. Reusability value is expressed in the six linguistic values. Five Input metrics are used as Input and clusters are formed using Kmeans algorithm, thereafter 10 fold cross validation performance of the system is recorded. As deduced from the results it is clear that Precision and Recall values of the sixth level reusability class is the maximum, it means the system is able to detect the “Excellent” components precisely. Similarly, Precision and Recall values of the first level reusability class is the second best, it means the system is able to detect the “Non-Reusable” components with good precision.
The proposed technique is showing Accuracy value approximately equal to 63%, so it is satisfactory enough to use the Kmeans based clustering technique for the prediction of the function based reusable modules from the existing reservoir of software components.
B. Future Scope
The research work can be extended in the following
Reusability Level Class Precision Value
1 0.72
2 0.45
3 0.33
4 0.625
5 0.578
6 0.75
Directions:
[a] Intelligent Component Mining or Extraction algorithms can be developed
[b] Early prediction of the quality of component based system [c] Characterization of Software Components for easy
retrieval
VI. REFERENCES
[1] Anderson, J.A (2003) “An Introduction To Neural Networks”, Prentice Hall of India.
[2] Arnold, R.S. (1990) “ Heuristics for Salvaging Reusable Parts From Ada Code”, SPC Technical Report, ADA_REUSE_HEURISTICS-90011-N, March 1990. [3] Arnold, R.S. (1990) “Salvaging Reusable Parts From
Ada Code: A Progress Report”, SPC Technical Report,
SALVAGE_ADA_PARTS_PR-90048-N, September
1990.
[4] Basili, V. R. and Rombach, H. D. (1988) “The TAME Project: Towards Improvement Oriented Software Environments”, IEEE Trans. Software Eng., vol. 14, no. 6, June 1988, pp. 758-771.
[5] Basili, V.R. (1989) “Software Development: A Paradigm for the Future”, Proceedings COMPAC’89, Los Alamitos, California, IEEE CS Press, 1989, pp. 471-485.
[6] Boetticher, G. and Eichmann, D. (1993) “A Neural Network Paradigm for Characterizing Reusable Software”, Proceedings of the Australian Conference on Software Metrics, Australia, July, 1993, pp. 234-237.
[7] Boetticher, G., Srinivas, K. and Eichmann, D. (1990) “A Neural Net-Based Approach to the Software Metrics” Proceedings of the 5th International Conference on Software Engineering and Knowledge Engineering, San Francisco, CA, 14-18 June 1990, pp. 271-274. [8] Caldiera, G. and Basili, V. R. (1991) “Identifying and
Qualifying Reusable Software Components,” IEEE Computer, February 1991.
[9] Chen, Y. F. Nishimoto, M. Y. and Ramamoorty, C. V. “The C Information Abstraction System”, IEEE Trans. on Software Engineering, Vol. 16, No. 3, March 1990. [10] Dunn, M. F. and Knight, J. C. (1993) “Software reuse