Volume 4, No. 6, May 2013 (Special Issue)
International Journal of Advanced Research in Computer Science
REVIEW ARTICAL
Available Online at www.ijarcs.info
CONFERENCE PAPER
Clustering Techniques
Swapnil R. Isod*, Amit M. SahuDepartment of Computer Science
G. H. Raisoni College of Engineering and Management, Amravati [email protected]*, [email protected]
Abstract: The goal of this review is to provide a comprehensive review of different clustering techniques in data mining.
I. INTRODUCTION
Clustering is a division of data into groups of similar objects. Each group, called cluster, consists of objects that are similar between themselves and dissimilar to objects of other groups. Representing data by fewer clusters necessarily loses certain fine details (akin to lossy data compression), but achieves simplification. It represents many data objects by few clusters, and hence, it models data by its clusters. Data modeling puts clustering in a historical perspective rooted in mathematics, statistics and numerical analysis. From a machine learning perspective clusters correspond to hidden patterns, the search for clusters is unsupervised learning, and the resulting system represents a data concept. Therefore, clustering is unsupervised learning of a hidden data concept. Data mining deals with large databases that impose on clustering analysis additional severe computational requirements. These challenges led to the emergence of powerful broadly applicable data mining clustering methods surveyed below.
Figure .1 Data Mining Process
Clustering is often one of the first steps in data mining analysis. It identifies groups of related records that can Be used as a starting point for exploring further relationships. This technique supports the development of population segmentation models, such as demographic-based customer segmentation. Additional analyses using standard analytical and other data mining techniques can determine the characteristics of these segments with respect to some desired outcome. For example, the buying habits of multiple population segments might be compared to determine which segments to target for a new sales campaign.
For example, a company that sales a variety of products may need to know about the sale of all of their products in order to check that what product is giving extensive sale and which is lacking. This is done by data mining techniques. But if the system clusters the products that are giving less sale then only the cluster of such products would have to be checked rather than comparing the sales value of all the products. This is actually to facilitate the mining process.
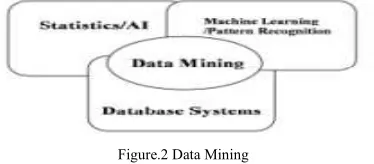
Clustering is a data mining (machine learning) technique used to place data elements into related groups without advance knowledge of the group definitions. Clustering techniques fall into a group of undirected data mining tools. The goal of undirected data mining is to discover structure in the data as a whole. There is no target variable to be predicted, thus no distinction is being made between independent and dependent variables.
Figure.2 Data Mining
Clustering techniques are used for combining observed examples into clusters (groups) which satisfy two main criteria:
a. Each group or cluster is homogeneous; examples that belong to the same group are similar to each other.
b. Each group or cluster should be different from other clusters, that is, examples that belong to one cluster should be different from the examples of other clusters. Depending on the clustering technique, clusters can be expressed indifferent ways:
a) Identified clusters may be exclusive, so that any example belongs to only one cluster.
b) They may be overlapping; an example may belong to several clusters.
c) They may be probabilistic, whereby an example belongs to each cluster with a certain probability.
II. GENERAL TYPES OF CLUSTERS
A. Well-separated clusters:
Swapnil R. Isodet al, International Journal of Advanced Research in Computer Science, 4 (6) Special Issue, May 2013,5-9
CONFERENCE PAPER
B. Center-based clusters:
A cluster is a set of objects such that an object in a cluster is closer (more similar) to the “center” of a cluster, than to the center of any other cluster. The center of a cluster is often a centroid, the average of all the points in the cluster, or a medoid, the most “representative” point of a cluster.
C. Contiguous clusters:
A cluster is a set of points such that a point in a cluster is closer (or more similar) to one or more other points in the cluster than to any point not in the cluster.
D. Density-based clusters:
A cluster is a dense region of points, which is separated by low-density regions, from other regions of high density. Used when the clusters are irregular or intertwined, and when noise and outliers are present.
E. Shared Property or Conceptual Clusters:
Finds clusters that share some common property or represent a particular concept.
F. Described by an Objective Function:
Finds clusters that minimize or maximize an objective function.
III. CLUSTER ANALYSIS
Finding groups of objects such that the objects in a group will be similar (or related) to one another and different from (or unrelated to) the objects in other groups.
Figure.3
Cluster Analysis is very useful without proper analysis implementation of clustering algorithm will not provide good results Cluster analysis is useful to Understand group related documents for browsing, group genes and proteins that have similar functionality, or group stocks with similar price fluctuations and also reduces the size of large data sets. Clustering is equivalent to breaking the graph into connected components, one for each cluster. A good clustering algorithm should have the following properties
A. Scalability:
The ability of the algorithm to perform well with large number of data objects (tuples).
B. Analyze mixture of attribute types:
The ability to analyze single as well as mixtures of attribute types.
C. Find arbitrary-shaped clusters:
The shape usually corresponds to the kinds of clusters an
algorithm can find and we should consider this as a very important thing when choosing a method, since we want to be as general as possible. different types of algorithms will be biased towards finding different types of cluster structures/shapes and it is not always an easy task to determine the shape or the corresponding bias. Especially when categorical attributes are present we may not be able to talk about cluster structures.
D. Minimum requirements for input parameters:
Many clustering algorithms require some user-defined parameters, such as the number of clusters, in order to analyze the data. However, with large datasets and higher imensionalities, it is desirable that a method require only limited guidance from the user, in order to avoid bias over the result.
E. Handling of noise:
Clustering algorithms should be able to handle deviations, in order to improve cluster quality. Deviations are defined as data objects that depart from generally accepted norms of behavior and are also referred to as outliers. Deviation detection is considered as a separate problem.
F. Sensitivity to the order of input records:
The same data set, when presented to certain algorithms in different orders, may produce dramatically different results. The order of input mostly affects algorithms that require a single scan over the data set, leading to locally optimal solutions at every step. Thus, it is crucial that algorithms be insensitive to the order of input.
G. High dimensionality of data:
The number of attributes/dimensions in many data sets is large, and many clustering algorithms cannot handle more than a small number (eight to ten) of dimensions. It is a challenge to cluster high dimensional data sets, such as the U.S. census data set which contains attributes. The appearance of large number of attributes is often termed as the curse of dimensionality. This has to do with the
following A. As the number of attributes becomes larger, the amount of resources required to store or represent them grows. B. The distance of a given point from the nearest and furthest neighbor is almost the same, for awide variety of distributions and distance functions. Both of the above highly influence the efficiency of a clustering algorithm, since it would need more time to process the data, while at the same time the resulting clusters would be of very poor quality.
H. Interpretability and usability:
Most of the times, it is expected that clustering algorithms produce usable and interpretable results. But when it comes to comparing the results with reconceived ideas or constraints, some techniques fail to be satisfactory. Therefore, easy to understand results are highly desirable..
IV. CLASSIFICATION OF CLUSTERING
Swapnil R. Isodet al, International Journal of Advanced Research in Computer Science, 4 (6) Special Issue, May 2013,5-9
CONFERENCE PAPER
Categorization of clustering is neither straightforward, nor canonical. In reality, groups below overlap.
A. Hierarchical Methods:
Hierarchical clustering is a method of cluster analysis which seeks to build a hierarchyof clusters. . The basics of hierarchical clustering include Lance-Williams formula, idea of conceptual clustering, now classic algorithms SLINK, COBWEB, as well as newer algorithms CURE and CHAMELEON. The hierarchical algorithms build clusters gradually (as crystals are grown)Strategies for hierarchical clustering generally fall into two types: In hierarchical clustering the data are not partitioned into a particular, which may run from a single cluster containing all objects to n clusters each containing a single object. Hierarchical Clustering is subdivided into agglomerative methods, which
proceed by series of fusions of the n objects into groups, and
divisive methods, which separate n objects successively into
finer groupings. Agglomerative techniques are more commonly used, and this is the method implemented in XLMiner?. Hierarchical clustering may be represented by a two dimensional diagram known as dendrogram which illustrates the fusions or divisions made at each successive stageofanalysis.
a. Agglomerative:
This is a "bottom up" approach: each observation starts in its own cluster, and pairs of clusters are merged as one moves up the hierarchy. The algorithm forms clusters in a bottom-up manner, as follows:
a) Initially, put each article in its own cluster.
b) Among all current clusters, pick the two clusters with the smallest distance.
c) Replace these two clusters with a new cluster, formed by merging the two original ones.
d) Repeat the above two steps until there is only one remaining cluster in the pool. Thus, the agglomerative clustering algorithm will result in a binary cluster tree with single article clusters as its leaf nodes and a root node containing all the articles.
b. Divisive Algorithm:
This is a "top down" approach: all observations start in one cluster, and splits are performed recursively as one moves down the hierarchy.
a) Put all objects in one cluster
b) Repeat until all clusters are singletons (a). Choose a cluster to split
(b).Replace the chosen cluster with the sub-cluster
c. Advantages of hierarchal clustering:
a) Embedded flexibility regarding the level of granularity. b) Ease of handling any forms of similarity or distance. c) Applicability to any attribute type.
d. Disadvantages of hierarchal clustering:
a) Vagueness of termination criteria.
b) Most hierarchal algorithm do not revisit once constructed clusters with the purpose of improvement
B. Partitioning Methods:
The partitioning methods generally result in a set of M clusters, each object belonging to one cluster. Each cluster may be represented by a centroid or a cluster representative; this is some sort of summary description of all the objects contained in a cluster. The precise form of this description will depend on the type of the object which is being clustered. In case where real-valued data is available, the arithmetic mean of the attribute vectors for all objects within a cluster provides an appropriate representative; alternative types of centroid may be required in other cases, e.g., a cluster of documents can be represented by a list of those keywords that occur in some minimum number of documents within a cluster. If the number of the clusters is large, the centroids can be further clustered to produces hierarchy within a dataset.
Figure.5
There are many methods of partitioning clustering
a. K-means Methods:
In k-means case a cluster is represented by its centroid, which is a mean (usually weighted average) of points within a cluster. This works conveniently only with numerical attributes and can be negatively affected by a single outlier. The k-means algorithm [Hartigan 1975; Hartigan & Wong 1979] is by far the most popular clustering tool used in scientific and industrial applications. The name comes from representing each of k clusters C by the mean (or weighted average) c of its points, the so-called centroid. While this obviously does not work well with a categorical attributes, it has the good geometric and statistical sense for numerical attributes. The sum of discrepancies between a point and its centroid expressed through appropriate distance is used as the objective function. Each point is assigned to the cluster with the closest centroid Number of clusters, K, must be specified.the basic algo is as follows The basic algorithm is very simple
a) Select K points as initial centroids. b) Repeat
Swapnil R. Isodet al, International Journal of Advanced Research in Computer Science, 4 (6) Special Issue, May 2013,5-9
CONFERENCE PAPER
d) Recompute the centroid of each cluster until centroid does not change.
(a). limitations of K-means:
K-means has problems when clusters are of differing Sizes, Densities, Non-globular shapes and K-means has problems when the data contains outliers.
b. Bisecting K Means Method:
This is an extension of K-Means method .the basic concept is as follows that to obtain k clusters split the set of all points into two clusters select one of them and split and repeat this process until the K clusters have been produced.
c. Medoids Method:
K-medoid is the most appropriate data point within a cluster that represents it. Representation by k-medoids has
two advantages. First, it presents no limitations on attributes types, and, second, the choice of medoids is dictated by the location of a predominant fraction of points inside a cluster and, therefore, it is lesser sensitive to the presence of outliers. When medoids are selected, clusters are defined as subsets of points close to respective medoids, and the objective function is defined as the averaged distance or another dissimilarity measure between a point and its medoid. K medoids method has two versions
a) PAM (Partitioning Around Medoids): PAM:
Is iterative optimization that combines relocation of points between perspective clusters with re-nominating the points as potential medoids. The guiding principle for the process is the effect on an objective function,
b) CLARA (Clustering LARge Applications):
CLARA uses several (five) samples, each with 40+2k points, which are each subjected to PAM. The whole dataset is assigned to resulting medoids, the objective function is computed, and the best system of medoids is retained.
c) Probabilistic Clustering:
In the probabilistic approach, data is considered to be a sample independently drawn from a mixture model of several probability distributions [McLachlan & Basford 1988].The main assumption is that data points are generated by, first, randomly picking a model j with probability гj, j = 1:K and, second, by drawing a point x from a corresponding distribution. The area around the mean of each (supposedly unimodal) distribution constitutes a natural cluster. So we associate the cluster with the corresponding distribution.s parameters such as mean, variance, etc. Each data point carries not only its (observable) attributes, but also a (hidden) cluster ID (class in pattern recognition). Each point x is assumed to belong to one and only one cluster, and we can estimate the probabilities of the assignment.
Probabilistic clustering has some important features
(a). It can be modified to handle recodes of complex structure
(b).It can be stopped and resumed with consecutive batches of data, since clusters have representation totally different from sets of points
(c). At any stage of iterative process the intermediate mixture model can be used to assign cases (on-line property)
(d).It results in easily interpretable cluster system
C. Density-Based Algorithms:
Density-based algorithms are capable of discovering clusters of arbitrary shapes. Also this provides a natural protection against outliers. These algorithms group objects according to specific density objective functions. Density is usually defined as the number of objects in a particular neighborhood of a data objects. In these approaches a given cluster continues growing as long as the number of objects in the neighborhood. exceeds some parameter. this is type of clustering can be of two types.
a. Density-Based Connectivity Clustering:
Swapnil R. Isodet al, International Journal of Advanced Research in Computer Science, 4 (6) Special Issue, May 2013,5-9
CONFERENCE PAPER
factorized into maximal connected components serving as clusters.The points that are not connected to any core point are declared to be outliers (they are not covered by any cluster). The non-core points inside a cluster represent its boundary.Finally, core objects are internal points. Processing is independent of data ordering. So far, nothing requires any limitations on the dimension or attribute types.
b. Density Functions Clustering:
In this density function is used to compute the density. Overall density is modeled as the sum of the density functionsof all objects;. Clusters are determined by density attractors,where density attractors are local maxima of the
overall density function. The influence function can be an arbitraryone.
V. CONCLUSIONS
Clustering lies at the heart of data analysis and data mining applications. The ability to discover highly correlated regions of objects when their number becomes very large is highly desirable, as data sets grow and their
properties and data interrelationships change. At the same time, it is notable that any clustering “is a division of the objects into groups based on a set of rules – it is neither true nor false”
VI. REFERENCES
[1]. M. Marin, A. van, Deursen, and L. Moonen. Identifying Aspects Using Fan-in Analysis. In Proceedings of the 11th
Working Conference on Reverse Engineering (WCRE2004), pages 132_141. IEEE Computer Society, 2004.
[2]. G. S. Moldovan and G. Serban. Aspect Mining using a Vector-Space Model Based Clustering Approach. In Proceedings of Linking Aspect Technology and Evolution Workshop (LATE 2006), Bonn, Germany, March 2006. [3]. G. S. Moldovan and G. Serban. Quality Measures for
Evaluating the Results of Clustering Based Aspect Mining Techniques. In Proceedings of Towards Evaluation of Aspect Mining (TEAM), ECOOP, 2006, to be published.