pISSN 2320-1770 | eISSN 2320-1789
Research Article
Relation of endometrial thickness and pregnancy rates in intrauterine
insemination following ovulation induction
Jayant Kr. Biswas
1, Bandhu H. C.
2, Harpreet Singh
3, Madhusudan Dey
2*
INTRODUCTION
Infertility is defined as failure to conceive after one year of practicing unprotected sexual intercourse without any contraceptive measures. Primary infertility is defined when pregnancy has never occurred. Secondary infertility is defined when the couple had conceived previously (irrespective of results of that pregnancy), but is unable to conceive again after a year of trying.1
Infertility statistics show considerable variation 16%, 8%
The cause of infertility is never found in around 10-15% couples. Relative prevalence of the etiologies of infertility are like- male factor 25–40%, female factor 40– 55%, both male and female factors 10% and unexplained infertility 10%. Approximate prevalence of the causes of infertility in the females are - ovulatory dysfunction 30– 40%, tubal or peritoneal factor 30–40%, unexplained infertility 10–15% and miscellaneous causes 10–15%.1
In unexplained infertility, OI and IUI are offered to the couple as first line of treatment and the rate of conception
1Department of Obstetrics & Gynaecology,164 Military Hosp, C/O 99 APO, India
2Department of Obstetrics & Gynaecology, Armed Forces Medical College, Pune, Maharashtra, India 3SHO, Jalandhar Cantt, Punjab, India
Received: 29 October 2015
Accepted: 11 December 2015
*Correspondence:
Dr.Madhusudan Dey, E-mail: deym1@yahoo.com
Copyright: © the author(s), publisher and licensee Medip Academy. This is an open-access article distributed under the terms of the Creative Commons Attribution Non-Commercial License, which permits unrestricted non-commercial use, distribution, and reproduction in any medium, provided the original work is properly cited.
ABSTRACT
Background: Controlled ovarian hyper stimulation (COH) using different agents with intrauterine insemination (IUI) are known treatment for infertility. Endometrial thickness (ET) is one of the predicting factors for clinical pregnancy along with other parameters. Many studies have been done in the past to find factors affecting the growth and maturity of the endometrium in women in IUI, but indigenous Indian studies regarding its relation with pregnancy were either limited or the results were unclear.
Methods: A Prospective observational study was undertaken for assessing effects of clomiphene citrate (CC) and human menopausal gonadotropin (hMG) stimulated cycles on the ET and clinical pregnancy in single IUI cycle. Infertility cases were studied in two groups; Group A [ovulation induction (OI) with CC and IUI; n=101] and Group B (OI with hMG and IUI; n=103) after randomization using random number table as per standard protocol.
Results: Comparable data obtained in mean age, duration of infertility, female and male factors in both groups. Mean ET on day of IUI in Group A and B was 8.35+2.08mm and 10.87+2.54mm respectively (p value <0.001). Range of ET in clinical pregnancies in Group A (n= 15) were 8.0- 12.9mm and 9.0- 12.9mm in Group B (n= 26). Ongoing pregnancies beyond 1st trimester were higher in Group B (n= 25) than Group A (n= 14).
Conclusions: Mean ET and clinical pregnancy rate both were higher in hMG group compared to CC. This study identified an ‘optimum endometrial thickness’ (9.0-12.9mm) for achieving clinical pregnancy in hMG group.
may be in the stimulation protocol, number or the size of follicles, effect of ovulatory drugs on the endometrium (thickness or the transformation to secretory phase), the day and number of IUIs carried out etc. The anatomic and physiological changes in the functional endometrium under the influence of endogenous gonadotropins (proliferative to secretory phase) and how it behaves for the implantation of the embryo during post-ovulation period is important for resulting in pregnancy.2
Many studies have been conducted in the past to find out the factors affecting endometrium in women but the results are still unclear. With this background in mind, the present study was undertaken with an aim to study the comparison of effects of CC and hMG stimulated cycles on the ET in IUI in one cycle and to establish any relation between ET on the day of IUI and achieving clinical pregnancy in these stimulated cycles.
METHODS
A Prospective observational study was carried out at the Assisted Reproductive Technology Centre of a tertiary care hospital from Nov 2011 to Aug 2013 among couples attending the OPD with primary infertility including unexplained infertility, PCOS, ovulatory dysfunction, with normal/ mild male factor subfertility (semen count up to 10 million/ml) and combination of factors mentioned above and were willing to participate in the study.
Approval for this study protocol and clearance were obtained from the Ethical Review Committee of the hospital.
Sample size was calculated considering 95% confidence level with an accuracy of 90%. Sample size was calculated to be 100 cycles in each group. Considering 5% might be ‘lost to follow-up’, 105 cases in each group were studied and analyzed subsequently.
Exclusion criteria includes abnormal HSG/ laparoscopy suggestive of pelvic adhesions with altered tubo-ovarian relationship, major Mullerian malformations or, tubal blockage, cases with uro-genital infections including tuberculosis, bacterial vaginosis, mucopurulent
cervico-vaginal discharge, pelvic infections, major
endocrinological cause for infertility like
hypogonadotropic hypogonadism, primary amenorrhea, premature ovarian failure, secondary infertility cases, failed cases of OI, IUI or IVF, other severe male factor contributing to infertility (aspermia, azoospermia, teratozoospermia, obstructive causes etc).
Simple randomization using random number table (Microsoft Excel 2007) was used for enrolled patients. Ovarian stimulation was done after performing baseline trans-vaginal sonography (TVS) on day 2 of menstrual
cycle. CC 100 mg daily from D2 to D6 of the cycle or, Inj hMG 75IU, IM (step up protocol) from D2 to D8 of the cycle was given respectively in Group A and B. The response was monitored with serial TVS starting from D 9 of the cycle at 1-3 day interval for measurement of number and diameter of follicles and ET. The ovulation trigger with Inj hCG 10000IU was administered intramuscularly on appropriate day considering leading follicular size of 18-20 mm. Monitoring of the follicular response and ET were done with B-mode imaging using wide band micro-convex endocavity probe with 4.5- 8.5/D6 MHz frequency specially used for obstetrics and gynecological purpose. Semen preparation was done by standard ‘Swim-up’ technique and insemination was done 36- 48 hours after hCG trigger. All patients were advised for intercourse for next 3 days and vaginal micronized progesterone support was provided for 21 days following IUI. Follow-up were done when next menstruation was missed with urine pregnancy test (UPT) and sonography as per standard international infertility management protocol.3-6
Primary outcomes measured were- ET on day of IUI in both groups, number of ‘no’ pregnancy, number of ‘biochemical’ pregnancies (UPT positive without gestation sac on sonography) and number of sonological/ clinical pregnancies diagnosed by appearance of gestational sac.
Secondary outcomes measured were- Number of spontaneous abortions (pregnancy wastage) confirmed by histological evidence of ‘product of conceptus’ when dilatation and curettage performed in those cases, number of multiple pregnancies, number of ectopic pregnancies, number of ongoing intrauterine pregnancies (with sonologically confirmed embryonic or fetal cardiac activity) and number of cycles with complication (ovarian hyperstimulation syndrome-OHSS)
Data entry and statistical analysis were done using SPSS (Statistical package for social sciences) version 14.0 software.
RESULTS
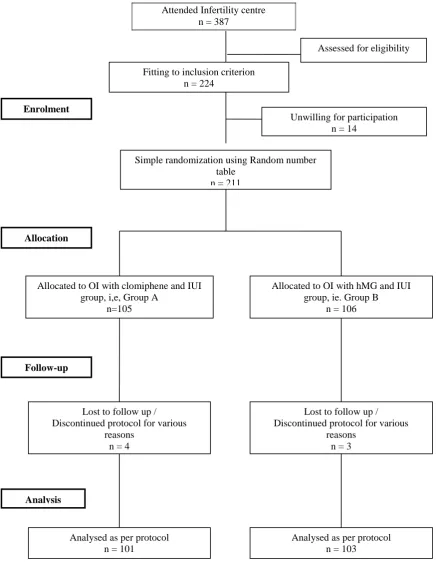
Figure 1: Flow chart - study participants from enrolment to final analysis.
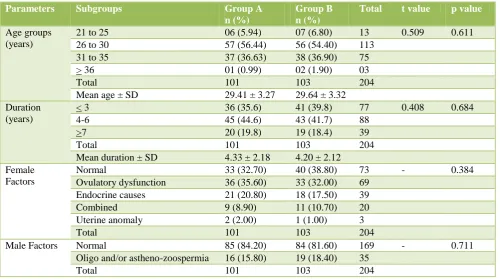
Different demographic parameters of study participants (i.e. age, duration of infertility, female and male factors) were tabulated in Table 1.
Mean ET on day 2 of menstrual cycle were 2.64± 0.693 mm in Group A and 2.52±0.623 mm in Group B respectively. Difference in mean ET on day of IUI in both groups (10.87±2.542 mm in Group B Vs 8.35± Attended Infertility centre
n = 387
Unwilling for participation n = 14
Allocated to OI with clomiphene and IUI group, i,e, Group A
n=105
Lost to follow up / Discontinued protocol for various
reasons n = 4
Analysed as per protocol n = 101
Allocated to OI with hMG and IUI group, ie. Group B
n = 106
Lost to follow up / Discontinued protocol for various
[image:3.595.50.487.75.643.2]reasons n = 3 Simple randomization using Random number
table n = 211 Fitting to inclusion criterion
n = 224
Analysed as per protocol n = 103
Enrolment
Allocation
Follow-up
Analysis
Table 1: Demographic and other parameters (n = 204).
Parameters Subgroups Group A
n (%)
Group B n (%)
Total t value p value
Age groups (years)
21 to 25 06 (5.94) 07 (6.80) 13 0.509 0.611
26 to 30 57 (56.44) 56 (54.40) 113
31 to 35 37 (36.63) 38 (36.90) 75
> 36 01 (0.99) 02 (1.90) 03
Total 101 103 204
Mean age ± SD 29.41 ± 3.27 29.64 ± 3.32
Duration (years)
< 3 36 (35.6) 41 (39.8) 77 0.408 0.684
4-6 45 (44.6) 43 (41.7) 88
>7 20 (19.8) 19 (18.4) 39
Total 101 103 204
Mean duration ± SD 4.33 ± 2.18 4.20 ± 2.12
Female Factors
Normal 33 (32.70) 40 (38.80) 73 - 0.384
Ovulatory dysfunction 36 (35.60) 33 (32.00) 69
Endocrine causes 21 (20.80) 18 (17.50) 39
Combined 9 (8.90) 11 (10.70) 20
Uterine anomaly 2 (2.00) 1 (1.00) 3
Total 101 103 204
Male Factors Normal 85 (84.20) 84 (81.60) 169 - 0.711
Oligo and/or astheno-zoospermia 16 (15.80) 19 (18.40) 35
Total 101 103 204
Mean dominant follicular diameter in both groups were not much different (18.93±0.44 mm in Group A Vs 19.10±0.44 mm in Group B), but significantly high in Group B (p value = 0.005).
Change in mean ET in respect of conception was significant in Group A (p value <0.001) but not in Group B (p value=0.83). Change in mean ET in clinical pregnancy cases in Group A was 2.35 mm (p value <0.001) but unchanged in Group B (p value: statistically not significant) (Table 2).
Table 2: Relation of change in mean endometrial thickness on day of IUI with total conception rate and clinical conception rate in both groups (n = 204).
Type of conception
Group Conception n Change in mean ET ± SD (mean ET on day
of IUI – mean ET on day 2) ± SD in mm
p value
Total conception
Group A Yes 20 7.82 ± 2.13 < 0.001
No 81 5.19 ± 1.92
Group B Yes 35 8.32 ± 1.61 0.83
No 68 8.42 ± 2.90
Clinical conception
Group A Yes 15 10.35 ± 1.47 <0.001
No 86 8.00 ± 1.98
Group B Yes 26 10.87 ± 1.15 Not significant
No 77 10.87 ± 2.87
All group Yes 41 10.68 + 1.28 <0.001
No 163 9.36 + 2.83
Biochemical pregnancies were 5 in Group A (p value =0.087) and 9 in Group B (p value <0.001). Clinical pregnancies were 15 in Group A and 26 in Group B. 14 and 25 cases out of those continued beyond 1st trimester
[image:4.595.46.556.520.673.2]Table 3: Types of pregnancy wise distribution of endometrial thickness on day of IUI (n= 204).
Type of pregnancy
Group Pregnancy (Yes/ No)
ET on day of IUI in mm Total P
value <
6.9
7.0 - 8.9 9.0 - 10.9 11.0 - 12.9 13.0 - 14.9 > 15 Biochemical
pregnancy
A Yes 0 3 0 1 1 0 5 0.087
No 25 45 16 8 2 0 96
B Yes 0 4 0 2 2 1 9 <0.001
No 8 7 40 13 26 0 94
Clinical Pregnancy
A Yes 0 3 7 5 0 0 15 <0.001
No 25 45 9 4 3 0 86
B Yes 0 0 13 13 0 0 26 <0.001
No 8 11 27 2 28 1 77
Ongoing Pregnancy
A Yes 0 3 6 5 0 0 14 <0.001
No 25 45 10 4 3 0 87
B Yes 0 0 12 13 0 0 25 <0.001
No 8 11 28 2 28 1 78
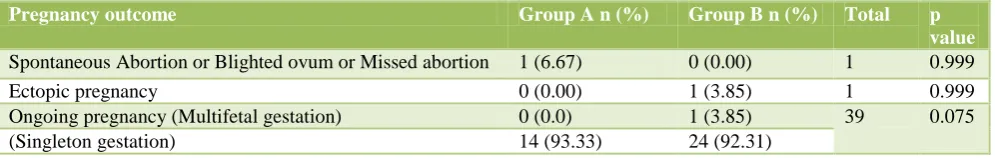
Table 4: Clinical pregnancy outcomes in both groups (n= 41).
Pregnancy outcome Group A n (%) Group B n (%) Total p
value
Spontaneous Abortion or Blighted ovum or Missed abortion 1 (6.67) 0 (0.00) 1 0.999
Ectopic pregnancy 0 (0.00) 1 (3.85) 1 0.999
Ongoing pregnancy (Multifetal gestation) 0 (0.0) 1 (3.85) 39 0.075
(Singleton gestation) 14 (93.33) 24 (92.31)
DISCUSSION
COH with IUI remains a widely used treatment modality for a broad range of indications including cervical factor, mild endometriosis, male subfertility, ovulatory dysfunction and unexplained infertility.7
The reported pregnancy rates per cycle ranges from 8 to 22% in different studies.8-10 Several prognostic factors and treatment outcomes have been identified (like- patient profile, stimulation protocol, follicular response, ET, semen parameters, timing and numbers of IUIs). The results in literatures concerning the impact of ET on successful pregnancy rate are very disparate. Many studies identified a ‘threshold’ thickness needed to obtain a successful pregnancy. According to different studies the optimal thickness is between 8 and 15 mm.11-13 In this study, ‘threshold’ ET for CC was 8.0-12.9 mm and 9.0- 12.9 mm for hMG.
Significant higher mean ET with use of hMG was observed compared to that with CC in this study (p value <0.001). The fact of having a smaller mean ET using CC can be explained by antiestrogenic effect of CC on the endometrium.
No pregnancy resulted when ET was <6 mm, 6.9% pregnancies were observed when ET was between 6-8 mm and 12.6% when ET was of ≥9 mm.14
18.2%, 36.3% and 38.2% of total pregnancy cumulatively observed
ranges respectively in this study. Total 74.5% had conceived when ET was between 9.0-12.9 mm. Only 5.5% and 1.8% cases got pregnant in 13-14.9 mm and >15 mm ranges respectively and no conception noted when ET was <6.9 mm on day of IUI.
This study showed significant differences (p value = 0.027) in total conception rate with different agents used for OI (n = 20, 19.80% with CC and n = 35, 33.98% with hMG). There was no difference (p value = 0.407) in biochemical pregnancies in two groups. Clinical pregnancy rate was also not significant in this study (p value = 0.081) in different groups (n = 15 in CC Vs n = 26 in hMG). Ongoing pregnancies are higher in hMG group in comparison to CC (n = 14 in CC and n = 25 in hMG) but without significance (p value = 0.075).
Difference in mean ET on day of IUI was significant in Group A but not in Group B in cases with clinical pregnancy. Thus, increased ET is not related to increased clinical pregnancy rates statistically, but definitely a ‘threshold’ ET for clinical pregnancy can be inferred. That is 8.0-12.9 mm in Group A and 9.0-12.9 mm in Group B.
[image:5.595.52.550.301.380.2]ovum or missed abortion) or ectopic pregnancy as well as difference in complication (OHSS) rate.
CONCLUSIONS
Adequate and optimum endometrial development is required for a successful pregnancy to occur. Though it was not concluded statistically that increased ET on day of IUI was related to increased clinical pregnancy, but ET of 8- 12.9 mm was required for successful pregnancies in both type of OI agents followed by IUI in single cycle. But, further studies with more sample size are needed to compare ET on day of IUI using more different methods and for more cycles for optimizing successful IUI protocol.
Funding: No funding sources Conflict of interest: None declared
Ethical approval: The study was approved by the Institutional Ethics Committee
REFERENCES
1. Burney RO, Schust DJ, Yao MWM. Infertility. In: Berek JS, 14 eds. Berek & Novak’s Gynecology. New Delhi: Lippincott Williams & Wilkins. 2007: 1185-1276.
2. Cunningham FG, Leveno KJ, Bloom SL, Hauth JC, Rouse DJ, Spong CY. From Williams Obstetrics, USA. McGraw-Hill Companies; 2010. Figure 3-2, Photomicrographs illustrating endometrial changes during menstrual cycle; p-38.
3. Dodge ST, Strickler RC, Keller DW. Ovulation induction with low doses of clomiphene citrate.ObstetGynecol. 1986;67:63S.
4. Randall JM, Templeton A. Transvaginal sonographic assessment of follicular and endometrial growth in spontaneous and clomiphene citrate cycles. FertilSteril. 1991;56(2):208-12.
5. Diamond MP, Wentz AC. Ovulation induction with human menopausal gonadotropins. Obstet Gynecol Surv. 1986;41(8):480-90.
6. Verhulst SM, Cohlen BJ, Hughes E, TeVelde E, Heineman MJ. Intrauterine insemination for
unexplained subfertility. Cochrane Database Syst Rev .2006;18:CD001838.
7. Nuojua-Huttunen S, C Thomas C, Bloigu R, Tuomivaara L, Martikainen H. Intrauterine insemination treatment in subfertility: an analysis of limiting factors affecting outcome. Hum Reprod. 1999;14:698-703.
8. Tomlinson MJ, Amissah-Arthur JB, Thompson KA, Kasraie JL, Bentick B. Prognostic indicators for intrauterine insemination (IUI): statistical model of IUI success. Hum Reprod .1996;11:1892-6.
9. Check JH, Davies E, Adelson H. A randomized prospective study comparing pregnancy rates following clomiphene citrate and human menopausal gonadotrophin therapy. Hum Reprod. 1992;7:801-5. 10. Ecochard R, Mathieu C, Royere D, Blache G,
Rabilloud M, Czyba JC. A randomized prospective study comparing pregnancy rates after clomiphene citrate and human menopausal gonadotropin before intrauterine insemination. FertilSteril. 2000;73:90-3.
11. Coulam CB, Soenksen DM, Britten S.
Ultrasonographic predictors of implantation after assisted reproduction. FertilSteril. 1994;62:1004–10. 12. Schild RL, Eschweiler S, Van Der Ven H, Fimmers
R, Hansmann M. Three dimensional endometrial volume calculation and pregnancy rate in an in vitro fertilization programme. Hum Reprod.1999; 14:1255–8.
13. Kupesic S. Three-dimensional ultrasonographic uterine vascularisation and embryo implantation. J Gynecol Obstet Biol Reprod. 2004;33:S18–20.
14. Dickey RP, Olar TT, Taylor SN, Curole DN, Matulich EM. Relationship of endometrial thickness and pattern to fecundity in ovulation induction cycles: effect of clomiphene citrate alone and with human menopausal gonadotropin. Fertil Steril. 1993;59:756-60.