Volume 6, No. 1, Jan-Feb 2015
International Journal of Advanced Research in Computer Science
RESEARCH PAPER
Available Online at www.ijarcs.info
ISSN No. 0976-5697
Using Change Detection and Classification Methods to Study the Al-ahwaz Marshal
using Landsat-7 ETM Images
Alyaa Hussein Ali
Physical Department/ College of Science for women University of Baghdad
Iraq , Bagdad [email protected]
Maysaa Raba Naeemah
Physical Department/ College of Science for women University of Baghdad
Iraq , Bagdad [email protected]
Israa Jameel Muhsin
Physical Department/ College of Science
University of Baghdad Iraq , Bagdad [email protected]
Abstract:In this paper, six bands data sets taken from the landsat-7 ETM (Enhanced Thematic Mapper ) to determine the changes which occur in Al-Ahwaz marshal during 2000 and 2013. Different methods were used to study the changes which occur in this region the subtraction method which Image Difference (ID) and the (PCA) method which is Principal Component Analysis. Campaign the (PCA) with (ID) to produce the best way to detect the changes. The unsupervised classification process which is the modified (K-mean) is used to classify the changes occur in the marshal region and the area surrounding it. This type of classification depend on the color and distance between the classes, a hybrid methods which are the (ID) with the K-mean and PCA of (ID) with the K-mean were implemented to produced the best change detection regions.
Keywords:PCA, Image Subtraction, Modified K-mean
I. INTRODUCTION
Remote sensing can be defined as the collection and interpretation of information about an object without being in physical contact with the object. Aircraft and satellites are the common platforms for remote sensing of the earth and its natural resources. A sensor is a device that measures and records electromagnetic energy. Sensors can be divided into two groups. Passive sensors depend on an external source of energy, usually the sun. The most common passive sensor is the photographic camera. Active sensors have their own source of energy, an example would be a radar gun. These sensors send out a signal and measure the amount reflected back. Active sensors are more controlled because they do not depend upon varying illumination conditions [1]. Remote sensing can generally used to study the change detection which occur during different time. There are different methods which can be used to monitoring the changes. The most common one is the PCA and the traditional methods. Also, the classification process gives good indication about the changes which occurs during the years. The best un- supervised classification method is the K-mean.
II. CHANGE DETECTION METHODS
Change detection methods were used to detect and identify the temporal changes in the scene so that the selection of the appropriate method takes on considerable significance for detecting the changes. The technique of PCA produces good estimates of change. Most studies using PCA for change
detection tried to attach physical interpretation, it represents the most empirical approach to mapping change[2].
The digital image change detection can be performed by several methods [3].
1- Image differencing 2- Image addition 3- Image rationing 4- Image multiplication
5- Principal component analysis (PCA)
The K-means algorithm is one of the simplest and most efficient unsupervised learning algorithms to solve clustering problems in image segmentation. K-means algorithm tends to perform better for homogeneous surface/object as desert area [4][5].
III. ARITHMETIC OPERATIONS
Arithmetic operations are performed on a pixel by pixel basis between two or more images. The actual mechanics of implementing arithmetic operations can be done sequentially, one pixel at a time, or in parallel, where all operations are performed simultaneously. There are four arithmetic operations (addition, subtraction, multiplication and division) that can be applied on an image at the same coordinate system [6].
A. Image Subtraction
and negative values representing the change areas and zero value represented no change [2].This operation is also performed on a pixel by pixel basis. In this technique, images of the same area, obtained from times t1 and t2, are subtracted pixel wise. Mathematically, the difference image which can be represented as follows [7].
. ...(1)
Where and are the images obtained from and , are the coordinates of the pixels. The resulting image, , represents the intensity difference of from . This technique works only if images are registered.
B. Principal Component Analysis
Principal Component Analysis (PCA) is the general name for a technique which uses mathematical principles to transforms a number of possibly correlated variables into a smaller number of variables called principal components. Principal Component Analysis (PCA) is the transformation of the multivariate data to a new set of components where data variation can be expressed by a first few components. PCA achieves this by removing the redundancy in the data set. This redundancy is quantified by the correlation of the variables. Hence, PCA transforms a correlated set of data to an uncorrelated set [8][7].
The mean position of the pixels in the space is defined by the expected value of the pixel vector x, according to equation (2)
...(2)
Where (m) is the mean pixel vector and the are the individual pixel vectors of total number k; ε is the expectation operator. While the mean vector is useful to define the average or expected position of the pixels in multispectral vector space, it is the value to have available means by which their scatter or spread is described. This is the role of the covariance matrix which is defined as covariance matrix [9].
The covariance matrix takes the form of correlation matrix whose elements represented the covariance between the images. The diagonal elements of covariance matrix are the variance of each element.
The eigenvector and eigenvalue of the covariance matrix denoted by and respectively where i= 1, 2, 3….N×N where N is the dimension of the image.
The transformation matrix consists of the eigenvector of the covariance matrix.
To compute the principal component the covariance matrix should be diagonalized.
The eigenvalue are which are uncorrelated [10][2] .
PCA has traditionally been used in remote sensing as a means of data compaction. For a typical multispectral image band set, it is common to find that the first two or three components are able to explain virtually all of the original variability in reflectance values. Later components thus tend to be dominated by noise effects. By rejecting these later components, the volume of data is reduced with no appreciable loss of information. Given that the later components are dominated by noise, it is also possible to use PCA as a noise removal technique [11].
IV. THE STUDY AREA
Maysan is one of Iraq's eighteen provinces, it lies in southeastern section of Iraq, within the precipitation valley. The total area of the province is 16072 square kilometers representing 3.7% of the total area of Iraq. The total population in the province of Maysan is about 920,315 people living and resettle differentiated between rural and urban, and it is comprised of 6 districts and 9 regions .This province is bordered from the north by the Waist Province, from the east by Iran, from the west by Dhi Qar province, and from the south by Basra province figure (1-4). Regarding its astronomical location, it lies between latitudes 35"15 – 32"45 north and longitudes 46"30 – 47"30 east [12] .
Figure (1) Maysan Province
The geographical nature of the province is divided between land and water, where the marshlands form more than 40% of the total area extending between its southern and southeastern parts as well as the southwestern part. In addition to that, Degla River flows in the middle of the province, with its numerous branches such as Al-Magar River, al-Mashrah, and Al-Amara, in addition to many branches originating from the eastern side of the province. As for the land areas of the province, they are characterized by being flat in most part, except for some of the eastern areas bordering Iran, which are characterized by the presence of hills that are considered an extension to the Hamreen Mountain Series.
With respect to the features of the surface, it includes several forms, the most important of which are the Degla River banks and its high streams, the low riverbed areas, as well as the marshlands and swamp areas that were dried up during the previous regime, but efforts now continue to rehabilitate them . . . (3)
. . . . . (4)
borders with the Islamic Republic of Iran, and whose height exceeds (135m) above sea level in some areas. Ripples of valleys lie at the bases of those hills.
The province climate also the annual rate of maximum temperature is 31.5 degrees centigrade, and the minimum temperature is 17.1 degrees centigrade, With respect to rain, the total annual rainfall is 161mm, falling during the period from October till March, and rarely falls during the remaining months of the year . and various types of winds that blow over Maysan[12].
V. METHODOLOGY
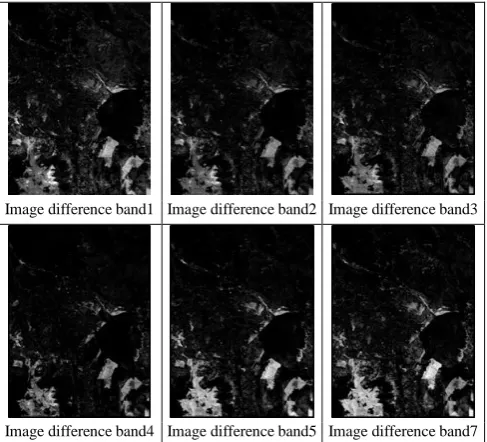
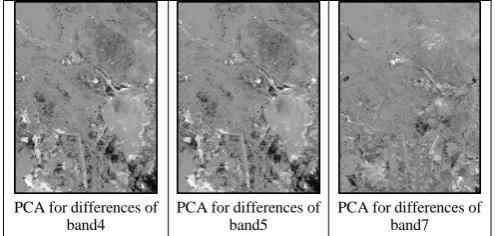
Our search focused on detecting the changes occur during (2000 and 2013). Six bands have been taken for the south of Iraq. Table (1) represented the bands information, the first method which is used to detect the changes is the subtraction, figure (2) shows the six bands images for southeastern section of Iraq for two different time, figure (3) shows the image difference between 2000 and 2013. The two images must precisely registered, figure (4) shows the PCA of the images shown in figure (3) the image differences
Table (1) application of the Landsat-7(Enhanced Thematic Mapper) [13].
Band 1of study area 2000 Band 2of study area
2000
Band 3of study area 2000
Band 4of study area 2000 Band 5of study area
2000
Band 7of study area 2000
Band 1of study area 2013 Band 2of study area
2013
Band 3of study area 2013
Band 4of study area 2013 Band 5of study area
2013
Band 7of study area 2013
Figure(2) shows the six bands images for southeastern section of Iraq (2000,2013).
Image difference band1 Image difference band2 Image difference band3
Image difference band4 Image difference band5 Image difference band7
Figure(3). Shows image differences (2013-2000).
PCA for differences of band1
PCA for differences of band2
[image:3.595.307.552.54.172.2] [image:3.595.305.553.55.324.2] [image:3.595.35.289.335.752.2] [image:3.595.308.552.357.578.2]PCA for differences of band4
PCA for differences of band5
PCA for differences of band7
Figure(4). Shows the PCA of image differences (2013-2000).
VI. MODIFIED K-MEAN
In our study the modified k-mean clustering which depend on the color and distance of the classes has been used. The classes are grouped depend on the color and distance.
Where distance is measured between points and the
cluster center , is set containing elements of cluster and is number of clusters. Algorithm consists of following steps [14] .
1. In a set of N points , corresponding to image pixels ,
choose points as initial cluster centers ( centroids )
2. Assign each point to nearest cluster based on its distance
from cluster center .
3. For each cluster compute a mean of each cluster and
set the mean as new cluster center .
4. Repeat the steps 2 and 3 until the centroids no longer move.
VII. CLASSIFICATION OF SUBTRACTED IMAGES
The subtraction is an ordinary method to find the changes occur in the images so, the result of the subtraction process has been adopted to be with the K-means process to produce the real changes occur between 2000 and 2013. Figure (5) shows the classes for each PCA after the (BPD) which we call it (PCD). Figure(6) shows the classes for each band pair difference (BPD).The PCA after the (BPD) has been colored using the density slicing process the classification , show only three classes and the other two classes appear dark, they does not carry any information . as we know the first principal component has the most information so the last PCs have no important information's. Figure(7) represented the graphical distribution of the changed area. Table (2) shows the statistical properties which give indication about the changes during these years.
Figure (5) Shows the Classification of PCD
The table (2) shows the statistical properties of the classification of Subtracted Images
Class Area mean Correlation Stander
deviation PC1 13078 0. 0135 0. 735 0. 0808 PC2 34694 0. 0266 0.8931 0.1069 PC3 89994 0.3133 0.7966 0.2044
Class1 11063 0. 0106 0. 9295 0. 0661
Class2 13255 0. 0148 0. 6637 0. 0876
Class3 13678 0. 0113 0. 9376 0. 0691
Class4 13869 0. 0137 0. 8428 0. 0800
Class5 12527 0. 0142 0. 6593 0. 0854
Class6 11745 0. 0191 0.6512 0.1065
Class of BPD1 Class of BPD 2 Class of BPD 3
Class of BPD4 Class of BPD 5 Class of BPD 7
Figure(6).Shows the classification of the Subtracted Images.
Figure (7) Area of classes of subtracted images using K-Mean classifier technique
VIII. CONCLUSION
[image:4.595.34.282.54.172.2] [image:4.595.307.555.479.589.2] [image:4.595.35.282.668.781.2]calculated to show the changes as can be seen some area increased and other decreased
IX. REFERENCES
[1] sanderson, R,. ,’Introduction to remote sensing 'New mexico state university. Introduction to Remote Sensing and Image Processing.
[2] Ali, H.A. (1999). Studying the Flooded Area by Principal ComponentAnalysis of Multi-Temporal Landsat Thematic Mapper Data, College of Science , Dep. Physics , Al-Nahrain University, Baghdad, Iraq. (MSc, thesis).
[3] Celik, T.(2009). Unsupervised Change Detection in Satellite ImagesUsing Principal Component Analysis and k-Means Clustering . IEEE Geoscience
[4] Hung, C., Purnawan, H., Kuo, B., Letkeman, S.(2009). Multispectal Image Classification Using Rough Set Theory and Particle Swam Optimization, Advances in Geoscience and Remote Sensing, Jedlovec. G.(ed), Intech, ch 28. pp.569-596.
[5] Lasaponara, R., Masini, N. Satellite Remote Sensing A New Tool for Archaeology, Series: Remote Sensing and Digital Image Processing, Vol. 16, Dordrecht, The Netherlands, Springer, 2012, 364pp.
[6] Nidhi, Kumari, P. Brain Tumor And Edema Detection Using Matlab7.6.0.324 , International Journal Of
Computer Engineering & Technology (IJCET), Volume 5, Issue 3, March (2014), pp. 122-131.
[7] Ilsever, M., Unsalan, C. Two-Dimensional Change Detection Methods, Remote Sensing Applications. pp.71. Springer, London (2012).
[8] Russ, J. C. The Image Processing Handbook (Third Edition). CRC Press LLC (1999).
[9] Richards , J.A, Jia, X. (2006).Remote Sensing Digital Image Analysis:An Introduction, 4th edition : Springer – Verlag, New York, PP 439.
[10] Gonzalez, R. C. and Woods, R. E. (2008). Digital Image Processing, 3rd ed., Prentice Hall, Upper Saddle River, NJ.
[11] Eastman, J. R. Idrisi Andes Guide to GIS and Image Processing, , Clark University, Worcester, 2006.
[12] Republic of Iraq Ministry of Planning. Maysan Provincial Development Strategy. Iraq Information Portal, Web.sep,2011.
[13] Canada Centre for Remote Sensing. 2007. Tutorial: Fundamentals of Remote Sensing.
http://www.ccrs.nrcan.gc.ca/resource/tutor/fundam/chapter 2/08_e.php.
[14] ] Šarić, M., Dujmić, H., & Russo, M. (2013). Scene Text