212
Load Frequency Control For Multi-Area Power System
Using PWS
Mahasathyavathi.M
1, Yoganandhan.U.P
2, Balasubramani.R
3, Jeeva.L
4Department of EEE1,2,3,4, Assistant Professor1, P.G.Scholar2,3,4, INFO Institute of Engineering, Coimbatore. Email: [email protected]1 , [email protected]2 , [email protected]3 ,
Abstract-Every load works under the constant normal frequency, the process to maintain that frequency level at a normal level in a generating station is called load frequency control and it‟s also regulates real power. It is a process to regulate power sharing between neighboring areas while holding the frequency constant. The main objective of this work is to minimize the transient response of IEEE 9 bus test system and also evaluate the individual contribution of the generator in maintaining the tie-line power deviation and frequency deviation by introducing various disturbances like load variation (20MW increase/decrease, 60MW increase/decrease) and fault (Balanced three phase fault) in the test system. For comparison of load frequency control performance, the settling time of frequency deviation and tie-line power deviation within the acceptable limit respectively.
Index Terms-Load Frequency Control, Multi-Area, IEEE 9 Bus System, PowerWorld Simulator.
Nomenclature:
ACE - Area Control Error
AGC - Automatic Generation Control ATC - Available Transfer Capability AVR - Automatic Voltage Regulation B - Tie-Line Frequency Bias ess - Steady-State Error
IEEE - Institute Of Electrical And Electronics Engineers
LFC - Load Frequency Control LODF - Line Outage Distribution Factor Mp - Maximum Overshoot
ms - Millisecond MW - Megawatt
OPF - Optimal Power Flow PG - Real Power load side
PL - Real Power in load side
Ptie - Tie-Line Power
PTDF - Power Transfer Distribution Factor p.u - Per Unit
PWS - Power World Simulator
QG - Reactive Power in Generating side
QL - Reactive Power in Load side
SCOPF - Security Constrained Optimal Power Flow
td - Delay Time (ms)
tp - Peak Time (ms)
tr - Rise Time (ms)
ts - Settling Time (ms)
Vspc - Specified Voltage
X‟d - Synchronous Reactance Xt - Transient Reactance ∆Ptie - Tie-Line Power Deviation
∆f - Frequency Deviation
1. INTRODUCTION
Automatic Generation Control (AGC) is a system for adjusting the power output of multiple generators at different power plants, in response to changes in the load. AGC plays an important role in the large-scale multi-area interconnected power systems because of its real power control (load frequency control (LFC)) and reactive power control (Automatic voltage regulator (AVR)). This work is mainly focused on technical issues associated with the load-frequency control (LFC) in conventional thermal, hydro, wind interconnected power systems and addresses new generalized dynamic models for the interconnected electric power to maintain the frequency in specified limit. On the basic of performance evaluation carried out for load frequency control of multi areas interconnected power system using PWS.
213 mechanical input to the turbine. The system oscillation
is serious in single area system compared to two area system because all the load change in load is to be met by only one area. [6]. The load frequency of two area interconnected power system is controlled by both conventional PID and fuzzy logic controllers in MATLAB. [7]. PowerWorld is applicable for power flow analysis when considering smart grid technologies and it is also able to produce very accurate simulations in accordance with the theoretical results. [8]. This paper presents the determination of ATC using Power Transfer Distribution Factors and Participation Factors for multi-area cases. [9]. the control scheme guarantees that the fluctuations of the load frequency converge to a range, which can be made very small. Simulation results for a three-area power system are given to illustrate the developed theoretical results. [10]. The self-tuning controller through speed governor control and excitation control is derived by defining a cost function with a term for presenting the constraints on the control effort, and then by minimising it with respect to the control vector. [11]. the application of self-tuning regulators is suggested as a suitable alternative to the integral control, used normally for load frequency control. Adaptive control strategy is found to be very effective in improving the stability and transient response of the system. [12]. this paper studies control of load frequency in two area power system with PID controller. In this study, PID parameters are tuned using different adaptation techniques by using MATLAB. [13]. Variable, non-linear tie-line frequency bias is a better simulation of electric system frequency response than fixed straight line bias because it recognizes the variable nature of a system's reaction to frequency changes.
This work is mainly focused on technical issues associated with the load-frequency control (LFC) in IEEE standard 9 Bus interconnected power systems and addresses new generalized dynamic models for the electric power to maintain the frequency in specified limit. On the basic of performance evaluation carried out for load frequency control of multi areas interconnected power in PWS.
The text is to be typeset in 10 pt roman, single spaced with baselineskip of 13 pt. Text area is 5 inches in width and the height is 8 inches (including running head). Final pagination and insertion of running titles will be done by the publisher. Upon acceptance, authors are required to submit their data source file including postscript files for figures.
2. SYSTEM DESCRIPTION
2.1. Load Frequency Control
In electrical grid all synchronous generators operate in synchronism and deliver the power to the load. When load on the generator increases, the rotor of synchronous generator slows down resulting in
reduction in the frequency of the grid. However, the governors associated with the generators will act and tries to bring back the frequency to the normal value. The control of frequency by the action of governors associated with turbine-generators is called “primary frequency control”.
Governors control the frequency by providing more steam to the turbine or more water to the turbine. However, at times the frequency control by governors alone is not adequate and secondary frequency control is required. In “secondary frequency control” the loading on different plants is changed according to the instructions given by the load dispatcher.
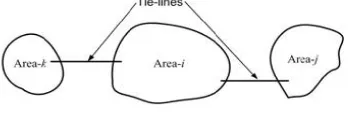
[image:2.595.310.513.306.419.2]2.2. Multi-Area Interconnected Power System As two area interconnected power system connected through a tie line is shown in Fig.1. Each area feeds its control area and tie line allows electric power to flow between the areas.
Fig. 1. A Two Area Interconnected Power System
A single control area is characterized by the same frequency throughout. In other words, the area network is „rigid‟ or „strong‟. In the case of a two area system, it is assumed that each area is individually „strong‟ and the two areas are connected by a „weak‟ tie line. An interconnected power system may consist of any number of subsystems or areas.
2.3. Tie-Line
Modern day power systems are divided into various areas. If there are five regional grids. Each of these areas is generally interconnected to its neighboring areas. The transmission lines that connect an area to its neighboring area are called tie-lines. Power sharing between two areas occurs through these tie-lines. In this paper, we used two area power systems. Area 1 and Area 2 are interconnected by a tie-line.
[image:2.595.331.506.686.744.2]214
3. AUTOMATIC GENERATION CONTROL
The main objective of power system operation and control is to maintain continuous power supply with an acceptable quality, to every consumers in the system. The system will be in equilibrium, when there is a balance between the power demand and the power generated. As the power in AC form has real and reactive components: the real power balance, as well as reactive power balance is to be achieved.
There are two basic control mechanisms used to achieve reactive power (acceptable voltage profile) balance and real power (acceptable frequency profile) balance. The former is called Automatic Voltage Regulator (AVR) and the later is called the Load Frequency Control (LFC). An electrical grid may have many types of generators and loads; generators must be controlled to maintain stable operation of the system.
The actual operation of the power system requires a form of speed control. The basic controller for speed is the governor which maintains control of the "prime mover" energy of a generator in response to generator speed. All governors on all the generators within a power system work in parallel because all generators are locked together in synchronism. Application of this concept alone could adequately control a power system provided all the tie-lines could withstand the resultant power flows. However, several improvements to system operations are implemented when a master control supervises the governor settings. These improvements include: Ability to determine the individual system loads and allow each system to carry its own load. Maintaining tie-line flows to interconnected utilities to allow accounting of power sales between utilities.
The AGC includes the following things:
Speed Governor
Turbine
Synchronous generator
Transformer
Tie-line
Dynamic characteristics
AVR
LFC
4. POWERWORLD SIMULATOR
Power World Simulator (Simulator) is a power system simulation package designed from the ground up to be user-friendly and highly interactive. Simulator has the power for serious engineering analysis, but it is also so interactive and graphical that it can be used to explain power system operations to non-technical audiences. With this we‟ve continued to make Simulator more powerful and easier to use with the addition of a number of major new features and hundreds of smaller enhancements.
Simulator consists of a number of integrated products. At its core is a comprehensive, robust Power Flow Solution engine capable of efficiently solving
systems of up to 250,000 buses. This makes Simulator quite useful as a stand-alone power flow analysis package. Unlike other commercially available power flow packages, however, Simulator allows the user to visualize the system through the use of full-colour animated one-line diagrams complete with zooming and panning capability. System models can be either modified on the fly or built from scratch using Simulator‟s full-featured graphical case editor. Transmission lines can be switched in (or out) of service, new transmission or generation can be added, and new transactions can be established, all with a few mouse clicks. Simulator‟s extensive use of graphics and animation greatly increases the user‟s understanding of system characteristics, problems, and constraints, as well as how to remedy them.
The base package of Simulator is capable of solving power systems comprised of up to 250,000 buses. The base package also contains all the tools necessary to perform integrated economic dispatch, area transaction economic analysis, power transfer distribution factor (PTDF) computation, short circuit analysis, and contingency analysis. All of the above features and tools are easily accessible through a consistent and colourful visual interface. These features are so well integrated that you will be up and running within minutes of installation.
Advantage:
Timing in ms.
Real time unit, like MW for tie-line power and Hz for frequency.
5. PROBLEM FORMULATION
The major problem are dynamic and transient performance for three area system. By means of minimizing the overshoot, undershoot and ACE, peak time, settling time.
ACEi= ∆ Pij + ßi∆f Eq. (1) To minimize the frequency and tie-line power deviations within the normal values.
To calculate tie-line power flow, ∆P12(s)=
[∆ f1(s)-∆f2(s)] Eq. (2)
The constrains for the analysis is ∆f1 min ≤ ∆f1 ≤ ∆f1 max
∆f2 min ≤ ∆f2 ≤ ∆f2 max
215
[image:4.595.321.515.452.724.2]6. TEST SYSTEM
Fig. 3. One-Line Diagram of Test System (Three Area Power System)
Area 1 – Bus 1, 4, 6 – Thermal Power Plant Area 2 – Bus 2, 5, 7 – Thermal Power Plant Area 3 – Bus 3, 8, 9 – Hydro Power Plant
Power Flow (PF) is the first step to analyze in any power system. Many methods are available. By full Newton - Raphson method PF is found. Initially generator 1 generates 0MW. Because it is a slack bus. After applying Newton-Raphson method, Generator 1 generates 92MW.
7. SIMULATION & RESULT DISCUSSION
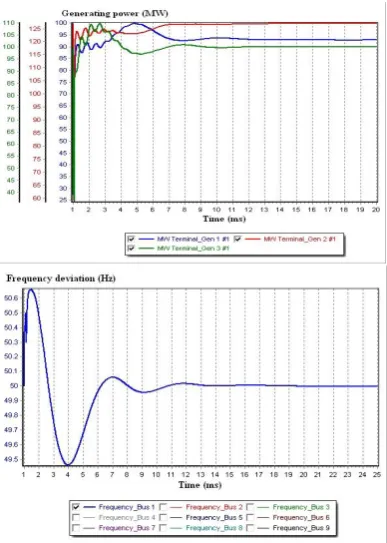
The main objective of LFC is to regulate the frequency and tie line power deviation between interconnected power systems. This section deals the tie line power deviation, frequency deviation results for the two area (thermal-thermal-hydro) system with the three phase fault and load disturbance (increase or decrease) in area 2.
Various disturbances are given as follows:
Balanced three phase fault in area 2.
20MW and 60MW load increases in area 2.
216 Fig. 4. Output Waveform of and For
[image:5.595.313.525.80.514.2]Balanced Three Phase Fault in Area 2
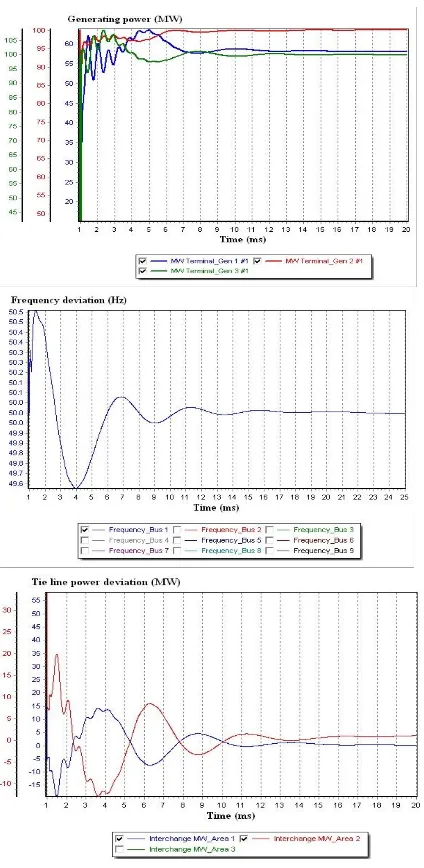
Fig. 5. Output Waveform of and For
20 MW Decreasing Load in Area 2
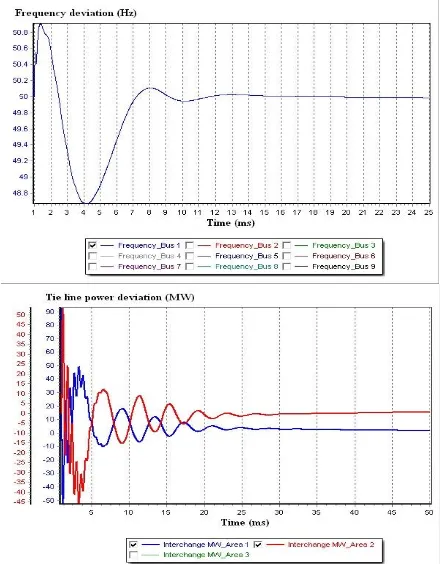
Fig. 6. Output Waveform of and For
[image:5.595.76.291.279.709.2]217 Fig. 7. Output Waveform of and For
[image:6.595.306.526.72.354.2]20 MW Increasing Load in Area 2
Fig. 8. Output Waveform of and For 60 MW Increasing Load in Area 2
Table 1. Frequency Deviation (Load Decreases in Area 2)
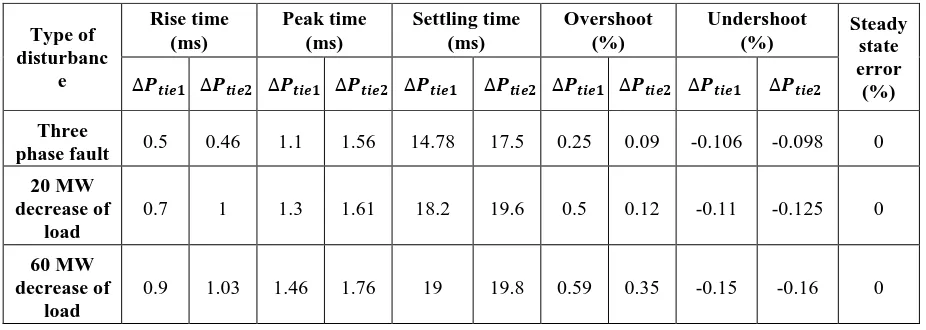
Table 2. Tie-Line Power Deviation (Load Decreases in Area 2)
Type of disturbance
Rise time (ms)
Peak time (ms)
Settling time (ms)
Overshoot (%)
Undershoot (%)
Steady state error
(%)
Three phase fault 0.46 1.2 13.24 0.426 0.42 0
20 MW decrease of
load 0.79 1.6 23 0.5 0.56 0
60 MW decrease of
load 0.99 1.82 24.6 0.54 0.61 0
Type of disturbance Rise time (ms)
Peak time (ms)
Settling time (ms)
Overshoot (%)
Undershoot (%) Steady state error
(%)
Three phase fault 0.46 1.2 13.24 0.426 0.42 0
20 MW increase of load
[image:6.595.79.292.74.365.2]218 Table 3. Frequency Deviation (Load Increases in Area 2)
The control objective of LFC is to achieve tie line power deviation to be settled within 20ms and frequency deviation is to be settled within 18ms. When load is at 20 MW, the tie line power settling time is within the acceptable limit of 18.79ms. Whereas in other cases, the decrease of i.e. 60 MW load is applied when the frequency deviation and tie line power settling time is beyond the limit i.e. 22.69ms and 42ms. Table 1 provides the dynamic parameters for the frequency deviation, when load is decreased at area 2.
The control objective of LFC is to achieve tie line power deviation to be settled within 20ms and frequency deviation is to be settled within 18ms. When load is at 20 MW, the tie line power settling time is within the acceptable limit of 19.25ms. Whereas in other cases, the increase of i.e. 60 MW
load is applied when the frequency deviation and tie-line power settling time is beyond the limit i.e. 25.16ms and 47.8ms. Table 2 provides the dynamic parameters for the frequency deviation, when load is decreased at area 2.
Table 3 & 4 gives the dynamic parameters for the frequency deviation and tie line power deviation, when load is increased in area 2 by 20 MW and 60 MW. When load is increased more, the stability of the system is lost. For example 60 MW load, the settling time is 36ms and the frequency deviation oscillates more and also tie line power deviation is high. 20 MW increased load results the settling time is within the acceptable limit, rise time, peak time is also minimum. But in other cases settling time is more.
Table 4. Tie-Line Power Deviation (Load Increases in Area 2) 60 MW increase of
load
0.99 1.82 24.6 0.54 0.88 0
Type of disturbanc
e
Rise time (ms)
Peak time (ms)
Settling time (ms)
Overshoot (%)
Undershoot (%)
Steady state error (%)
Three
phase fault 0.5 0.46 1.1 1.56 14.78 17.5 0.25 0.09 -0.106 -0.098 0
20 MW decrease of
load
0.7 1 1.3 1.61 18.2 19.6 0.5 0.12 -0.11 -0.125 0
60 MW decrease of
load
0.9 1.03 1.46 1.76 19 19.8 0.59 0.35 -0.15 -0.16 0
Type of disturban
ce
Rise time (ms) Peak time (ms)
Settling time (ms)
Overshoot (%)
Undershoot
(%) Stead
y state error
(%)
Three phase fault
0.5 0.46 1.1 1.56 14.78 17.5 0.25 0.09 -0.106 -0.098 0
20 MW increase of load
0.65 0.9 1.41 1.75 19.5 20 0.71 0.813 -0.2 -0.25 0
60 MW increase of load
219
8. CONCLUSION
Simulation are performed for a three area test systems. Change in transient response for applications of various load disturbances and balanced faults are carried out. Settling time, Peak time, Rise time, Undershoot, Overshoot and Steady state error are within the acceptable limit and best result for Power World Simulator PWS compared to LabVIEW conventional controllers. PWS is used for the transient stability performance using Load frequency control with the model of generators as first attempt in this work. This work well for the test system considered for all kind of disturbance and results are encountering to suit the real time operation.
ACKNOWLEDGMENTS
The authors acknowledge the Department of EEE, Principal and the management of INFO Institute of Engineering, Tamilnadu, for their constant support in doing this work.
REFERENCES
[1] Lokanatha M, Vasu K, “Load Frequency Control of Two Area Power System using PID Controller” (IJERT) (2012).
[2] Melo T R, Silva J J et.al, “Implementation of a Decentralized PID Control System on an Experimental Platform Using LabVIEW” (IEEE) (2017).
[3] Sabahi1 K, Nekoui M A et.al, “Load Frequency Control in Interconnected Power System Using Modified Dynamic Neural Networks” (IEEE) (2007).
[4] Shanmuga sundaram V, Dr.Jayabarathi T, “Load Frequency Control Using PID Tuned ANN Controller in Power System” (IEEE) (2007). [5] Adil Usman, Divakar BP, “Simulation Study of
Load Frequency Control of Single and Two Area Systems” (IEEE) (2012).
[6] Rajendra Murmu, Sohan Lal Hembram et.al, “Load Frequency Control of Two Area Power System Using PID and Fuzzy Logic Controller” (IJTRD) (2016).
[7] Chao Zuo, Bowen Wang, Min Zhang, Mustafa A. Khanwala, Shuping Dang, “Power Flow Analysis Using PowerWorld: a Comprehensive Testing Report” (IEEE) (2015).
[8] B. V. Manikandan, S. Charles Raja, and P. Venkatesh. “Multi-Area Available Transfer Capability Determination in the Restructured Electricity Market” (IEEE) (2015).
[9] Zribi M, Al-Rashed M et.al, “Adaptive decentralized load frequency control of multi-area power systems”, (EPES) (2005).
[10]Katsumi Yamashita, Hayao Miyagi, “Multivariable self-tuning regulator for load frequency control system with interaction of voltage on load demand”, (IEEP) (2009).
[11]Jagannathan Kanniah, Tripathy S C, “Micro processor-based adaptive load-frequency control”, (IEEP) (1984).
[12]Mohamed Mahmoud Ismail, Mohamed Ahmed Moustafa Hassan, “Load Frequency Control Adaptation Using Artificial Intelligent Techniques for One and Two Different Areas Power System”, (IJCAS) (2012).