ABSTRACT
SHOEMAKER, DOUGLAS ALLEN. The Role of Spatial Heterogeneity and Urban Pattern in Modulating Ecosystem Services. (Under the direction of Ross Meentemeyer).
The shift of global populations to cities heralds a new epoch marked by human impact, the Anthropocene, and with it radical changes to the biosphere. Some of the most significant change has occurred in developing countries, where amenity migration to rural areas within commuting distance of expanding urban centers has fundamentally restructured the configuration, hydrology and ecologies of surrounding watersheds. The export of
urbanization to the countryside is manifested by rapid conversions of greenfields to
impervious covers designed for human use, conversions that have consumed and fragmented networks of green infrastructure supporting growing populations. While the benefits of urbanization to human populations have been substantial, the ability of novel and evolving landscapes to sustain the production of environmental services, such as the ability to purify water, sequester climate-changing carbon, and harbor biodiversity, is poorly understood and historically shown to be compromised. The pace of urbanization, and particularly the
combinatorial effects of climate change and development-caused hydrological alteration, has made the task of managing landscapes for human well-being increasingly difficult. Given the persistence of land change drivers such as urban population growth, there is a critical need to describe the trajectory of land cover change using both theory and projection, and anticipate impacts associated with urban form in order to proactively respond to environmental
vulnerabilities.
environmental systems. However, a lack of concise theory regarding urban pattern and process, and the paucity of representative case study, has left the role of spatial structure in modulating ecosystem function largely unexplored. To overcome some of these challenges, I describe a series of three related studies where I used a novel integration of land change and ecosystem services simulations in order to map and measure the co-evolution of human and natural systems in transitioning socio-ecological landscapes (SEL), and generate ecosystem-scale cause and effect data. In the first study I used this data to estimate the costs of water-borne non-point source pollution, carbon sequestration, and land cover based revenues for a rapidly urbanizing model system over a 24 year period. I also compared the effect associated with alternative patterns of urban growth, contrasting sprawl, infill and de-regulated
scenarios with business as usual trends to gauge the effectiveness of environmental planning paradigms, such as “smart growth”. In the second, I tested the capacity a leading theory to
They emphasize the utility of integrated urban growth-ecosystem service analyses in order to anticipate environmental trade-offs likely required by society. My findings emphasize the need for ecosystem service analyses to more adequately understand development tradeoffs in the metropolitan context. We conclude that not all urban growth impacts environments evenly, and that by controlling the compositional mix, configuration and connectedness, not just the amount of development, we can influence more benign environmental outcomes. To reduce environmental impacts regionally, planners are advised to manage amplifying effects of development by maintaining land cover diversity, and limiting the connectivity of
The Role of Spatial Heterogeneity and Urban Pattern in Modulating Ecosystem Services
by
Douglas Allen Shoemaker
A dissertation submitted to the Graduate Faculty of North Carolina State University
in partial fulfillment of the requirements for the Degree of
Doctor of Philosophy
Forestry and Environmental Resources
Raleigh, North Carolina 2016
APPROVED BY:
_______________________________ _______________________________
Dr. Ross Meentemeyer Dr. Todd BenDor
Committee Chair
_______________________________ _______________________________
DEDICATION
BIOGRAPHY
Douglas Allen Shoemaker was born in Washington, DC, on August 26, 1962, first of three sons to Wayne and Joanne Shoemaker. Raised in a Levitt Town in the nearby suburbs
ACKNOWLEDGMENTS
I thank my collaborators and colleagues from NC State University, and my cohort at the Landscape Dynamics Lab: Anna Petrosova, Ashwin Shashidharan, Anna Klevtcova, Biasong Chen, Brenden Harmon, Brian Pickard, Chris Jones, Devon Gaydos, Georgina Sanchez, Jelena Vukomanovic, Leslie Smart,Whalen Dillon and Vaclav Petras.
I am indebted to Monica Dorning (USGS), Jennifer Koch (OU), Matthew Rubino (USGS), and John Vogler for their technical contributions to the framing and analysis of these projects.
I offer a special appreciation to Post-Doctoral Scholars Francesco Tonini and Derek van Berkel for their candor and professionalism.
TABLE OF CONTENTS
LIST OF TABLES ………..……. ix
LIST OF FIGURES...………..…... x
INTRODUCTION..………... 1
CHAPTER 1: URBAN MODELING AND SCENARIO ANALYSIS OF EFFECTS OF METROPOLITAN STRUCTURE ON ECOSYSTEM SERVICES……….... 5
1.1 Abstract………. 5
1.2 Introduction………... 6
1.3 Methods……… 11
1.3.1 Study System……… 12
1.3.2 Urban Growth Projections……… 13
1.3.3 Alternative Pattern Scenarios………... 16
1.3.4 Water Purification Modeling……… 17
1.3.5 Carbon Sequestration……….... 20
1.3.6 Urban Biodiversity……… 21
1.3.7 Returns to Landowners………. 22
1.4 Results……….. 23
1.4.1 Historical and Business as Usual Mapping……….. 23
1.4.2 Regional Responses to Alternative Pattern Scenarios………….. 24
1.4.3 Landowner Revenues and Trade-offs………....…... 26
1.5 Discussion………. 27
1.6 Conclusion……… 30
CHAPTER 2: STRUCTURAL EQUATION ANALYSIS OF THE ROLE OF URBAN PATTERN IN GENERATING ECOSYTEM SERVICES………...… 39
2.1 Abstract………....…. 39
2.2 Introduction……….. 40
2.3 Methods……… 44
2.3.1 Development of a Structural Equation Model……….. 44
2.3.2 Study System……… 46
2.3.3 Data Development: Urban Pattern Scenarios………... 47
2.3.4 Data Development: Ecosystem Services……….. 49
2.3.5 Testing the Structural Equation Model……… 50
2.4 Results……….. 51
2.4.1 Land Cover Mapping and Projections of Alternative Futures…. 51 2.4.2 Structural Equation Analyses………... 53
2.4.3 Spatial Resilience………. 56
2.5 Discussion……… 57
2.5.1 Summary……….. 57
2.5.2 Development of Theory………... 59
CHAPTER 3: COEVOLUTION OF CONNECTIVITY IN SOCIO
ECOLOGICAL LANDSCAPES……….……… 73
3.1 Abstract……… 73
3.2 Introduction……….. 74
3.3 Methods……… 77
3.3.1 Study Area……… 77
3.3.2 Data Development: Human Dimensions……….. 79
3.3.3 Estimating Connectivity………...…… 80
3.4 Results……….. 83
3.4.1 Simulated Landscapes……….. 83
3.4.2 Unsupervised Classification of Subwatersheds Into Typologies………..…….. 84
3.4.3 Mapping the Gradient of Land Conversions……… 84
3.4.4 Mapping Connectivity using Flow, Effective Distance and DWF……….. 85
3.4.5 Comparing Indices: How Connectivity Varies Along an Urban Gradient……….…… 86
3.4.6 The Role of Scenario Spatial Configuration in Connectivity….. 87
3.5 Discussion……… 88
3.5.1 Implications for Management ……….. 89
CONCLUSION………...…. 98
APPENDICES.……….. 112 Appendix A: Urban Growth Projections..………... 113 Appendix B: Water Purification and Valuation Modeling ………... 115
LIST OF TABLES
Table 1.1 Ecosystem Services Associated with Landscape Composition,
Pattern and Change by Scenario (2006-2030)…... 31 Table 2.1 Simulated Environmental Response to Scenarios of Change………..… 59 Table 3.1 Landscape Composition, Pattern and Change by Urbanization
LIST OF FIGURES
Figure 1.1 Charlotte Metropolitan Study System..………...…. 33 Figure 1.2 Scenario Analyses of Ecosystem Service (ES) Costs 2006-2030
in $USD (2015)……… 34 Figure 1.3 Scenario Analyses of Habitat Area Projections for 2030………….…… 35 Figure 1.4 Scenario Analyses of Ecosystem Services Costs and Projected
Returns to Landowners Attributed to Land Cover Revenues
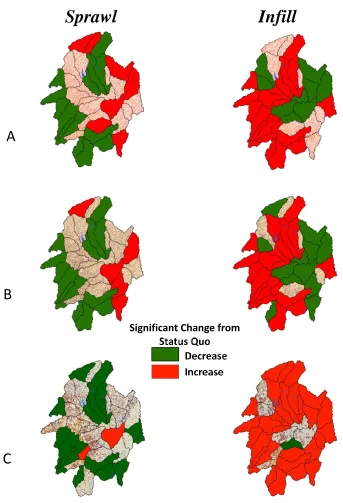
2006-2030 in $USD (2015)..……….... 36 Figure 1.5 Local change in Ecosystem Services Attributed to Land Cover
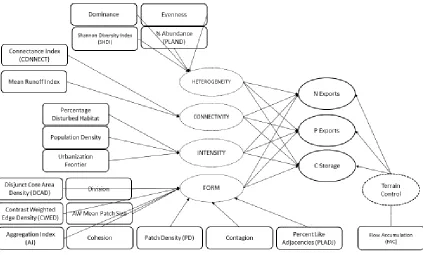
Configuration as Compared to Business as Usual…...……… 37 Figure 1.6 Subwatershed Environmental Sensitivity to Configuration…...……….. 38 Figure 2.1 Graphic Diagramming of Causal Relationships Referencing
the Simple Translation of the Alberti et al. Conceptual Model (2005; Figure 1) Used to Develop a Series of Hypotheses
Exploring the Relationship Between Urban Pattern Components of
Fragmentation and Environmental Effect………...……. 63
Figure 2.2 Study System………...………. 64
Figure 2.3 Initial “Over-Specified” Structural Equation Model Used to
Test Causal Diagram (Fig. 2.1)………...……. 65 Figure 2.4 Revised SEM Found to be Consistent with the Data…………...……… 66 Figure 2.5 Non-linear Relationship Between Pattern Domain
“Heterogeneity of Composition” and Nutrient Exports……...………… 67
Figure 2.6 Non-Linear Relationship Between Pattern Domain
“Connectivity” and Nutrient Exports………...……… 68
Figure 2.7 Non-Linear Relationship Between Pattern Domain
“Form” and Nutrient Exports…………...……… 69
Figure 2.8 Detail of Plot Suggesting Resilience Gap
Figure 2.9 Detail of Plot Suggesting Resilience Gap
Associated with Increasing Heterogeneity…..…………...……….. 71
Figure 2.10 Detail of Plot Suggesting Resilience Gap
Associated with Changes in Landscape Texture ………...……….. 72
Figure 3.1 Study System………...………. 92
Figure 3.2 The Frontier of Urbanization (2006-2030) for a Single
Business as Usual Scenario Realization (A). The Relationship Between Change in Subwatersheds and
Projected Population Density (B)……..……….……….. 93 Figure 3.3 Estimated Flow in the Study Area (A). Plots (B) Illustrate the
Relationship Between Connectivity Measures (Cost Distance,
INTRODUCTION
The evolution of cities and associated urban forms have accelerated the advent of the Anthropocene, our current geologic epoch that references human dominance of many, if not most, biotic and abiotic domains (Ellis and Ramankutty 2007). Given this, and the fact that the majority of humans now live in or near cities (UN 2014), we find that roughly one-quarter of the planet’s net primary productivity is directly and indirectly managed by human
activity servicing urban populations (Haberl et al. 2007). Growing urban populations are placing unprecedented demand on landscapes to not only provision us with food, fiber and fuel, and to clean our water and air, but provide places to live and work, places to stage our cultural practices and places to recreate (Grimm et al. 2008). These demands drive
urbanization, a force that works mechanistically through conversions of greenfields to covers designed for human use. The combinatorial effects of urbanization have consumed arable land and habitat, reduced evapotranspiration and groundwater recharge, increased stormwater runoff, and made landscapes grayer, hotter, dryer and flashier (Eigenbrod et al., 2011; Revi et al. 2014). However the Earth’s resources are finite, as is the ability of ecosystems to deliver sustaining services. The conflict between land consumptions trends and ecosystem
provisioning present a long-term challenge to sustaining human society (Cohen, 1995). Solutions to accommodate growth and ecosystem function will require trade-offs between human needs, economic well-being, and environmental quality (Foley et al. 2005).
exurbs (Brown et al. 2008). Alberti (2005) posits that urban development pattern critically influences ecosystem function, and that detailed understanding regarding the nature of feedbacks between spatial structure and ecosystem services is needed to anticipate and minimize urbanization impacts. She adds (2010), “We do not know the effects of different urban forms, densities, land use mix, and alternative infrastructures. We do not know, for example, how clustered versus dispersed and monocentric versus polycentric urban structures differently affect ecological conditions.” In this vacuum of information, society has routinely
exchanged environmental capacity for economic development with a poor understanding of which ecosystem services have been traded away, and at what cost (Polansky et al. 2013). In response, Bennett et al. (2015), Cadenasso (2007), Cumming (2011), Kaushal et al. (2015), Pickett et al (2004, 2011, 2014), Verberg et al (2006, 2009) and others have called for systematic studies of urban socio-ecological systems that explore the relationship between urban pattern and ecosystem function, and to generate theory robust enough to be applicable to cities worldwide and guide decision making. However, progress has been limited by either the lack of longitudinal case study adequate for representative analyses, or simulated data with realistic projections of spatial structure needed to conduct scenario analyses.
(SEL). Recent advances in land change modeling have improved simulations of the spatial structure of urban growth by moving to patch-based, multilevel modeling ([FUTURES] Meentemeyer et al. 2013). Similarly, the recent availability of ecosystem services mass-balance algorithms (Natural Capital 2014) allows regional estimates of ecosystem response by both estimating material fluxes and by placing a societally-relevant economic metric ($) on what in many cases are intrinsic values. The integration of these domains allowed for scenario development, using parameterization of FUTURES to produce alternatives, and a spatially-explicit contextualized ecosystem response.
The studies target the following questions: 1) can we anticipate the future response of endemic ecosystems to ongoing urban expansion? If so, what are some of the trade-offs between economic growth and the environment? 2) Urban expansion is widely implicated as a key driver of ecosystem degradation. Which aspect of urban pattern generates the greatest effect? 3) Environmental planning emphasizes managing connectivity between pollution-loading land covers and valued natural resources. However the location and strength of these connective gradients is often unknown. Can we anticipate regional effects by predictively mapping connections?
The analyses are presented in three chapters. In the first study I estimated the costs of water-borne non-point source pollution, carbon sequestration, and land cover based revenues for a rapidly urbanizing model system over a 24 year period. I also compared the effect associated with alternative patterns of urban growth, contrasting sprawl, infill and
theory, regarding the role of spatial heterogeneity in urban systems, to induce the integrated simulation results. Using structural equation modeling to translate the conceptualizations of Alberti (2005) into testable hypotheses, I tested for direct, indirect and modulating effects of landscape composition, connectivity, form, and land use intensity on the production of NPSP and carbon storage. In the third I examined land cover projection data for the presence of patterns suggesting that landscapes evolved in predictable ways. Using a dynamic proxy to bridge human and environmental effect, I tracked the evolution of connectivity in urbanizing watersheds by holding magnitude of change constant for three pattern alternative, and
CHAPTER 1: URBAN MODELING AND SCENARIO ANALYSIS OF THE EFFECTS OF METROPOLITAN STRUCTURE ON ECOSYSTEM SERVICES 1.1 Abstract
increased exports of nutrient pollution, reduce terrestrial carbon stores, and lead to new disturbed habitat regimes. I found that while urban form and development rates influenced ecosystem service provision, no single urban form simultaneously reduced pollution, stored carbon, and retained sensitive habitat, a finding that underscores the difficulties likely to be encountered when balancing economic and environmental outcomes. Increased density yielded stronger financial returns to landowners as concentrated economic activity drove up land rents while minimizing broader pollution costs, as compared to a low-density status-quo. My findings emphasize the need for ecosystem service analyses to more adequately understand development trade-offs in the metropolitan context.
1.2 Introduction
In developed countries, amenity migration to rural areas within commuting distance of expanding urban centers has fundamentally restructured the configuration, hydrology and ecologies of surrounding watersheds through urbanization (Gosnell & Abrams, 2011; Taylor, 2011). Between 1950 and 2000 the US experienced a 500% increase in development at the urban fringe (Brown, Johnson, Loveland, & Theobald, 2005), much of it as sprawling development patterns that have been shown to exert high pressures on fragmented exurban ecosystems (Mentens, Raes, & Hermy, 2006). Urbanization works mechanistically through conversions of greenfields to impervious covers designed for human use, and is a direct impact which has consumed arable land, reduced evapotranspiration and groundwater
services, sustains wellbeing by provisioning food, water, and raw materials, regulating climate and water flow, moderating extreme weather events, providing habitat that harbors both valued species and genetic diversity, and by providing opportunities for recreation, tourism, and aesthetic appreciation (Tzoulas et al., 2007).
Urbanizing areas are increasingly areas of environmental uncertainty, and evidence of green infrastructure overburdening includes the formation of urban heat islands (Voogt & Oke, 2003), increases in storm damage, flash flooding and the waterway impairment (Pyke et al. 2011), invasions of exotic alien species (McKinney, 2006), fish kill and algal bloom events (Bowen & Valiela, 2001), and non-attainment of air quality standards (Cardelino & Chameides, 1990), among others. As a consequence, many former ecosystem services – the common-good functions of ecosystems (e.g. water filtration, flood storage; MEA 2005) – have been replaced by engineered gray infrastructure (e.g. drains, pipes, water treatment plants, cisterns). This replacement typically comes at great cost, at inadequate capacities (Gaffield, Goo, Richards, & Jackson, 2003), and requires high levels of maintenance (NRC, 2000). Even when best engineering and management practices (BMPs) are employed, urbanization’s alteration of the physical factors underpinning ecosystem service provision,
such as topography, biodiversity, soil capacity and biogeochemical cycling, have changed the fundamental assumptions of stationarity (i.e. that systems are varying continuously within a bounded middle ground) that guide management practices (Milly et al. 2008). These ongoing threats to resilience (Lawler et al. 2014) leave many urban areas lacking sustainable
Planning approaches to retain green infrastructure networks, and the ecosystem services they provide, have focused on managing the spatial configuration of development pattern in attempt to reduce the low-density style of development (‘sprawl’) that dominates North American exurbia (Preuss & Vemuri, 2004). Sprawl is widely understood to fragment ecosystems through low density and disjunct growth (Ewing and Hamidi 2014, Theobald 2000) and the pattern it takes is associated with losses of agriculture productivity, accelerated climate change, increased childhood obesity, increased infrastructural costs, and increased vehicular miles traveled (Littman, 2015). Sprawl is also suggested as a driving factor compromising key ecosystem services, notably the storage of climate-changing carbon and the ability of landscapes to infiltrate and purify water (American Rivers, 2002; Beach 2001). Development alternatives such as Great Britain’s “Compact City” (Breheny, 1992) and the US’s “Smart Growth” programs (Duany, Speck, & Lydon, 2010) aim to limit these impacts with “infill” or “clustered” patterns that concentrate density around amenities or
infrastructure to reduce land consumption and travel costs. Comparative studies have found smart growth programs effective in shaping design (Song, 2005); however, we know little about the environmental impacts of these alternative patterns (Preuss & Vemuri, 2004; Beach 2001) as progress has been limited by either the lack of longitudinal case study adequate for representative analyses, or simulated data with realistic projections of spatial structure needed to conduct scenario analyses. As a result, trade-offs required by the implementation of such designs remain unclear to planners and policy makers.
of a suite of alternative development patterns in order to explore the spatial interactions between urban form and the generation of ecosystem services. Data limitations were overcome using a novel integration of land change and ecosystem services simulations in order to map and measure the co-evolution of human and natural systems in socio-ecological landscapes (SEL). Recent advances in land change modeling have improved simulations of the spatial structure of urban growth by moving to patch-based, multilevel multitemporal modeling ([FUTURES] Meentemeyer et al. 2013). Similarly, the recent availability of
ecosystem services mass-balance algorithms (Natural Capital 2014) allows regional estimates of ecosystem response by both estimating material fluxes and by placing a societally-relevant economic metric ($) on what in many cases are intrinsic values. The integration of these domains allowed for scenario development using parameterization of FUTURES to produce alternatives, and a spatially-explicit contextualized ecosystem response.
Is there a possibility for more “environmentally benign” urban growth? Further, what
are key trade-offs involved when we repurpose land from an environmental role to an economic one? To explore the impact of business-as-usual and alternative growth pattern on ecosystem services, I projected future development patterns and their impacts on green infrastructure over two decades (2006 – 2030) and across 37 watersheds (HUC-12 level; USGS 2006) in the Charlotte, North Carolina (USA) metropolitan region, which is one of the fastest growing and most urbanized regions in the Southeastern United States (Cohen,
Hatchard, & Wilson, 2015). Using the FUTURES multi-level urban growth model
scenario) proposed for a six-county Charlotte study area. Alternative development patterns were integrated with a suite of ecosystem service models, including Integrated Valuation of Ecosystem Services and Tradeoffs ([InVEST 3.1] Tallis et al 2013) and Southeast GAP Analysis Project Human Disturbance Index (USGS SEGAP 2011) to estimate green
infrastructure performance, specifically landscape patterns’ generation of ecosystem services
that purify water, sequester carbon, and harbor biodiversity in the face of urban change (as simulated between 2006 and 2030). Finally, in order to investigate the relationship between urban development and ecosystem services, I drew on work by Polasky et al. (2010) to compare urban form-related economic performance and landowner revenues with discounted cash flow models of the financial savings (or costs) related to the function of green
infrastructure.
1.3 Methods
Estimating the impact of projected urban patterns on a suite on indicators of water quality, carbon, habitat and landowner revenues required linking simulation models in a multistep process. Simulation modeling of land cover change has the potential to both generate cases studies and provide insights into ecosystem function beyond empiricism through their ability to undertake experiments in alternative futures (Rounsevell et al. 2012). First, I developed regional maps of starting (2006) and projected (2030) land cover based on business-as-usual and alternative pattern scenarios using a spatially explicit, population driven urban growth model. Next, maps for 2006 and 2030 were used as input into the InVEST Water Purification Nutrient Retention and Carbon Storage and Sequestration modules to assess the location, degree and costs of nutrient pollution exports as well as carbon sequestration associated with those landforms. Changes in habitat suitability for vertebrates was estimated for both time steps using a Human Disturbance Index from the SE GAP program. Revenues anticipated for urban, forested and agricultural land covers were estimated using data from Lubowski (2008) and adjusted for 2015 dollars. Results were aggregated at pixel, subwatershed and regional scales, and LSA performance was compared with the status quo trend.
1.3.1 The Study System
by 2030 (North Carolina State Demographics Office 2009). In the 19th and early-20th centuries, the region was largely bereft of forest due to plantation agriculture, but the agricultural abandonment associated with the regions’ decline in the textile industry lead to widespread reforestation (American Forest 2010). Today, approximately 25% of the region’s
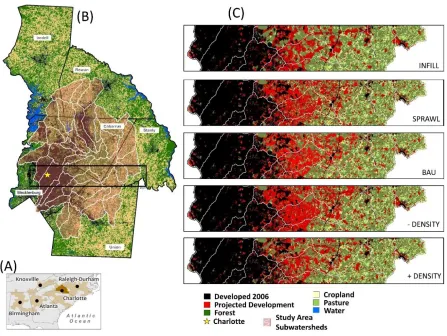
landscape is urban, 25% agricultural, and over 50% is forested with Oak/Hickory/Pine upland forests connected by 2nd and 3rd order stream networks (Figure 1B). With the ascension of Charlotte as an international banking center and the resulting population influx, the need for housing drove widespread conversions of forest and farmland to sprawling development patterns (Graves & Smith, 2010).
Despite having the some of the strictest floodplain protection ordinances in the state, Mecklenburg County experienced 100-year floods in 1995, 1997, 2006, 2008 and 2011 (Charlotte-Mecklenburg Storm Water Services, 2015). During this same period, the region was found to be developing 30 acres per day (Meentemeyer et al. 2013). But floods were not the only water management problem. The region’s primary source of drinking water and electric power, the Catawba River, was named America’s Most Endangered River in 2008 by
American Rivers, who cited climate change, sedimentation and sewer overflows as the system’s biggest challenges (American Rivers, 2013). Public interest in sustainable
landscapes is found in two concurrent, but independent, regional visioning exercises: Mecklenburg Counties “Livable Communities” program (2013) and Centralina Council of Government’s CONNECT Our Future program (2011).
representative of fast growing and unconstrained urban regions throughout the US (Figure 1B). My choice of sub-watersheds as the unit of analysis – rather than jurisdictional (i.e. municipal boundary) or demographic (i.e. census) units – reflects my goal of measuring effects at ecologically relevant scales, with the understanding that results can later be aggregated at other specified extents once processed. I excluded three subwatersheds directly adjacent to reservoirs along the impounded Catawba River, which reduced the
complexity introduced into hydrological modeling by non-gradient flows. The study system’s 346,000 ha extent was extended by 1,000 meter buffers to reduce boundary effects in
simulation modeling.
1.3.2 Urban Growth Projections
sub-model (ii) projects land demand of a region based on historical observation of per-capita land consumption, and RGS is a Region Growing Simulator (iii) that emulates the dynamic process of land change based upon a stochastic site selection process and a discrete patch-based region growing algorithm. The RGS simulates the conversion of undeveloped lands as development events, or “patches”, whose distribution of size and shapes matched those
recorded 1996-2006 by the Landsat satellite. Only new development converting greenfields (forest, agriculture) change: previously existing development, and undeveloped forest and agricultural classes are static. FUTURES projections where dynamic and spatially interactive as they included a “development pressure” feedback loop, where patches simulated by RGS are allowed to influence neighboring undeveloped lands, thereby alters the likelihood of development in the POTENTIAL sub-model for the next step. Development pressure is estimated using a distance decay model, and has been shown to be statistically predictive of future development (Dorning et al., 2015; Meentemeyer et al. 2013).
In anticipation of FUTURES modeling, inputs quantifying the amount and structure of land use change were needed to parameterize and calibrate the model. In analyzing
historical satellite imagery, Meentemeyer et al. (2013) estimated the conversion rate of 35 ha per day in the region between 1985 and 1996, and 32.5 ha per day between 1996 and 2006. Using mapped conversions, I made extrapolations of historical per capita land consumption (PCLC) trends, based on estimates of population growth provided by the NC Office of State and Budget Management (2012), projected the demand (i.e. number and area) for
parameterization, I applied a calibrated FUTURES model to simulate annual business-as-usual change 2006 to 2030. From an output of 50 stochastic runs per landscape treatment, I report mean values on a random selection of 10. Using a back casting method, Meentemeyer et al. (2013) estimated accuracy of the projections at 86.7%, with error distributed along a gradient of underestimation in more urban areas and overestimations in rural areas.
The native output of FUTURES is a binary, raster map of developed/undeveloped land at the 30 meter resolution. I re-classified the single development class into four intensity classes using a scoring scheme based on three parameters determined to be significant
predictors in the development of the FUTURES generalized linear model, including
development pressure, road density and slope (Meentemeyer et al. 2013). Grid-based values for the three were then divided into quartiles and scored 1-4 with higher values inferring increased suitability for intensive development, after which they were summed, and the result was divided again into quantiles and scored 1 to 4. This datum was treated to an
unsupervised classification: intensity was awarded based on context and expert knowledge of the region, and resulted in a plausible land cover map (Figure 1C “BAU”).
1.3.3 Alternative urban pattern scenarios
I produced a series of scenarios suggested as sustainability solutions by the region’s envisioning programs to compare with the benchmark “business-as-usual” and each other. Suggested alternatives were deregulated growth, with expectations for dispersed, low intensity development, and infill or cluster growth, the expectation of compact and high intensity growth around existing infrastructure. However, in translating these narratives into mapped parameters I used the opportunity to make two key choices: modeled growth would be “bottom-up” rather than prescriptive or expert-based, and that I would disentangle the
effects of configuration and composition through a factorial research design. The former recognizes the current absence of policy or ordinance sufficient to shift aggregated pattern in this strong property rights state. The latter allows us to explore whether it is the location of new development, or the composition, which modulates the generation of ecosystem services.
With this rationale I developed four pattern alternatives (Figure 1C) to compare with business-as-usual. I designed the first factor pair to isolate the effects of configuration. I held population growth, per capita land consumption, and patch size and shape distributions constant, and created “Sprawl” and “Infill” patterns by adjusting a site suitability parameter (“INCENTIVE”; Meentemeyer et al. 2013). INCENTIVE modifies the evenness of the
increased survival near places already highly suitable, thus clustering development events closer to, for example, transportation infrastructure.
I designed the second factor pair to isolate the role of composition. I held dispersion, population growth and patch size and shape distributions constant, and created “Increase Density” and “Decrease Density” pattern by altering PCLC. Increase Density simulated the
effect of intensifying human activity on developed lands, perhaps through ordinance,
whereas Decrease Density simulates a deregulatory environment. Reducing PCLC in the case of Increase Density places more individuals on less land, in effect upzoning lands, resulting in a reduction of greenfield conversions as compared to status quo. Increasing per capita land consumption means each individual in situ uses more land, and simulates more greenfield conversions along patterns referenced by the historical (1996-2006) trend, an effect likened to low density zoning, or absence of zoning ordinance.
While I applied five INCENTIVE treatments to the projections, I report on widest range values, 0.25 for Sprawl and 4.0 for Infill. Similarly, I developed five land intensity treatments and report on widest range values, 40% above and below business-as-usual per capita land consumption. To account for stochastic effects designed to mimic landowner behavior, the four pattern alternatives and business-as-usual treatments were iterated 10 times, and generated 50 regional map projections for evaluation (Figure 1C, single run illustrated).
1.3.4 Water Purification modeling
dynamic threshold bounded by the amount of impervious surface, the topography-influenced speed of water, the porosity of soil, the metabolism of vegetation and climate (the
combination of heat and humidity determining how well things evaporate).When those dynamic thresholds are exceeded, exported pollutants follow hydrological gradients downhill to the next area where they may be retained, passed-on or amplified. Green infrastructure has a wide capacity to purify incident rainfall and runoff without human intervention when present.
I modeled this process for the study area using the “Water Purification Nutrient Retention” module, a spatially-explicit eco-hydrological model within InVEST 3.1. I
estimated per-pixel annual nitrogen (N) and phosphorous (P) pollutant balances (loading, retention and export) based on projected land cover and soil porosity, with annual climate and geophysical characteristics held constant. The Water Purification Nutrient Retention module is comprised of three sub-models employed in sequence: an eco-hydrological water yield model, a process-based nutrient cycling model, and an economic valuation model. The data needed for the water yield model, (annual precipitation, potential evapotranspiration, plant available water content, root restricting layer depth, watershed and sub-watershed boundaries) was acquired from various sources (Appendix B, Tables 1 & 2). Landcover maps were prepared as noted above. I chose a value of Zhang’s Constant value of 8 to reflect the relative evenness of precipitation throughout the year, a choice consistent with
recommendations for temperate climates. I held annual rainfall and potential
constant, but allowed plant available water content and root restricting layer depth to change when projected to develop.
Urban and agricultural land covers are significant sources of NPSPs, and the magnitude of loading varies by crop. My maps contained 50 cover types, including four urban types and four forest types, to which I appended empirically determined
evotranspiration coefficients, nutrient loading and vegetative filtering data added to each (Recknow 1980; Appendix B Table 2). For each pixel I estimated landcover supplied loads of N and P, as well as loading passed from upslope exports, retention, and exports in kg yr-1 cell-1. Soils were assumed to not saturate their ability to uptake nutrient loading. The Water Purification Nutrient Retention module only measures terrestrial water and non-point source nutrient balances; no subsurface contributions or in-stream processes are considered.
Following Polasky et al. 2010) nutrient balances are not tracked in water bodies, and all exports are assumed to be delivered to the mouth of the watershed. Thus, the biogeochemical balances of all subwatersheds are considered independent.
I estimated hydrological gradients using biophysical factors and excluded engineered stormwater infrastructure in order to reveal ecosystem function, acknowledging a lack of information regarding the location and performance of such infrastructure in both 2006 and in projections. This choice is analogous to the use of total impervious area (TIA) by
proportions of unconnected imperious areas (Brabec 2012) such as those observed in the study area.
Currently, non-point source pollution is not monitored or treated in the study area, however, to assess a value to N and P exports I used a fee schedule from nearby watersheds as a proxy. North Carolina’s Division of Mitigation Services administers a voluntary Nutrient
Offset Program in the Neuse and Tar-Pamlico basins east of the study area. This program applies a fee schedule to non-point source nutrients N and P using an “Actual Cost Method” to estimate the cost of mitigating these pollutants (NCDENR 2015). Fees vary by area, and I took the average which billed N at a rate of $43.85 kg yr-1 ha-1, and P at $524.30 kg yr-1 ha-1, values held constant throughout. I assumed a linear change in purification services between 2006 and 2030, and estimated the present value of 24 years of aggregated pollution offset fees using a discounted (4%) cash flow model. All estimations are developed on an annual basis, and significant intra-annual variability, such as nutrient pulses during the growing season, is unaccounted for in the modelling.
1.3.5 Carbon sequestration
comparisons, I assumed no losses of carbon due to timber harvests over the period of analysis, or the growth of new trees, holding carbon stored in soils and biomass constant at 2011 values.
Carbon sequestration is the difference between starting and projected stocks, I used the social value of carbon sequestration at $60.00 USD per Mg, a conservative value also used in a recent ecosystem service assessment of Wake County NC (Schmidt 2012) to report dollar values. The social cost of carbon represents the marginal damage incurred for each additional ton of carbon released into the atmosphere (Ackerman and Stanton 2012). I assumed a linear change in carbon over the period of analysis, and report PV of 2030 carbon sequestration using discounted (4%) cash flow modeling.
1.3.6 Urban Biodiversity
Changes in land cover have direct implications for biodiversity (Seto et al. 2012), and urban land covers favor habitat generalists, colonizers and other species while excluding habitat specialists. In the study area “Urban Adopters” (McKinney 2008) include invaders
such as coyote (Canis latrans; Wine et al. 2015) as well as many culturally and economically significant game animals such as white-tailed deer (Odocoileus virginianus). “Urban
Avoiders” include forest interior birds and woodland salamanders such as the spotted
(Ambystoma maculatum). The degree of intolerance for human associated disturbances is a
to specific species, it is used here to interactively map change introduced by projected development pattern and facilitating post hoc assessment. Monetary values for the different types of habitat have not been estimated, and as a consequence are not included in monetary analyses.
1.3.7 Returns to Land Owners
Many aspects of economic development are founded in land systems. Land covers generate income to land owners in the form of timber and agricultural production for managed greenfields, and rents in urban areas. Forests, croplands and pastures can, depending on management, deliver both private revenues and generate common good ecosystem services. In contrast, development typically exchanges non-rival service goods provided by the green infrastructure for exclusive rents. To investigate the relationship between land-derived revenues and service provisioning by green infrastructure, I compared returns to landowners to assessed ecosystem service valuations using discounted cash flow models.
order to compare plausible outcomes, urban land covers were weighted by a factor of 1.4 and 0.6 respectively. I converted annual returns estimated for 1988-1992 (the latest period of analysis) to 2015 dollars using a range of indicators (Williamson, 2015) and applied them to 2006 and projected landscapes on a pixel-level basis In all cases pixel values were summed and aggregated for each subwatershed, and a discounted (4% annually) cash flow model generated present value (PV) of 2030 patterns.
1.4 Results
1.4.1 Historical and business-as-usual mapping
I mapped regional land covers in 2006 from three forms of data: Landsat TM satellite imagery, aerial orthophotography and light detection and ranging data (LiDAR; for a full description of methodologies see Meentemeyer et al. 2013). Mapping revealed 21.7% developed land covers, 52.7% forested, 7.5% cropland and 17.4% pasture lands in 2006 (Figure 1.2 B ; Table 1.1). Overall classification accuracy was 86%. Population for the study area in 2006 was 1,177,507 (Census Bureau 2015), a per capita consumption rate of 0.064 developed hectares per person (Table 1.1).
the landscape to one dominated by low density development and associated high tolerance habitat. Conversions outpaced population growth which was estimated at 1,483,291 individuals, an increase of 26.0% over 2006, with per capita land consumption roughly doubling to 0.12 hectare per person. Associated with this change were increases in nutrient pollution loading, 22% and 30% percent for P and N respectively, and the landscape lost an average of 2,771,448 metric tons of carbon representing costs to society of $105,604,827 (Table 1.1).
1.4.2 Regional Responses to Alternative Urban Pattern Scenario
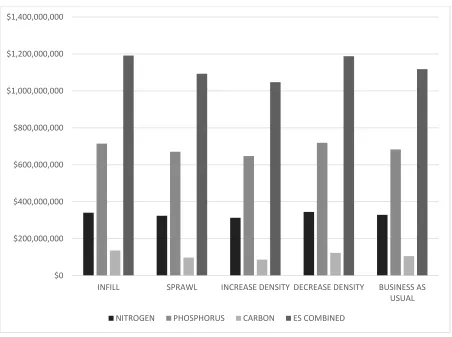
Table 1.1 aggregates the differential response of green infrastructure to simulated urban pattern alternatives (Figure 1.1 C). All projections of future landscape patterns are estimated to increased exports of nutrient pollution, reduce terrestrial carbon stores, and lead to new disturbed habitat regimes (Figures 1.2, 1.3). I found that while urban form and development rates differentially influenced ecosystem service provision, no single urban form simultaneously reduced pollution, stored carbon, and retained sensitive habitat.
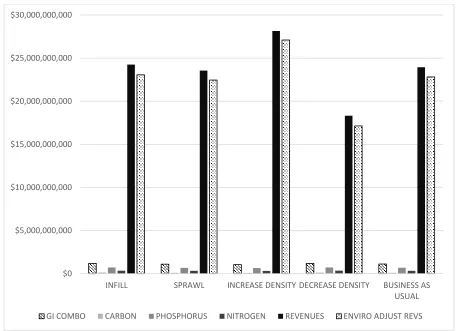
Increased density yielded stronger financial returns to landowners as concentrated economic activity drove up land rents while minimizing broader pollution costs, as compared to a low-density business-as-usual (Figure 1.4).
which population growth and per capita land consumption was held constant, Infill. However sprawl converted the most “intolerant habitat” of all scenarios (Figure 1.3) and was expected
to generate slightly less revenue for landowner (Figure 1.4).
Infill clustered growth around previously developed and thereby retained the maximum area of habitat for human-intolerant species. It also generated slightly more landowner revenues. However this alternative was the second highest polluter, behind Decrease Density, and lost the most the most carbon of all alternatives considered. The Infill alternative increases the contiguity of impervious surfaces, reducing opportunities for the absorption or uptake of nutrient pollution. Infill sequesters less carbon because it converts relatively more forest (Table 1.1). Forests store more carbon than cropland and pasture greenfields, and in this historically agricultural landscape, the fast growing forests of the Southeast are found proximal to development due to decades of urban-driven agricultural abandonment.
In the second factorial pair where configuration was held constant, Increase Density polluted less than Decrease Density, and compared with other scenarios, sequestered the most carbon, generated the most revenues, and was the second highest conserver of habitat for intolerant species behind infill (Figure 1.3). The decrease in per capita land consumption resulted in fewer greenfield conversions, and this alternative was estimated to avoid over $70 million of costs associated with offsetting NPSP and carbon emissions as compared to
Increasing per capita land consumption has the effect of increasing greenfield conversions without concurrent increases in intensity, making it unsurprising that the Decreasing Density alternative generated the highest environmental costs (Figure 1.4), second highest loss of habitat for intolerant species, and the lowest returns to landowners (Table 1.1), for the services examined. However more carbon was retained in this alternative than Infill as the historical trend in pattern was somewhat dispersed from existing
development, and thereby converted less forest. The decrease in returns to land owners simulates the effect of diluting human activity.
1.4.3 Landowner revenues and trade-offs
performer (Figure 1.4). Finally, infill conserved the highest amount of habitat for human intolerant species, 16,000 ha more on average than increase density. If these lands were valued at $250,000 per hectare, or about $102,000 per acre, the monetary performance would be even.
1.4.4 Nested Analyses: Subwatershed Responses to Alternatives
Regionally, scenarios that isolated landscape configuration (i.e. sprawl and infill) were not found to differ significantly from business-as-usual in how green infrastructure mediated biogeochemical balances (Table 1.1). To investigate further I looked at these balances at subwatershed scales. Of the 37 subwatersheds in the region, 18 exported
significantly (p = 0.05) more or less nitrogen than the benchmark business-as-usual; similarly 17 were significantly different for phosphorus exports, and 14 for carbon sequestration (Figure 1.5). In most cases subwatershed responses offset each other when aggregated regionally, obscured the effect of configuration oriented alternatives on the green infrastructure services.
When I control for magnitude of change on specific subwatersheds, I found 56% demonstrated sensitivity to configuration for one indicator, 48% to two and 27% to all three (Figure 1.6). This analysis reveals that location, rather that composition, is a key determinant as to whether a sustainability-oriented urban pattern prescription pollutes more or less a laissez-faire approach.
1.5 Discussion
absence of understanding, society has leaned heavily on site-level building codes and local ordinance to protect common pool resources. This research suggests that while composition of new development remains important, the specifics of how development is spatially configured across a landscape has consequences for water quality, retention of climate-changing carbon, and habitat for charismatic animals. It’s not just what it is, it’s where it is.
To be clear, all alternative futures tested resulted in more pollution, losses of carbon, and irreparable changes to habitat as compared with a fixed starting point. Simulations of projected urban growth estimate that by 2030 nutrient pollution exports to surface waters across the region may increase over 65%; that we will lose over 2 million metric tons of stored carbon from our forests and soils, and we will flip the composition of landscape from one dominated by low human disturbance habitat to one of overwhelmingly high disturbance. The clearest signal comes from the loss of forests, and landscapes where they are lost incur the highest ecosystem services costs. Forests add moderate amounts of P and N to the landscape, but by storing carbon in wood and debris, their metabolic uptake,
evapotranspiration and possibly flow-slowing width along hydrological gradients modulate the regulation of nutrient export and carbon loss. In contrast to the environmentally dreary prognosis is the likelihood that landowners will be making much more money, the region generating more than 24 times current returns as conversion replaces low-yielding forests and pastures for high yield urban covers.
combinatorial effects of composition, configuration, and time; 2) the fallacy of “one size fits all”; and 3) the utility of spatially explicit analyses.
First, there is a need systemic understanding the combinatorial effects of composition, configuration, and time. The estimated impacts of development pattern were generated from interactions of land use composition (specific land use /land cover and magnitude of change) and configuration (location and geographic context), and time (when did it happen,
aggregated effect), and each of these dimensions should be managed to produce desired effects, not just composition which is the typical planning tool represented by zoning. Moreover, these key factors (composition, configuration and time) are not independent, and are instead highly path dependent given a starting time step and trajectory. New development fits into existing patterns of growth, and can aggregate to new pattern or condition the fate of undeveloped areas. Bendor et al. (2013) found that relatively low amounts of urban growth made woodland owners in rural communities more inclined to sell land to developers.
“One size fits all” prescriptions, such deregulation or infill are demonstrated to have the unintentional effect of increasing N pollution in more than half of the subwatersheds in the region, while at same time decreasing pollution, the desired effect, in one-third. In similar fashion, these results “flip” for a low density sprawl prescription, and for P and carbon to a
lesser extent. I found landscape structure and configuration was a major driver of nutrient export, and flip-flop patterns of contrary response is due to configurational sensitivity of green infrastructure to development, leading to the conclusion that “place matters”,
Third, that in all cases the explicit consideration of scale is warranted, as development events are unique in time and space, but frequently aggregate to form patterns that transcend jurisdiction. In this study a simple regional aggregation of impacts masked the differential, and frequently counter-indicated responses of individual subwatersheds. Given that
environmental impacts of pattern follow natural gradients and ignore jurisdiction, I suggest acquiring a synoptic understanding of the context and topology of the landscape matrix as part of regional planning. Ultimately planning for such a limited suite of ecosystem services is far from responsible, however I found certain urban patterns such as Increasing Density retained green infrastructure function better than others while accommodating projected population growth, suggesting a pragmatic way forward to limit impacts associated with development and maximize sustainability.
1.6 Conclusion
I used an integration of spatial modeling throughputs to estimate green infrastructure services in a complex, urbanizing landscape at two time steps. Projections of future
landscape patterns are estimated to greatly increased exports of nutrient pollution, reduce terrestrial carbon stores, and lead to new human disturbed habitat regimes. Loss of forest is insinuated as a leading driver of nutrient pollution export. Subwatershed exhibited
context of biophysical gradients, and that representation of both composition and
configuration of land covers are needed to develop effective strategies to maintain water quality in the future. Finally, for landowners and local governments, my work suggests that increased density also increases financial returns in the face of reduced pollution costs.
Tables
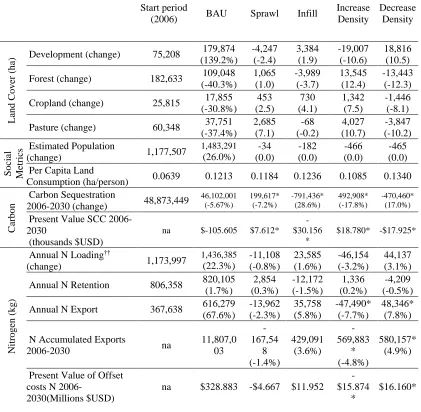
Table 1.1 Ecosystem Services Associated with Landscape Composition, Pattern and Change (2006-2030). Business-as-usual (BAU) is taken as the mean values of 10 model runs. All other values are given as percentage change from BAU.
Start period
(2006) BAU Sprawl Infill
Increase Density Decrease Density Lan d Co ve r (ha
) Development (change) 75,208 (139.2%) 179,874 -4,247 (-2.4) 3,384 (1.9) -19,007 (-10.6) 18,816 (10.5)
Forest (change) 182,633 109,048
(-40.3%) 1,065 (1.0) -3,989 (-3.7) 13,545 (12.4) -13,443 (-12.3)
Cropland (change) 25,815 17,855
(-30.8%) 453 (2.5) 730 (4.1) 1,342 (7.5) -1,446 (-8.1)
Pasture (change) 60,348 37,751
(-37.4%) 2,685 (7.1) -68 (-0.2) 4,027 (10.7) -3,847 (-10.2) So ci al M et rics Estimated Population
(change) 1,177,507
1,483,291 (26.0%) -34 (0.0) -182 (0.0) -466 (0.0) -465 (0.0) Per Capita Land
Consumption (ha/person) 0.0639 0.1213 0.1184 0.1236 0.1085 0.1340
Ca
rbon
Carbon Sequestration
2006-2030 (change) 48,873,449
46,102,001 (-5.67%) 199,617* (-7.2%) -791,436* (28.6%) 492,908* (-17.8%) -470,460* (17.0%)
Present Value SCC 2006-2030
(thousands $USD)
na $-105.605 $7.612* -$30.156 * $18.780* -$17.925* Nitro ge n (kg)
Annual N Loading††
(change) 1,173,997
1,436,385 (22.3%) -11,108 (-0.8%) 23,585 (1.6%) -46,154 (-3.2%) 44,137 (3.1%)
Annual N Retention 806,358 820,105 (1.7%) 2,854 (0.3%) -12,172 (-1.5%) 1,336 (0.2%) -4,209 (-0.5%)
Annual N Export 367,638 616,279
(67.6%) -13,962 (-2.3%) 35,758 (5.8%) -47,490* (-7.7%) 48,346* (7.8%)
N Accumulated Exports
2006-2030 na
11,807,0 03 -167,54 8 (-1.4%) 429,091 (3.6%) -569,883 * (-4.8%) 580,157* (4.9%)
Present Value of Offset costs N
2006-2030(Millions $USD)
na $328.883 -$4.667 $11.952 -$15.874
*
Table 1.1 Continued
Phosph
orus (
kg)
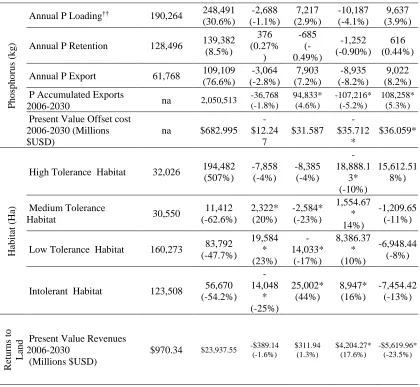
Annual P Loading†† 190,264 248,491 (30.6%) -2,688 (-1.1%) 7,217 (2.9%) -10,187 (-4.1%) 9,637 (3.9%)
Annual P Retention 128,496 139,382 (8.5%) 376 (0.27% ) -685 (-0.49%) -1,252 (-0.90%) 616 (0.44%)
Annual P Export 61,768 109,109
(76.6%) -3,064 (-2.8%) 7,903 (7.2%) -8,935 (-8.2%) 9,022 (8.2%) P Accumulated Exports
2006-2030 na 2,050,513
-36,768 (-1.8%) 94,833* (4.6%) -107,216* (-5.2%) 108,258* (5.3%)
Present Value Offset cost 2006-2030 (Millions $USD)
na $682.995 -$12.24 7 $31.587 -$35.712 * $36.059* Hab it at (Ha)
High Tolerance Habitat 32,026 194,482 (507%) -7,858 (-4%) -8,385 (-4%) -18,888.1 3* (-10%) 15,612.51 8%) Medium Tolerance
Habitat 30,550
11,412 (-62.6%) 2,322* (20%) -2,584* (-23%) 1,554.67 * 14%) -1,209.65 (-11%)
Low Tolerance Habitat 160,273 83,792 (-47.7%) 19,584 * (23%) -14,033* (-17%) 8,386.37 * (10%) -6,948.44 (-8%)
Intolerant Habitat 123,508 56,670 (-54.2%) -14,048 * (-25%) 25,002* (44%) 8,947* (16%) -7,454.42 (-13%) Re
turns to Lan
d
Owners
Present Value Revenues 2006-2030
(Millions $USD)
Figures
Figure 1.1 Charlotte Metropolitan Study System. A) Charlotte NC is part of the Char-lanta
megalopolis. B) 37 HUC-12 digit subwatersheds sampled along an urban gradient extending from
more urbanized west to the more rural east. C) detail of business-as-usual (BAU) and alternative
Figure 1.2 Scenario analyses of ecosystem service (ES) costs 2006-2030 in $USD (2015). Costs are
the present value of aggregated pollution offset fees and terrestrial carbon losses estimated using a
discounted (4%) cash flow model.
$0 $200,000,000 $400,000,000 $600,000,000 $800,000,000 $1,000,000,000 $1,200,000,000 $1,400,000,000
INFILL SPRAWL INCREASE DENSITY DECREASE DENSITY BUSINESS AS
USUAL
Figure 1.3 Scenario analyses of habitat area projections for 2030. Habitat was classified using the
human disturbance index (USGS SEGAP 2011)
0 50,000 100,000 150,000 200,000 250,000
INFILL SPRAWL INCREASE DENSITY DECREASE DENSITY BUSINESS AS USUAL
INTOLERANT LOW TOLERANCE MED TOLERANCE HIGH TOLERANCE
ARE
A
Figure 1.4 Scenario analyses of ecosystem services costs and projected returns to landowners
attributed to land cover revenues 2006-2030 in $USD (2015). Revenues are the aggregated annual
returns of rents, timber sales and agricultural yields estimated using data from Lubowski et al. (2008).
Present value is estimated using a discounted (4%) cash flow model. Environmentally adjusted
revenues are the present value of projected land cover revenues minus the present value of aggregated
pollution offset fees and terrestrial carbon losses (Figure 2).
$0 $5,000,000,000 $10,000,000,000 $15,000,000,000 $20,000,000,000 $25,000,000,000 $30,000,000,000
INFILL SPRAWL INCREASE DENSITY DECREASE DENSITY BUSINESS AS
USUAL
Figure 1.5 Local change in ecosystem services attributed to land cover configuration. Symbolization indicates response “flipped” from positive to negative (as compared to status
Sprawl
Infill
1
A
B
quo) based on development configuration. Ecosystem service are exports of A) Nitrogen and B) Phosphorus in kg yr-1 ha-1; C) is Carbon storage in Mg yr-1 ha-1.
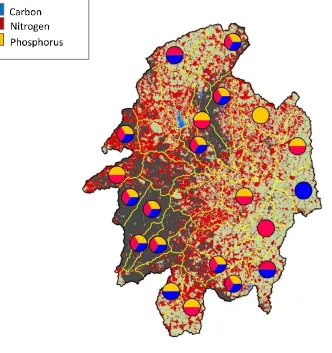
Figure 1.6 Subwatershed sensitivity to configuration. Of the 37 HUC-12 subwatersheds, 18 exported
significantly (p = 0.05) more or less nitrogen than the benchmark business-as-usual; similarly 17 were
significantly different for phosphorus exports, and 14 for carbon sequestration.56% demonstrated
CHAPTER 2: STRUCTURAL EQUATION ANALYSIS OF THE ROLE OF URBAN PATTERN IN GENERATING ECOSYSTEM SERVICES
2.1 Abstract
Development pattern, such as urban sprawl, has been widely implicated in driving environmental degradation and compromising ecosystem resilience. However, a lack of concise theory regarding urban pattern and process, and the paucity of representative case study, has left the role of spatial structure in modulating ecosystem function largely
unexplored. I tested the capacity of leading theory to explain the role of spatial heterogeneity in modulating urban ecosystem function by first translating a conceptual model of urban impact into a testable structural equation model (SEM). This step distinguished four spatial pattern domains rendered as latent variables representing composition, configuration, connectivity, and land use intensity. I then examined model response to estimates of non-point source pollution (N, P) and carbon storage generated by scenarios of urban growth in the rapidly developing Charlotte (NC) region over a 24 year interval. This data was generated using a novel integration of land change and ecosystem services simulations. I statistically evaluated correspondence between simulated estimates and latent variables and iteratively arrived at a model (r2adj = 0.79) that found heterogeneity in composition most influential (βstd = - 0.58) in the generation of nutrient non-point source pollution (NPSP), followed by connectivity (βstd = 0.28) and heterogeneity of configuration (βstd = - 0.15). Land use
advised to manage amplifying effects of greenfield conversions by maintaining land cover diversity, and limit the connectivity of developed land covers along hydrological gradients. 2.2 Introduction
Worldwide, human well-being depends on a wide suite of services provided by functioning ecosystems (UN, 2005). Growing urban populations, obligate on the stable generation of these services both in situ and in the urban footprint (Rees and Wakernagel 2008), are particularly vulnerable when these benefits breakdown in response to sudden or chronic landscape change (Smith et al. 2009; Collins et al. 2011). Urbanization, a term here used to describe the pattern and process of anthropocentric growth manifested as conversion of greenfields to development (Ewing 2002; Ewing and Hamidi, 2014), is the primary agent of landscape change worldwide (Haddad et al., 2015). Urbanization has been shown to change the state factors underpinning ecosystem function (Eigenbrod et al., 2011; Revi et al. 2014), and made urban and periurban landscapes places of environmental uncertainty (Voogt & Oke, 2003; Pyke et al. 2011; McKinney, 2006; Bowen & Valeila 2001).
In contrast to these risks, the advantages created by urban development (e.g. housing, economic opportunity) make urbanization the dominant land change trend for the foreseeable future (Glaser 2011). The trade-offs presented by positive and negative aspects of
urbanization represent a dilemma to decision makers and planners charged with
ecosystem services. A process-based understanding of the relationship between landscape heterogeneity and ecosystem provisioning is needed to provide the basis from which trade-offs and alternative strategies can be evaluated (Turner MG et al. 2013). Given that few studies to date have used alternative futures of growth to project local- to regional-scale ecosystem response to urban growth, with the notable exception of Nelson et al.(2009), anticipating (and avoiding) the indirect, combinatorial and accumulated environmental impacts remains a key challenge to sustainable development (United Nations, 2013).
Despite the growing number of models relating urban pattern to landscape performance (e.g. Ramalho and Hobbs 2011; for a review, Wu 2014) concise theory
regarding the nature of spatial heterogeneity is needed to guide studies of urban pattern and process, and inform the management of ecosystem services (Turner et al. 2013).
Conceptually, the relationship between spatially heterogeneity and ecological response is long established (Pickett and Cadenasso 1995; Wiens 2002). The widest application of this concept has focused on the role of fragmentation in compromising ecosystem function (Theobald, 2003; Zhou, Huang, Pickett, & Cadenasso, 2011). However, operational
specific mechanisms of harmful effect, hampering the development of management strategies to manage deleterious effect.
Among other conceptualizations of spatial heterogeneity, structural changes in composition (e.g. land cover type and proportion) has also been widely assumed to drive ecosystem function (Lautenback et al. 2011) However, configuration (e.g. size, shape and connectivity) is theorized to play an important role also (Petrosillo, Zaccarelli, & Zurlini, 2010), and evidence of the importance of connectivity is mounting as seen in analysis of agricultural systems (Mitchell et al. 2013). This illustrates the need to disentangle heterogeneity, composition, and configuration in order to understand which types and amounts of spatial heterogeneity that promote sustainability (Turner MG et al. 2013).
In their conceptual model of urban ecosystem impact, Alberti et al. (2003, 2005) provided a degree of disentanglement by orienting fragmentation as a mechanism of
ecosystem impact driven by pattern domains within spatial heterogeneity. Much like Fahrig and Nuttle (2005), Alberti et al. distinguish between heterogeneity of composition (land use diversity [sic]) and configuration (urban form [sic]). Alberti et al. also include pattern
domains connectivity and land use intensity, theorizing that in urban systems these aspects of development pattern are critical to ecosystem function. However, the theory implicit in this conceptual model remain largely untested, due in part to a lack of case studies with adequate controls to isolate pattern (Alberti 2010), a lack of clear, landscape driven meaningful
responses, and entanglement of correlated and replicated behavior of the landscape metrics. The goal of this study was to identify and test the pattern domains of spatial
services in an urbanizing region, estimating how development pattern and associated fragmentation may effect water purification and carbon sequestration. In a case study of projected growth for rapidly expanding Charlotte NC I asked:
1) Are ecosystems sensitive to urban pattern independent of magnitude of change? If I isolate fragmentation as mechanism (rather than an effect or response) by using landscape simulations to control for land cover loss, can then I then quantify a response uniquely linked to spatial heterogeneity? 2) What aspects of spatial heterogeneity effect ecosystem service production? Does test data support the decomposition of spatial heterogeneity into pattern domains relevant to the system? Which metrics best describe those domains? 3) What is the strength and directionality of effect between hypothesized pattern domains and ecosystem services?
To explore the role of urban pattern in ecosystem function I first summarized and translated the conceptualizations of Alberti et al. (2003, 2005) into a causal diagram for testing using structural equation modeling. This step generated testable hypotheses by decomposing heterogeneity into structural types associated with fragmentation, and
were estimated from land cover simulations for the interval 2006-2030. Scenario simulation design referenced status quo trends to control for magnitude of change or dispersion of new growth, generating a dataset of ecosystem response representative of a range of plausible growth outcomes. Analyses were conducted at a HUC-12 subwatershed extents (USGS 2006), allowing us to sample pattern and effect along the regional urban to rural gradient. I tested the directionality and overall strength of hypothesized linkages between pattern domains and ecosystem response, and explored variation in response attributed to spatial configuration, an indicator of spatial resilience. From this study I hope to identify the characteristics of spatial heterogeneity that will enhance or impede production of different ecosystem services (Turner et al. 2013).
2.3 Methods
2.3.1 The development of a structural equation model
theory and concepts (Pearl 2009) and examine model fit for developed hypotheses. SEM facilitates the translating scientific ideas into testable form (Grace et al 2006) by using graphic diagramming to both hypothesize linkages (“paths”) between variables, and
ultimately to estimate the strength, directionality and significance of those effects. SEM also accommodates collinearity between variables, and allowed us to statistically evaluate
correspondence between latent variables and response variables generated from My data, a useful characteristic in this study were I expected landscape metrics to produce multiple quantification of pattern, e.g. the obverse relationship between cohesion and dispersion (Li & Wu, 2004; McGarigal, Cushman, Neel, & Ene, 2002). The development of the causal
diagram was an opportunity to summarize, translate and formalize conceptualizations of theory in a format that was initially noncommittal as to the particulars of functional form (Grace et al. 2012).
In translating the Alberti et al. model, isolating domains that comprise structural fragmentation required classifying heterogeneity as conceptualized into types. Following Fahrig and Nuttle (2005) I interpreted Land Use Heterogeneity and Urban Form as
descriptions of heterogeneity of composition and heterogeneity of configuration, respectively (Figure 2.1). In the former, concept of diversity is useful to describe both richness of patch types, and the relative evenness or dominance of a patch mosaic. For the latter, the degree of dispersion, interspersion or aggregation describe a landscape texture that considers isolation, cores, and contrasts. Given these two perspectives of the same landscape, encroaching urbanization is expected to fragment greenfield composition, decreasing richness and
infiltration, evapotranspiration and vegetative uptake (H1, Figure 2.1). Fragmentation of greenfield configuration is anticipated to create landscapes that are more dispersed and less patch isolation, changes whose effect on carbon and nutrient cycling is unclear (H2, Figure 2.1).
Urbanization is also expected to increase overall connectivity between developed and undeveloped covers as greenfields are dissected with impervious covers along functional gradients (e.g. hydrological) which may place net nutrient loaders proximal to stream and other water features, reducing opportunities for infiltration and vegetative uptake, increasing export (H3, Figure 2.1). The intensification of land use associated with urban forms is in many cases a disturbance (e.g. soundscapes Barber et al., 2011) that goes beyond the state change that occurs with land conversion, and is often accompanied by land covers that
dramatically change the nature of stored carbon (Raciti, Hutyra, Rao, & Finzi, 2012) and load nutrients in the form of waste, fertilizers, and atmospheric deposit of air pollution (H4,
Figure 2.1).
2.3.2 Study System