Copyright2000 by the Genetics Society of America
Archaic Lineages in the History of Modern Humans
Damian Labuda,*
,†Ewa Zie˛tkiewicz
†and Vania Yotova
†*Department of Pediatrics, University of Montreal and†Research Center, Sainte-Justine Hospital, Charles-Bruneau Cancer Center, Montreal, Quebec H3T 1C5, Canada
Manuscript received January 28, 2000 Accepted for publication June 26, 2000
ABSTRACT
An important question in the ongoing debate on the origin ofHomo sapiensis whether modern human populations issued from a single lineage or whether several, independently evolving lineages contributed to their genetic makeup. We analyzed haplotypes composed of 35 polymorphisms from a segment of the dystrophin gene. We find that the bulk of a worldwide sample of 868 chromosomes represents haplotypes shared by different continental groups. The remaining chromosomes carry haplotypes specific for the continents or for local populations. The haplotypes specific for non-Africans can be derived from the most frequent ones through simple recombination or a mutation. In contrast, chromosomes specific for sub-Saharan Africans represent a distinct group, as shown by principal component analysis, maximum likelihood tree, structural comparison, and summary statistics. We propose that African chromosomes descend from at least two lineages that have been evolving separately for a period of time. One of them underwent range expansion colonizing different continents, including Africa, where it mixed with another, local lineage represented today by a large fraction of African-specific haplotypes. Genetic admixture involving archaic lineages appears therefore to have occurred within Africa rather than outside this continent, explaining greater diversity of sub-Saharan populations observed in a variety of genetic systems.
I
N the ongoing debate on the origin ofHomo sapiens, provides evidence for a discontinuity in the genetic makeup of the present-day humans. In particular, (i) genetic studies usually support therecently-out-of-Africa model, according to which modern humans it provides evidence for an expansion of one lineage throughout different continents and (ii) it suggests that emerged in Africa 200,000 to 100,000 years ago and
then dispersed throughout the Old World, replacing a greater genetic diversity in sub-Saharan Africans as compared to other continental populations could be preexisting archaic hominids with little or no admixture
(Cannet al.1987;StringerandAndrews1988;Har- due to enrichment of their genetic pool through admix-ture with independently evolving local lineage(s). pendinget al.1993;Cavalli-Sforzaet al.1994;Chen
et al.1995;Horaiet al.1995; Nei1995;Batzer et al. 1996; Tishkoff et al. 1996; Krings et al. 1997). The
MATERIALS AND METHODS greater genetic variability in sub-Saharan Africa, seen
in the molecular data (Cann et al.1987; Bowcock et Populations:The reported haplotypes represent the popula-tion sample consisting of 262 sub-Saharan African chromo-al. 1991, 1994; Jorde et al. 1997; Clark et al. 1998;
somes (58 West African, 56 M’Buti, and 81 Biaka Pygmy, and
Hammeret al.1998;Zietkiewiczet al.1998) as well as
67 African American); 187 European (25 Polish, 26 Italian, in craniometic measurements (Relethfordand
Har-106 French-Canadian, and 30 of mixed European origin); 195
pending 1994), was used as an argument for (i) the Asian (65 Japanese, 80 Chinese, 22 Siberian, 28 Mongolian); older age of the population in Africa (Cannet al.1987) 159 from the Americas (76 Maya and 83 Karitiana), and 65 from Oceania (24 Coastal and 41 Highland New Guinea Pa-and (ii) a larger long-term effective population size on
puan chromosomes). DNA samples were kindly provided by this continent (Relethford and Harpending et al.
M. Batzer, M. Jamba, J. Jaruzelska, K. Kidd, D. Modiano and 1995;RogersandJorde1995;Zietkiewiczet al.1998). L. Osipova or isolated from peripheral blood collected with The underlying assumption in these interpretations was prior informed consent from volunteers in Montreal. All sam-a continuity of genetic pools sam-among populsam-ations of mod- ples, except for Mongolians and additional Europeans, were previously analyzed fordys44polymorphisms, as reported by ern humans, possibly constrained by the recent
out-of-Zietkiewicz et al.(1997, 1998). Africa demographic bottleneck (Tishkoffet al.1996).
Nucleotide diversity data and derivation of haplotypes:The Our analysis of DNA haplotypes in an 8-kb segment from genomic segmentdys44comprises 7622 bp of mostly intronic the dystrophin gene (hereafter referred to as dys44) sequence surrounding exon 44 of the human dystrophin gene on the Xp21. Thirty-five simple nucleotide polymorphisms, including two three-nucleotide deletions and one eight-nucle-otide duplication as well as one three-allelic site due to two
Corresponding author:Damian Labuda, Charles-Bruneau Cancer
Cen-substitutions, were previously ascertained by single-strand
con-ter, Research Cencon-ter, Sainte-Justine Hospital, 3175 Coˆte-Ste
Cather-formational polymorphism heteroduplex analysis in 250
ine, Montreal, Quebec H3T-1C5, Canada.
E-mail: damian.labuda@umontreal.ca worldwide distributed chromosomes (Zietkiewiczet al.1997).
The analyzed population samples were subsequently typed using allele frequencies at 35dys44segregating sites in differ-ent populations or groups of chromosomes was carried out by allele-specific oligonucleotide hybridization as described
(Zietkiewiczet al.1997). using the program Population Structure Statistics by Harpend-ing (Harpendinget al.1996), kindly provided by M. Batzer. The haplotypes reported here were derived as a subset of
an extended population sample of 1289 chromosomes, which A maximum likelihood tree from the allele frequencies was constructed using CONTML (and evaluated using BOOT-included additional chromosomes of Euroasiatic origin (to
be reported elsewhere—E. Zietkiewicz, V. Yotova and D. STRAP) program from Phylip package 3.5 (Felsenstein
1993). The tree was rooted by setting at 1.0 the frequencies
Labuda, unpublished results). Converting autosomal
geno-type data into haplogeno-types typically requires pedigree analysis of ancestral alleles inferred by comparison with orthologous positions in chimpanzee, gorilla, and/or orangutan DNA: the or additional experimental effort like allele-specific
amplifica-tion to determine the phase (e.g.,Fullertonet al.1994;Har- human allele identical by state with at least two of the great ape orthologues was considered ancestral. Given the mutation
ding et al. 1997; Clark et al. 1998). Computer-assisted
ap-proaches rely on subtracting known haplotypes from the rate in the order of 10⫺9per nucleotide site per year, there is a very small chance that a recurrent event would have taken multiple heterozygote genotypes, which eventually initiates a
cascade of haplotype solving (Clark1990). In the X-linked place since the divergence of these species and the human lineage 5–12 million years ago. In other words, the probability
dys44segment the derivation of haplotypes was straightforward
in hemizygous males as well as in homozygous and single is negligible that a human allele identical with the correspond-ing site in the great apes results from a back mutation or that heterozygous females. These haplotypes represented 67% of
the chromosomes in the sample analyzed (in Figure 1, these three identical mutations occurred independently after the separation of these lineages. In practice, therefore, in the case haplotypes have names beginning with an uppercase B). In the
next step the remaining multiple-heterozygous female samples of simple nuclear DNA polymorphisms considered here, the identity by state of a human allele and the corresponding were resolved assuming the most likely combinations of two
unambiguously solved haplotypes. Compared to the algorithm positions in great apes is tantamount to their identity by de-scent (Zietkiewicz et al.1998). Nucleotide diversity,h, was described by Clark (1990) our approach additionally took
advantage of the population frequencies of the unambigu- calculated from allele frequencies (gene counting) at 35 segre-gating sites in the total sample, in Africans and non-Africans, ously assigned haplotypes. Briefly, an algorithm was
imple-mented (ACCESS database) creating a table with the geno- or in population subgroups containing common or specific haplotypes. The FST statistic was evaluated as (hT⫺ hS)/hT, types in question presented, whenever possible, as a sum of
wherehTcorresponds to the nucleotide diversity of the entire two known haplotypes in all combinations. All unique
solu-population (calculated from the weighted allele frequencies) tions were accepted, whereas in the case of multiple choices,
and hS to the average of the contributing subpopulations choosing the most likely combination was based on two
crite-(HartlandClark1989). If two subpopulations diverge and ria: (i) the combined frequencies (product) of the
contribut-remain genetically isolated,FSTis expected to grow with time: ing haplotypes and (ii) these haplotypes’ hierarchical
occur-FST(g)⫽1⫺exp(⫺g/2N), whereNis the long-term effective rence, with the priority given to the local population, then to
population size of the diverging populations andgis the num-the closest group, and finally to num-the continental cluster (when,
ber of generations since the divergence (Wright1969); in for a given sample, these two criteria favored two different
the case ofdys44, 1.5Nrather than 2Nhas to be used in the solutions, the genotype was left for “manual” solving). This
formula above, correcting for the ratio of X chromosomes to phase resulted in resolving 25% of all chromosomes (or
three-autosomes. fourths of multiple heterozygous genotypes). The remaining
genotypes (8.2% of all chromosomes) could not be presented as a sum of two known haplotypes, but in a significant portion
a contribution of one of the known haplotypes could be recog- RESULTS
nized. The choice of a new haplotype from among all possible
combinations that included a known haplotype was done Excess ofdys44variability in Africa:Indys44segment, “manually.” The most likely solutions were chosen, taking into 36 simple polymorphisms were previously ascertained account the population frequency of the known haplotype in a sample of 250 X chromosomes from all over the and the recurrent appearance of the new derived haplotype.
world (Zietkiewicz et al. 1997, 1998). Following ex-Simplicity of the new haplotype structure was used as an
addi-tended genotyping of these polymorphisms in more tional criterion: a new haplotype was chosen if it could be
derived preferably by a single (or if not, by a double) recombi- than a thousand chromosomes (not shown), 21 new nation between known haplotypes, whose frequencies in popu- alleles were found distributed worldwide, 13 were con-lations were taken into account in the case of multiple choices. firmed unique to sub-Saharan Africa (hereafter referred In the portion of genotypes solved in this way (5.6% of the
to as Africa), and only 2 were restricted to populations total),i.e., by indirectly inferring novel haplotypes, these were
from other continents ( Japan and Papua New Guinea). assigned names beginning with a lowercase b. The remaining
genotypes were left unsolved since (i) no contribution of any The new information reported here was obtained by known haplotype could be recognized, (ii) several solutions analyzing polymorphic sites in their genomic context, were equally likely using the criteria above, or (iii) no simple i.e., as haplotypes representing combinations of alleles likely connection (through recombination or mutation) to
on a single chromosome. Dys44 haplotypes shown in known haplotypes could be assigned. As a result 17 samples
Figure 1 were built from 35 sites,i.e., excluding a solitary (34 chromosomes, 2.6% of the total) were excluded from
further analyses [for this reason site 86 (seeZietkiewicz et African site 86 (see materials and methods) and al.1998) was not considered here]; the number of reported counting a single three-allelic polymorphism as two sep-haplotypes is thus conservative. Haplotypes found in more arate sites, 95 and 96. Derivation of haplotypes required than one continental group of populations were called
com-substantial additional experimental effort; inversion of mon; those restricted to one continental group or to a
popula-an allele due to misreading or mistyping was of little tion were called specific.
but, in most cases, it would have led to a novel false in Figure 1b) were arbitrarily selected to derive the less frequent ones. At three instances (B022, B047, b059) haplotype. The analysis therefore included verification
of the data and retyping of a variety of samples, resulting multiple genetic events, through a number of possible pathways, would have to be postulated to relate these in elimination of spurious haplotypes and confirmation
of the reported ones. with any other known haplotypes—these African
haplo-types were therefore left unassigned (denoted by a ques-Sixty-four haplotypes were observed among 868
chro-mosomes representing 19 populations from different tion mark in the last column in Figure 1b).
Initially, the low world frequency of the new alleles continents. Haplotypes found in populations from more
than one continent are referred to as common, as op- at African-specific sites suggested the recent origin of the underlying mutations (Zietkiewicz et al. 1998). posed to specific ones, found only in a single continental
group. Fourteen haplotypes were classified as common However, their haplotype context contradicts such an interpretation. First, the same new allele is found associ-(Figure 1a). The chromosomes carrying common
hap-lotypes represented 82% of the total sample, and among ated with many different haplotypes, causing the reduc-tion of linkage disequilibrium with the adjacent poly-these, 75% chromosomes in Papuans from New Guinea
(PNGs), 93% in Asians, 93% in Europeans, 96% in Am- morphisms. At four sites the same new allele was associated with at least 3 (up to 11) haplotypes, at four erindians, and only 58% in Africans. Among the
com-mon haplotypes all but one (b052—see Figure 1a) were sites with 2 different haplotypes, and only four sites were uniquely found associated with a single haplotype. This shared between Africans and non-Africans. The
re-maining 50 haplotypes (Figure 1b) were specific to the indicates that the corresponding chromosomes must have undergone multiple historical recombinations. continental groups: 28 were found on chromosomes
from Africans, and 22 were found on chromosomes Second, different African-specific sites tend to cluster within the same haplotype, with up to four new African representing PNGs, Asians, Europeans, and
Amerindi-ans. The greater African diversity relative to other conti- alleles found on the same haplotype (e.g., B047—4 al-leles; B012, B018, B021, and b062—3 sites). Such clus-nental groups was therefore seen in the increased
num-ber ofdys44segregating sites as well as in the excess of tering could have resulted (i) from succession of new mutations within the same chromosome lineage or (ii) specific haplotypes (42 and 8% of all chromosomes from
Africa and outside, respectively); seeSummary statistics from recombinations juxtaposing mutations that arose on independent chromosomes. Both mechanisms are below.
Discontinuity in dys44 haplotypes: Inspecting the expected to require a substantial evolutionary time to generate the observed structure of the African-specific structure ofdys44haplotypes reveals a striking
dissimi-larity between African-specific and the remaining chro- haplotypes. The mutation rate in dys44 was estimated at 2.3⫻10⫺4per generation per segment (Zietkiewicz mosomes. In non-Africans, the groups of common and
specific haplotypes appear to be closely related: specific et al.1998) and the recombination rate can be assumed to be in the same order of 10⫺4 per generation per ones can be most parsimoniously derived (i) by
muta-tions occurring on the most-frequent common haplo- segment (Abbset al.1990).
According to the qualitative analysis above, the spe-types (sites 48 and 87, on B001 and B002, respectively)
or (ii) by recombinations involving two or three com- cific chromosomes in continental groups other than Africans can be directly derived from the common hap-mon haplotypes from ahap-mong the 8 most frequent
(Fig-ure 1b, right column). In contrast, specific haplotypes lotypes, indicating evolutionary continuum, while the African-specific chromosomes appear to represent a in Africans are structurally disparate from the common
ones. First, 19 out of the 28 African-specific haplotypes subset with an evolutionary history distinct from the rest of the sample. A series of tests were carried out are easily recognized by the presence of African-only
polymorphisms (see Figure 1b). Second, the structure to examine these observations independently and to quantify the differences between the continental pools of the haplotypes on which these polymorphisms reside
cannot be related in a simple way to those that are of common and specific chromosomes.
PC analysis:This analysis has the advantage of allowing shared with other continents. Only 5 of the
African-specific haplotypes (B024, B032, B037, b063, and B027) the graphical presentation of multidimensional data in a reduced number of dimensions (Cavalli-Sforza et could be proposed to result from recombinations or
a mutation (at site 64) involving exclusively common al. 1994). First we used the frequencies of 35 dys44 polymorphisms to infer genetic affinities among the haplotypes. The remaining ones cannot be related in a
simple way to the set of common haplotypes; in contrast, populations represented in our sample. Second, to ex-amine whether the effect of continentally restricted they can be easily derived through a single mutation or
through a single or double recombination by implicat- sites, “weighting” especially heavily in the African-spe-cific sample, could alone be responsible for the observed ing other haplotype(s) from the African set. To illustrate
the possibility of such a structural relationship, five fre- effect, the analysis was repeated considering only 21 worldwide distributed polymorphisms. A remarkable quent African-specific haplotypes (B007, B010, B012,
rest of the sample was seen using both total and the reduced number of sites. Figure 2 showing the results for 21 sites illustrates well this effect, which obviously was even more dramatic with 35 polymorphisms (not shown). On the PC plot in Figure 2a geographically related groups of populations cluster together; the vari-ance attributable to the first and the second component (50.4 and 28.2% to the total variance, respectively) re-flected differences between the continental groups and was enhanced by the presence of outliers represented by population isolates such as Karitiana from Brazil, Highland Papuans from New Guinea, and M’Buti Pyg-mies from Congo. To examine the relatedness of the common and specific haplotypes, the groups of com-mon and specific chromosomes in the populations were considered separately (specific chromosomes in non-African populations were pooled continentally because of small per population numbers). This stratification led to a rearrangement of the PC plot (Figure 2b). African-specific chromosomes are clearly separated from the cluster of common African haplotypes found in the center of an even greater cluster including all other non-African groups, both common and specific. This analysis confirms conclusions from structural com-parisons above (Figure 1 and previous section), indicat-ing that the African-specific haplotypes represent lin-eages distinct from those of the common haplotypes and the closely related non-African-specific haplotypes. Phylogenetic analysis:Subsequently, the frequencies of the polymorphisms in dys44were used to construct the maximum likelihood tree of the groups of common and specific haplotypes as in the PC analysis. The tree shown in Figure 3 was constructed considering the 21 worldwide-distributed sites (essentially the same tree, only with deeper separation among the groups of Afri-can-specific chromosomes, was obtained using all 35 polymorphisms, not shown). In the tree, the non-Afri-can populations clustered continentally, with bootstrap analysis supporting grouping of European (82/100) and Amerindian populations (71/100). The separation of the African-specific haplotypes from the remaining groups, including common African haplotypes, was sup-ported by the highest bootstrap value in the tree (88/ 100), thus further reaffirming the distinctiveness of the African-specific haplotypes. In addition, the African-spe-cific haplotypes were the closest to the root of the tree and more dispersed, suggesting that they represented relatively older lineages.
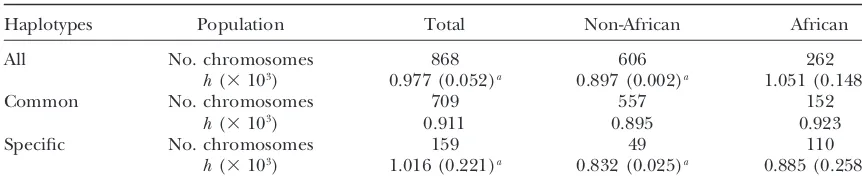
Summary statistics: Table 1 compiles nucleotide di-versity values that were obtained for all chromosomes in the total sample, in non-Africans and Africans (col-umns), and for the corresponding pools of chromo-somes carrying common and specific haplotypes (rows). The overall nucleotide diversity h ⫽ 0.000977 for the total sample is similar to the values obtained with other
loci (LiandSadler1991;Hardinget al.1997;Clark Figure
1.— Dys44 haplotypes occurring o n more than one continent are listed as common (a) while those restricted to a single continent a s specific (b). The haplotypes (built of 35 segregating sites indicated a t the top) are defined by the p resence (number 1 ) o r absence (empty space) o f a n ew allele at each of the sites (a llele shared with the chimpanzee, gorilla, and/or orangutan was considered ancestral). The order o f p olymorphisms corresponds to the physical map; new alleles w hose occurrence is continentally restricted are boxed ( Zietkiewicz et al. 1998). The symbol ⬍⬎ indicates “all except.” In the putative genealogical reconstruction o f specific haplotypes (b, last column) the h aplotype n ame followed b y the name of a segregating site indicates the background haplotype o n which this polymorphism occurred ; the haplotype name followed b y a nother h aplotype n ame(s), separated by /, represents a list of the p roposed parental recombining haplotypes. Five frequent Africa n-specific haplotypes (B007, B010, B012, B017, and B 018) arbitrarily selected to derive the less frequent ones through m utation o r recombination are indicated b y d ashes in the last column. Three African-specific haplotypes (B022, B047, b059) where multiple genetic events, through a number o f possible pathways, would h ave to be postula ted to relate these with any o ther known haplotypes are denoted ? in the last column.
Figure
1.—
Continued
Figure3.—Maximum likelihood tree using allele frequen-cies at 21 worldwide-distributed polymorphisms in pools of common and specific chromosomes from the populations un-der study as indicated in the legend to Figure 2 (S- denotes “specific”). Bootstrap values of more than 70/100 replicates are indicated on the tree.
1999) and leads to the effective population size estimate of 10,900; thehvalues for different subgroups listed in Table 1 yield similar estimates of the effective popula-tion size. However, in the pool of African-specific
chro-Figure 2.—Principal component analysis using allele
fre-mosomes characterized by the overall h value of quencies at 21 worldwide-distributed dys44 polymorphisms.
(a) Within each population, all chromosomes are considered 0.000885, the contribution of the worldwide polymor-together. (b) Chromosomes carrying common and specific phisms is only 0.000627 (i.e., one-third less than in the haplotypes indicated by circles and squares, respectively, are
pool of common chromosomes), which is compensated considered separately; specific chromosomes in non-African
for by the relatively high contribution of the continen-populations were grouped into continental pools to increase
tally restricted sites (0.000258). sample size. Afr (Africans): W1, W2, W3, populations from
West Africa; Fc1, Fc2, French-Canadians from Montreal and The magnitude of the population variance that is due North-Eastern Quebec, respectively; Mb, Mbuti Pygmies; Bi, to the difference among subgroups can be measured Biaka Pygmies; AA, African Americans. Eur (Europeans): Po,
by a statistic FST evaluated from nucleotide diversities Polish; It, Italian; Mt, Montreal; Sa, Saguenay/Lac-St-Jean; Me,
(materials and methods); if two subpopulations di-mixed European origin. Asi (Asians): Ch, Chinese; Ja,
Japa-verge and remain genetically isolated, FST is expected nese; Si, Siberians; Kh, Khalka Mongolians. AmI
(Amerindi-ans): Ma, Maya; Ka, Karitiana. PNG (Papuans from New to grow with time (Wright1969). The world pool of
Guinea): Pc, Coastal; Ph, Highland. common haplotypes subdivided into Africans and
TABLE 1
Nucleotide diversities of the total chromosomal sample and the separate pools of common and specific chromosomes
Haplotypes Population Total Non-African African
All No. chromosomes 868 606 262
h(⫻103) 0.977 (0.052)a 0.897 (0.002)a 1.051 (0.148)a
Common No. chromosomes 709 557 152
h(⫻103) 0.911 0.895 0.923
Specific No. chromosomes 159 49 110
h(⫻103) 1.016 (0.221)a 0.832 (0.025)a 0.885 (0.258)a aThe contribution of the continentally restricted sites (see boxed positions in Figure 1) to the overall
nucleotide diversity (h)value is given between parentheses.
haplotypes was subdivided in a similar way, theFSTvalue considered to represent these lineages, suggests that the time of their separation could have lastedⵑ50,000 years. was 0.167. Not surprisingly, this effect was due to the
specific haplotypes in Africans: stratification of all the Given the underlying assumptions (Wright1969) and uncertainty in N estimate, this should be considered African chromosomes into two pools, of common and
specific haplotypes, led to the substantial FST value of rather as an indication of a time range between 104and 105years. A period of 20,000–100,000 years corresponds 0.141, while similar stratification of non-African
chro-mosomes yielded FST of 0.029. Considering common to that between the appearance of the first anatomically modern humans and the Upper Paleolithic expansion. and specific haplotypes in Africans to represent genetic
pools of independent subpopulations, one may estimate The earliest fossils displaying modern characteristics, from Omo Kibbish in Ethiopia, Klassies River Mouth in (assumingNofⵑ10,000) the period of their separation
at 2260 generations orⵑ45,000 years (see materials South Africa, and Skhul and Oafzeh in Israel, indicate that humans inhabited widely disparate regions within and methods). This estimate uses the effective
popula-tion size based on a number of nuclear data sets and Africa and the Middle East as early asⵑ120,000–100,000 years ago (Bra¨uer 1989; Lahrand Foley 1994), i.e., the assumption of panmixia. If the proposed model of
ancient structure is true, the effective population size during the last interglacial. The following periods of arid climate, due to glacial maxima, could have led to would be lower, and the estimate for the time of
separa-tion should be considered an upper bound. On the the fragmentation of population inhabiting this geo-graphic area (LahrandFoley1999). This would pro-other hand, this has to be taken with extreme caution
due to a great variance associated with such an estimate. mote independent evolution of separated local popula-tions. On the other hand, according to archeological evidence, the Upper Palaeolithic revolution began in DISCUSSION
Africa and outside only around 50,000–40,000 years ago (Klein1995), coinciding with the range expansion and Admixture with ancient lineages: Similar to other
important demographic growths. The evidence for the systems, the dys44 segment reveals greater diversity
latter is found in the mitochondrial DNA (Di Rienzo among sub-Saharan Africans. However, neither the
and Wilson 1991; Rogers and Harpending 1992; older age of African populations (Cannet al.1987;
Tish-Watson et al. 1997; Kivisild et al. 1999; Quintana-koffet al.1996) nor their greater effective population
Murciet al.1999) supported by microsatellite data (Di size (RelethfordandHarpending1995;Rogersand
Rienzoet al.1998;Kimmelet al.1998).Dys44haplotype Jorde 1995) following divergence from the
homoge-data fit a scenario in which previously separated and neous ancestral stock (Zietkiewicz et al. 1998) can
independently evolving lineages mix together. The min-alone explain the pattern and distribution ofdys44
hap-imal model requires at least two such lineages, a local lotypes described above. Examination of the structure
one that stayed in Africa and a second one that ex-ofdys44haplotypes, supported by PC analysis, maximum
panded within this continent and outside, which pre-likelihood trees, and summary statistics, reveals a sharp
sumably occurred in the Upper Paleolithic. discontinuity between groups of common and
African-The contribution of archaic lineages to the genetic specific chromosomes. Although the analysis presented
makeup of present-day populations has been previously here should be considered exploratory, these results
debated in the context of early Eurasian populations, suggest that the genetic pool of sub-Saharan Africans
descendants ofH. erectus, facing the recent out-of-Africa represents two lineages that had evolved separately for
expansion, or in the context of the putative hybridiza-some period of time and eventually hybridized. TheFST
tion between Neanderthals and Upper Paleolithic popu-value obtained for the African sample stratified into
Figure 4.—Archaic African lineages. Comparison of gene trees of PDHA1, ZFX,-globin, and Y chromosome, redrawn from Hammer et al. (1998),
Jaruzelskaet al.(1999), Har-dinget al., (1997), andHarris
and Hey (1999), respectively. The coalescent tree of Xq13.3 was calculated according to
GriffithsandTavare´(1994, 1999) using the data from
Kaessmannet al.(1999). The heights of the trees in million years are shown at the top. The African-only branches are indi-cated by thick lines.
1992;Klein1995;Kringset al.1997;Duarteet al.1999; at or near the root of the coalescent trees) represent almost uniquely African chromosomes, thus essentially TattersalandSchwartz1999). In our data the only
compelling evidence for mixing of separate lineages is displaying the same pattern as in Figure 3. It is notewor-thy that similar topology, with the African-only branches found within the African sample. While not excluding
the possibility of such events outside Africa, our model separated at the root of the tree from the remaining, mixed non-African and African branches, was found differs from others by proposing admixture between
the expanding population (represented by common with the mitochondrial DNA tree as well (Cann et al. 1987; Chenet al. 1995). In Figure 4 the discontinuity haplotypes) and the local (specific) African lineages.
This new interpretation not only embraces findings between African-specific branches and the rest of the world is exceptionally deep in the PDHA1 tree (see, from other genetic systems but also provides a better
explanation. Expansion of the lineages represented by however, Disotell 1999; Harding 1999) and is least pronounced in the Xq13.3 tree, where the ancestral common chromosomes outside Africa can be perceived
as the recently-out-of-Africa bottleneck (Tishkoffet al. haplotype is relatively very frequent and occurs outside Africa as well. In all these trees the split between the 1996); their expansion within Africa can lead to an
interpretation of a contribution of other continents to oldest (locally evolving) African-only branches and the rest of the world takes place at the deepest nodes of the genetic make-up of African populations (Harding
et al.1997;Hammeret al.1998). The joint contribution the tree, as in Figure 3. The height of these trees (see Figure 4), dating this split accordingly, differs substan-of the “expanding” and “local” lineages, which increases
genetic diversity of the present-day African genetic pool, tially. However, these coalescent estimates were ob-tained using the simple model of a homogenous, con-can be interpreted as the indication of greater antiquity
(Cannet al.1987) or larger long-term effective popula- stant-size population. When we take into account the present data that suggest admixture involving indepen-tion size of Africans (Relethford and Harpending
1995;RogersandJorde1995). Given structural discon- dent lineages, the simple model used in these calcula-tions above does not hold, and the resulting time esti-tinuity in the African genetic pool, seen clearly indys44
data but also apparent from the examination of gene mates (Figure 4) will have to be reevaluated under different demographic and evolutionary scenarios. trees from other systems (see below), these genetic
find-ings can be most parsimoniously explained within the Combining dys44 polymorphisms into a haplotype provided important information that could not be frame of the proposed model.
Other data:The interpretation above finds support at gained by analyzing them separately. The high contribu-tion of recombinacontribu-tions into dys44 haplotype diversity, other nuclear loci tested for polymorphisms in genomic
samples of different geographic origin. In the studies while preventing an application of standard methods of coalescent analysis that make use of the whole data of three X-linked DNA segments, PDHA1 (Harrisand
Hey1999), ZFX (Jaruzelskaet al.1999), and Xq13.3 in the gene tree, allowed us to look at the history of the analyzed segment from a different perspective. How-(Kaessmannet al.1999), of a fragment of the-globin
gene (Hardinget al.1997), as well as the Y chromosome ever, it seems that optimal analytical tools with which to investigate jointly recombination and mutational data (Hammeret al.1998), owing to the absence of
recombi-nations (or by neglecting their relatively minor contri- under complex demographic scenarios have not yet been developed. We hope that our results will stimulate bution), it was possible to analyze the underlying gene
trees by coalescent approach making use of the full data the development of new and perhaps more appropriate methods of formal genetic analysis for studying the his-(Griffiths and Tavare´ 1994). In the corresponding
Harding, R. M.,1999 More on the X files. Proc. Natl. Acad. Sci. We thank A. Di Rienzo and E. Poloni for comments on the earlier USA96:2582–2584.
version of the manuscript, J-F. Bibeau and D. Gehl for assistance in Harding, R. M., S. M. Fullerton, R. C. Griffiths, J. Bond, M. J. Cox data analysis and numerous contributions of DNA samples, M. Jamba et al., 1997 Archaic African and Asian lineages in the genetic for typing the Mongolian DNA, and R. Ballarano for secretarial assis- ancestry of modern humans. Am. J. Hum. Genet.60:772–789.
Harpending, H. C., S. T. Sherry, A. R. RogersandM. Stoneking, tance. This work was supported by the CGAT Program and the Medical
1993 The genetic structure of ancient human populations. Research Council of Canada.
Curr. Anthropol.34:483–496.
Harpending, H., J. RelethfordandS. T. Sherry,1996 Methods and models for understanding human diversity, pp. 283–299 in
Molecular Biology and Human Diversity, edited byA. J. Boyceand
LITERATURE CITED C. G. N. Mascie-Taylor. Cambridge University Press,
Cam-bridge, UK. Abbs, S., R. G. Roberts, C. G. Mathew, D. R. Bentley andM.
Harris, E. E.,andJ. Hey,1999 X chromosome evidence for ancient Bobrow,1990 Accurate assessment of intragenic
recombina-human histories. Proc. Natl. Acad. Sci. USA96:3320–3324. tion frequency within the Duchenne muscular dystrophy gene.
Hartl, D. L.,andA. G. Clark,1989 Principles of Population Genetics.
Genomics7:602–606.
Sinauer Associates, Sunderland, MA. Batzer, M. A., S. S. Arcot, J. W. Phinney, M. Alegria-Hartman,
Horai, S., K. Hayasaka, R. Kondo, K. TsuganeandN. Takahata, D. H. Kasset al., 1996 Genetic variation of recent Alu insertions
1995 Recent African origin of modern humans revealed by com-in human populations. J. Mol. Evol.42:22–29.
plete sequences of hominoid mitochondrial DNAs. Proc. Natl. Bowcock, A. M., J. Kidd, J. L. Mountain, J. M. Hebert, L.
Caroten-Acad. Sci. USA92:532–536. utoet al., 1991 Drift, admixture, and selection in human
evolu-Jaruzelska, J., E. Zietkiewicz, M. Batzer, D. E. C. Cole, J.-P. Moisan tion: a study with DNA polymorphisms. Proc. Natl. Acad. Sci.
et al., 1999 Spatial and temporal distribution of the neutral USA88:839–843.
polymorphisms in the last ZFX intron: analysis of the haplotype Bowcock, A. M., A. Ruiz-Linares, J. Tomfohrde, E. Minch, J. R.
structure and genealogy. Genetics152:1091–1101. Kiddet al., 1994 High resolution of human evolutionary trees
Jorde, L. B., A. R. Rogers, M. Bamshad, W. S. Watkins, P. Krakow-with polymorphic microsatellites. Nature368:455–457.
iad et al., 1997 Microsatellite diversity and the demographic Bra¨uer, G.,1989 The evolution of modern humans: a comparison
history of modern humans. Proc. Natl. Acad. Sci. USA94:3100– of the African and non-African evidence, pp. 124–154 in The
3103.
Origins and Dispersal of Modern Humans: Behavioural and Biological
Kaessmann, K., F. Heisig, A. von HaeselerandS. Paabo, 1999
Perspectives, edited byP. MellarsandC. B. Stringer.Edinburgh
DNA sequence variation in a non-coding region of low recombi-University Press, Edinburgh.
nation on the human X chromosome. Nat. Genet.22:78–81. Cann, R. L., M. StonekingandA. C. Wilson,1987 Mitochondrial
Kimmel, M., R. Chakraborty, J. P. King, M. Bamshad, W. S. Watkins DNA and human evolution. Nature325:31–36.
et al., 1998 Signatures of population expansion in microsatellite Cavalli-Sforza, L. L., P. MenozziandA. Piazza,1994 The History
repeat data. Genetics148:1921–1930.
and Geography of Human Genes. Princeton University Press,
Kivisild, T., M. J. Bamshad, K. Kaldma, M. Metspalu, E. Metspalu Princeton, NJ.
et al., 1999 Deep common ancestry of Indian and western-Eur-Chen, Y.-S., A. Torroni, L. Excoffier, A. S.
Santachiara-Benere-asian mitochondrial DNA lineages. Curr. Biol.9:1331–1334. cettiandD. C. Wallace,1995 Analysis of mtDNA variation
Klein, R. G.,1995 Anatomy, behavior and modern human origins. in African populations reveals the most ancient of all human
J. World Prehist.9:181–183. continent-specific haplogroups. Am. J. Hum. Genet.57:133–149.
Krings, M., A. Stone, R. W. Schmitz, H. Krainitzki, M. Stonekinget
Clark, A.,1990 Inference of haplotypes from PCR-amplified
sam-al., 1997 Neandertal DNA sequences and the origin of modern ples of diploid populations. Mol. Biol. Evol.7:111–122.
humans. Cell90:19–30. Clark, A., K. M. Weiss, D. A. Nickerson, S. L. Taylor, A. Buchanan
Lahr, M. M.,andR. Foley,1994 Multiple dispersals and modern
et al., 1998 Haplotype structure and population genetic
infer-human origins. Evol. Anthropol.3:48–60. ences from nucleotide-sequence variation in human lipoprotein
Lahr, M. M.,andR. Foley, 1999 Towards a theory of modern lipase. Am. J. Hum. Genet.63:595–612.
human origins: geography, demography and diversity in recent Di Rienzo, A.,andA. C. Wilson,1991 Branching pattern in the
human evolution. Am. J. Phys. Anthropol.27(Suppl.): 137–176. evolutionary tree for human mitochondrial DNA. Proc. Natl.
Li, W. H.,andL. A. Sadler,1991 Low nucleotide diversity in man. Acad. Sci. USA88:1597–1601.
Genetics129:513–523. Di Rienzo, A., P. Donnelly, C. Toomajian, B. Sisk, A. Hillet al.,
Nei, M.,1995 Genetic support for the out of Africa theory of human 1998 Heterogeneity of microsatellite mutations within and
be-evolution. Proc. Natl. Acad. Sci. USA92:6720–6772. tween loci, and implications for human demographic histories.
Quintana-Murci, L., O. Semino, H.-J. Bandels, G. Passarino, K. Genetics148:1269–1281.
McElreaveyet al., 1999 Genetic evidence of an early exit of Disotell, T. R.,1999 Human evolution: origins of modern humans
Homo sapiens from Africa through eastern Africa. Nat. Genet. still look recent. Curr. Biol.9:R647–R650.
23:437–441. Duarte, C., J. Maurı´cio, P. B. Pettitt, P. Souto, E. Trinkauset
Relethford, J. H.,andH. C. Harpending,1994 Craniometric
varia-al., 1999 The early upper paleolithic human skeleton from the
tion, genetic theory and modern human origins. Am. J. Physical. Abrigo do Lagar Velho (Portugal) and modern human
emer-Anthropol.95:249–270. gence in Iberia. Anthropology96:7604–7609.
Relethford, J. H.,andH. C. Harpending,1995 Ancient differ-Felsenstein, J.,1993 PHYLIP (Phylogeny Inference Package),
Ver-ences in population size can mimic a recent African origin of sion 3.5p, distributed by the author. Department of Genetics,
modern humans. Curr. Anthropol.36:667–673. University of Washington, Seattle (1989 PHYLIP—Phylogeny
Rogers, A. R.,and H. C. Harpending,1992 Population growth Inference Package, Version 3.2. Cladistics5:164–166).
makes waves in the distribution of pairwise genetic differences. Fullerton, S. M., R. M. Harding, A. J. BoyceandJ. B. Clegg,
Mol. Biol. Evol.9:552–569. 1994 Molecular and population genetic analysis of allelic
se-Rogers, A. R.,andL. B. Jorde,1995 Genetic evidence on modern quence diversity at the human-globin locus. Proc. Natl. Acad.
human origins. Hum. Biol.67:1–36. Sci. USA91:1805–1809.
Stringer, C. B.,andP. Andrews,1988 Genetic and fossil evidence Griffiths, R. C.,andS. Tavare´,1994 Ancestral inference in
popula-for the origin of modern humans. Science239:1263–1268. tion genetics. Stat. Sci.9:307–319.
Tattersal, I.,andJ. H. Schwartz,1999 Hominids and hybrids: Griffiths, R. C.,andS. Tavare´,1999 The ages of mutations in
the place of Neanderthals in human evolution. Proc. Natl. Acad. gene trees. Ann. Appl. Prob.9:567–590.
Sci. USA96:7117–7119. Hammer, M. F., T. Karafet, A. Rasanayagam, E. T. Wood, T. K.
Thorne, A. G.,andM. H. Wolpoff,1992 The multiregional evolu-Altheide et al., 1998 Out of Africa and back again: nested
tion of humans. Sci. Am.266:76–83. cladistic analysis of human Y chromosome variation. Mol. Biol.
al., 1996 Global patterns of linkage disequilibrium at the CD4 Zietkiewicz, E., V. Yotova, M. Jarnik, M. Korab-Laskowska, K. K. locus and modern human origins. Science271:1380–1387. Kiddet al., 1997 Nuclear DNA diversity in worldwide distributed Watson, E., P. Forster, M. RichardsandH.-J. Bandelt,1997 Mi- human populations. Gene205:161–171.
tochondrial footprints of human expansions in Africa. Am. J. Zietkiewicz, E., V. Yotova, M. Jarnik, M. Korab-Laskowska, K. K.
Hum. Genet.61:691–704. Kiddet al., 1998 Genetic structure of the ancestral population
Wright, S.,1969 Evolution and the Genetics of Populations,Volume 2, of modern humans. J. Mol. Evol.47:146–155. The Theory of Gene Frequencies. University of Chicago Press,