Copyright2000 by the Genetics Society of America
Conditional Genotypic Probabilities for Microsatellite Loci
Jinko Graham,*
,†,1James Curran
†,2and B. S. Weir
†,*
*National Institute of Statistical Sciences,†Program in Statistical Genetics, Department of Statistics, North Carolina State University, Raleigh, North Carolina 27695-8203
Manuscript received August 3, 1999 Accepted for publication April 17, 2000
ABSTRACT
Modern forensic DNA profiles are constructed using microsatellites, short tandem repeats of 2–5 bases. In the absence of genetic data on a crime-specific subpopulation, one tool for evaluating profile evidence is the match probability. The match probability is the conditional probability that a random person would have the profile of interest given that the suspect has it and that these people are different members of the same subpopulation. One issue in evaluating the match probability is population differentiation, which can induce coancestry among subpopulation members. Forensic assessments that ignore coancestry typically overstate the strength of evidence against the suspect. Theory has been developed to account for coancestry; assumptions include a steady-state population and a mutation model in which the allelic state after a mutation event is independent of the prior state. Under these assumptions, the joint allelic probabilities within a subpopulation may be approximated by the moments of a Dirichlet distribution. We investigate the adequacy of this approximation for profiled loci that mutate according to a generalized stepwise model. Simulations suggest that the Dirichlet theory can still overstate the evidence against a suspect with a common microsatellite genotype. However, Dirichlet-based estimators were less biased than the product-rule estimator, which ignores coancestry.
S
EVERAL authors (e.g.,BaldingandNichols1994, the population-wide genotype probabilities to theex-1995;Lange 1995) have discussed the need to ac- pected joint allele frequencies within a crime-specific
count for the coancestry of individuals when assessing subpopulation for which there are no genetic data. A
the evidential strength of matching DNA profiles in mutation model is assumed in which the allelic state
forensic identification. Matching profiles could reflect after a mutation event is independent of the state prior
genetic homogeneity of a subpopulation, rather than to mutation (Wright 1951; Griffiths 1979). Under
guilt of the suspect. Hence, a fair assessment of DNA this source-invariant mutation model, the joint allele
profile evidence should allow for the possibility that the probabilities within a subpopulation may be expressed
suspect and perpetrator belong to the same subpopula- in terms of the marginal probabilities of the alleles and
tion (Weir 1994). Often, there are no data available identity-by-descent measures appropriate to the genetic
on a crime-specific subpopulation. In such instances, model. Joint allele probabilities determine match
proba-standard product-rule estimators of match probabilities bilities.
(National Research Council1992) assume that the BaldingandNichols(1994) assumed a subdivided
effects of population subdivision are negligible. How- population of constant size and used a coalescent
argu-ever,BaldingandNichols (1997) examined the ge- ment to arrive at expressions for the joint allele
probabil-netic correlations quantifying population differentia- ities within a subpopulation. Subpopulations were not
tion among Caucasians and concluded that coancestry necessarily independent because of migration and
com-was too large to be ignored. They found that product- mon history. A genetic replicate was therefore defined
rule estimators of match probabilities can, in many as the combined evolutionary history of the
subpopula-cases, overstate the strength of evidence against the tions. These authors showed that when the marginal
suspect. probabilities of an allele have reached a steady state,
Theory has been developed to account for the effects the joint allele probabilities within a subpopulation
of coancestry on match probabilities. The theory relates match the moments of a Dirichlet distribution. Since
the genetic model was formulated without reference to a base population, measures of identity by descent were defined in terms of the coalescence of ancestral lines, Corresponding author: Bruce Weir, Program in Statistical Genetics,
Department of Statistics, North Carolina State University, Box 8203, without intervening mutations or migrations. The
mea-Raleigh, NC 27695-8203. E-mail: [email protected] sures therefore depend on the rates of mutation,
migra-1Present address: Department of Mathematics and Statistics, Simon
tion, and coalescence. Coalescence rates, in turn,
de-Fraser University, Burnaby, BC V5A 1S6, Canada.
pend on population size. Hence, under constant
2Present address: Department of Statistics, University of Waikato,
Hamilton, New Zealand. population size and constant mutation and migration
rates, the measures of identity by descent remain con- has been successfully applied previously as a useful first approximation to the complex process of microsatellite stant over time.
WeirandCockerham(1984) proposed an estimator evolution (Fu andChakraborty1998). Throughout, we rely on a simplified demographic model, with param-of the coancestry coefficient under a genetic model in
which each subpopulation is constructed by randomly eters chosen to reflect both a modern population such
drawing individuals from a base population of infinite as New Zealand caucasians and historical human
popu-size. At the time of the base population, the probability lation estimates from the literature (Harpendinget al.
of drawing an allele is assumed to be in steady state. 1998;Kruglyak1999).
The expected value of an allele frequency in the subpop-ulation is therefore equivalent to the allele frequency
in the base population. Thereafter, subpopulations are METHODS
assumed to evolve under similar demographic
condi-Demographic parameters:To simplify the analysis, we tions. Inference is conditional on allele frequencies in
assumed the same demographic history for all subpopu-the base population, and each subpopulation represents
lations in our simulation study. The current number of an independent genetic replicate. In this prospective
2 ⫻ 106 individuals in a subpopulation was chosen to
genetic model, identity by descent is defined with
re-be typical of the effective size of a modern subpopula-spect to the base population and therefore decays with
tion such as New Zealand caucasians. Subpopulations the time elapsed since the base population. Under
equi-were not of constant size over time, but instead under-librium of descent measures within subpopulations,
went exponential growth. Each subpopulation arose higher-order descent measures can be written in terms
5000 generations before present (gbp) from 500
ran-of the pairwise measure ran-of identity by descent (Li1996).
dom individuals in a population of size 10,000 individu-Then joint allele probabilities within a subpopulation
als. Subsequently, each subpopulation evolved indepen-have the Dirichlet form as well, but are defined in terms
dently of the others, with no migration. Prior to 5000
of parameters in the prospective genetic model. Li
gbp, the size of the metapopulation giving rise to the (1996) used the resulting expressions to approximate
subpopulations was constant at 10,000 individuals, and joint allele probabilities early in the history of
constant-there was no subdivision. Historical population sizes are size subpopulations and found that the approximation
based on estimates from the literature (e.g.,
Harpend-performed well.
inget al. 1998;Kruglyak1999), which suggest that the Both approaches invoke the equilibrium distribution
approximate date of the Homo sapiens migration out of of the frequencies of an allele under the
source-invari-Africa is G≈5000 gbp, and that the effective population
ant mutation model, in populations of constant size.
size prior to the migration was N≈10,000 individuals.
Under the source-invariant mutation model, the
equilib-The simple demographic model we have selected re-rium joint allele frequencies within a subpopulation
flects the historical expansion of subpopulations after
are approximately Dirichlet (Wright1951;Griffiths
the migration out of Africa at 5000 gbp. However, prior 1979). However, for microsatellite DNA profiles, a
step-to this migration, a single panmictic population is as-wise mutation model would more realistically reflect
sumed. The impact of subdivision in the African source
replication slippage (Levinson and Gutman 1987)
population was therefore explored in further simula-than a source-invariant model. Although no equilibrium
tions by assuming five subpopulations, each of constant
distribution exists under stepwise mutation (Moran
size 2000 individuals, during the interval from 5000 to 1975), the Dirichlet approximation is increasingly used
80,000 gbp. Prior to 80,000 gbp, a single panmictic to account for coancestry in assessing forensic evidence
population of size 10,000 individuals was assumed. All from microsatellite profiles. We therefore investigate
parameters associated with times more recent than 5000 the adequacy of the Dirichlet approximation for a
hypo-gbp were kept the same as before. thetical subpopulation in which alleles mutate
ac-Mutation model:Letijbe the probability that a muta-cording to a generalized stepwise mutation model.
tion causes an allele of size i repeats to change to an There are a large number of stepwise mutation
mod-allele of size j repeats. Fu and Chakraborty (1998)
els, starting with the one- and two-step versions proposed
proposed a generalized stepwise mutation model in
for electrophoretic alleles (e.g.,OhtaandKimura1973;
whichijdepends on i and j only through|i⫺j|. Their
Wehrhahn 1975; Moran 1975; Li 1976; Weir et al.
mutation model does not accommodate allele-specific 1976). The generalized stepwise model we have selected
mutation rates, such as the higher rates observed for is parsimonious and sufficiently flexible to
accommo-longer repeats in human samples (Brinkmann et al.
date rare mutations of size larger than a few repeats, a
1998), nor does it accommodate constraints on allele pattern that is suggested by human population samples
size. However, a homogeneous distribution was pre-(DiRienzoet al. 1994). However, the model does not
ferred because it was flexible yet parsimonious and be-accommodate allele-specific mutation rates, such as the
cause only the relative sizes of alleles were known. Under higher rates observed for longer repeats in human
TABLE 1
Allele frequencies of microsatellite marker D8S1179 in New Zealand caucasians
Allele length in repeat units
8 9 10 11 12 13 14 14 16 17
Percentage 2.13 0.45 11.63 7.72 14.54 33.33 17.56 9.40 3.02 0.22
0.90, 0.99; and P⫽ 0.500, 0.800, 0.900, 0.999) and by
examining values at the end points of the plausible
ij⫽
␣P(1⫺P)j⫺i⫺1, j⬎i
(1⫺ ␣)P(1⫺P)i⫺j⫺1, j⬍i.
range, for the New Zealand demographic model.
Allelic associations:Following the notation ofEvett
The parameter␣describes the probability of an increase andWeir(1998), consider a microsatellite locus A with
in repeat number; the size|i⫺j|of the resulting change alleles A
iof length i repeat units in a randomly mating
in allelic length has a geometric distribution with proba- subpopulation. Let p
i and Pij denote, respectively, the
bility P(1⫺P)|i⫺j|⫺1.
probability of drawing an allele Aiand the probability
Other parameters of the model include the mutation of drawing an individual with genotype G⫽ A
iAj in a
rateand the length A of the allele of the most recent subpopulation at present. In both genetic models, p
iis
common ancestor (MRCA) of the sample. We have se- assumed to be in steady state. We emphasize that p
iand
lected a sample of size 1000 chromosomes. Simulations P
ijare, respectively, the allelic and genotypic
probabili-indicate that with high probability (ⵑ0.998) the sample ties averaged over repeated replicates of a
subpopula-MRCA coincides with the subpopula-MRCA of the population. tion, not fixed-population probabilities. Under the
(Even with a more modest sample size of 100 chromo- source-invariant mutation model, genotype
probabili-somes, the probability is still very high at ⵑ0.980.) ties may then be described by
Hence, A may also be viewed as the allelic length of
Pii⫽ pi⫹(1 ⫺ )p2i the MRCA of the population. Given A and the realized
ancestral tree, microsatellite mutations can be placed
Pij ⫽2(1⫺ )pipj, i⬆ j, on the tree, from the root to the tips, as described
byFu and Chakraborty(1998). Conditional on the where the coancestry coefficientis specific to the
ge-netic model. In the gege-netic model ofWeirand
Cock-length of a segment of the tree, the number of mutation
events on the segment is approximated by a Poisson erham(1984),is the probability that two alleles drawn
from a subpopulation at present are identical by descent random variable, with mean equal to the product of the
mutation rate and the segment length. with respect to the base population. In the genetic
model ofBaldingandNichols(1994),is the
proba-For the simulation study, we chose A ⫽9, ⫽5⫻
10⫺4,␣ ⫽0.720, and P⫽0.999. These parameter values bility that two alleles from the same subpopulation
co-alesce with no intervening mutation events on the lines produce simulated allele frequencies consistent with
ob-served frequencies for the microsatellite D8S1179 in a of descent. However, for the high mutation rates typical
of microsatellite markers, both measures are virtually sample of 447 New Zealand caucasian offenders, shown
in Table 1. The selected parameter values also reflect identical given the New Zealand demographic
parame-ters. Figure 1 shows the coancestry coefficient, measured estimates from the literature. Microsatellites have a high
mutation rate ofⵑ10⫺4–10⫺3 per generation (Gyapay first with respect to the base population at 5000 gbp,
and then without reference to a base population. The et al. 1994). Most observed mutations result in a change
of a single repeat unit (Weber and Wong 1993; coancestry coefficient, like the allelic and genotypic
probabilities piand Pij, is defined in terms of
subpopula-DiRienzo et al. 1994), but there are rare events with
larger changes and a tendency toward increasing allelic tion replicates and is not a fixed-population parameter.
Coancestry coefficients were determined empirically, on
length (Brinkmannet al. 1998). On the basis of these
observations, a plausible range of values for microsatel- the basis of 107coalescent replicates for a random pair
of chromosomes from a subpopulation. At the mutation
lite mutation parameters includes 10⫺4 ⱕ ⱕ 10⫺3,
0.5 ⱕ ␣ ⬍ 1, and 0.5 ⱕ P ⬍ 1. Selecting P ⫽ 0.999 rate ⫽0.0005 selected for D8S7911, both coancestry
coefficients areⵑ0.008, a reasonable value given
numer-implies 99.9% of mutations result in a size change of 1
repeat unit, whereas P ⫽ 0.500 implies that⬎99% of ical estimates from population surveys (Cavalli-Sforza
et al. 1994). mutations are expected to result in a change of 7 or
fewer repeat units. In further simulations, alternative To gain insight into the adequacy of the
source-invari-ant mutation model for microsatellites, we compared parameter values were also explored, by perturbing the
D8S1179 values one at a time ( ⫽1⫻10⫺4, 3⫻10⫺4, association parameters describing Pijunder the stepwise
mutation model to the analogous quantity under the
source-invariant mutation model. Associations were de- GP, (1) gives the expressions for genotypes AiAiand AiAj,
i≠j, respectively (EvettandWeir1998):
termined empirically, based on 107coalescent replicates
for a random pair of chromosomes within a random
Pr(GP⫽AiAi|GS⫽AiAi)⫽
[pi⫹ (2⫺pi)][pi⫹ (3⫺pi)] (1⫹ )(1⫹2)
sample of 1000 chromosomes. The within-subpopula-tion correlawithin-subpopula-tion for an allele of length i repeat units is
Pr(GP⫽AiAj|GS⫽AiAj)⫽
2[pi⫹ (1⫺pi)][pj⫹ (1⫺pj)] (1⫹ )(1⫹2) . ii⫽
Pii⫺p2i
pi(1⫺ pi) .
(1)
Under the source-invariant mutation model, this corre- Empirical match probabilities were compared to those
lation coincides with the coancestry coefficient; hence predicted by these equations, using empirically
deter-ii⬅. More generally, however,iican vary with allele mined values of pi and assigned values of ⫽ 0.010,
length i. Another measure of association within a sub- 0.050, 0.100, and 0.150. The values of ⫽ 0.100 and
population, between two alleles of different lengths i⬆ 0.150 are particularly conservative for forensic
calcula-j, is tions (Cavalli-Sforza et al. 1994). Empirical values
were based on 107 coalescent replicates for a random
sample of four chromosomes, within a random sample
1⫺ ij⫽
Pij
2pipj
.
of 1000 chromosomes from a subpopulation. Empirical match probabilities were calculated by dividing the
ob-In a stepwise mutation model, ij is expected to vary
served probability of drawing two members of a
subpop-with the allelic states (Balding and Nichols 1994),
ulation with the given genotype by the observed proba-with positive association between alleles of similar
bility of that genotype. length. Such variation is not accommodated by the
Estimated match probabilities:We also examined the
source-invariant mutation model, which constrainsij⬅
bias, over subpopulation replicates, of the product-rule
. As a diagnostic for the fit of the source-invariant
estimator and an estimator based on the Dirichlet
equa-mutation model, we examined the departure ofiiand
tions (1). The Dirichlet-based estimator is formulated
ijfrom the coancestry coefficient.
unconditionally, over repeated realizations of
popula-Predicted match probabilities:BaldingandNichols
tions or sets of populations. In contrast, the product-rule (1994) showed that, within a randomly mating
subpopu-estimator is formulated conditional on the observed lation of constant size, joint allele probabilities match
population. However, bias of the product-rule estimator the moments of a Dirichlet distribution, provided that
across subpopulation replicates should reflect a
ten-the marginal probabilities of an allele are in steady state dency toward bias at the fixed population level.
and that there are no length-dependent correlations
Typically, forensic databases are constructed using among frequencies. They expressed joint allele
proba-convenience samples from a limited number of
subpop-bilities in terms of the marginal probasubpop-bilities pi of an ulations. To mimic such data, we simulated the ancestry
allele and the coancestry coefficient and used them of random samples of 1000 chromosomes from each of
to derive formulas for match probabilities. For a suspect five subpopulations with demographic and mutation
(S) with genotype GSand perpetrator (P) with genotype model parameter values reflecting D8S7911 in New
Zealand. For each coalescent replicate, the samples were used to build a database of simulated microsatellite
al-lele frequencies. The overall database frequency fiof an
allele of size i repeats was used to estimate the expected
frequency pi. The product-rule estimator of match
prob-ability is 2fifjfor a suspect and perpetrator with genotype
AiAj, i ≠ j, and f2i for a suspect and perpetrator with
homozygous genotype AiAi.
Under a known coancestry coefficient and Dirichlet allele frequencies within subpopulations, a biased esti-mator that takes into account coancestry may be
con-structed by substituting database frequencies fi for pi
into the Dirichlet equations (1). The Dirichlet match
probability formulas are of the form a1⫹b1pi⫹c1pi2for
AiAi homozygotes, and a2⫹ b2(pi⫹pj)⫹c2pipjfor AiAj
heterozygotes, where a1, a2, b1, b2, c1, and c2are constants
Figure1.—Coancestry coefficient vs. mutation rate. Solid
with respect to pi and pj. Although the fiare unbiased
line, pairwise probability of identity by descent without
refer-for pi, substituting f2ifor p2i, or fifjfor pipj, into the formulas
ence to a base population; dotted line, with reference to the
base population at 5000 gbp. leads to bias because E( f2
Figure3.—Within-subpopulation correlationsiifor allele
Ai.
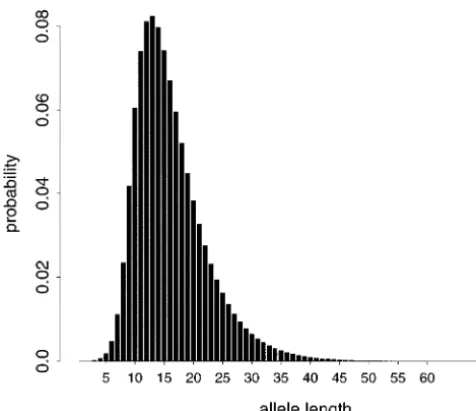
Figure 2.—Probability of sampling an allele of a given
length.
allele lengths than shorter trees. Shorter ancestral trees result in more tightly clustered lengths, closer to the
E(fifj)⫽pipj⫺k2pipj, where k1and k2are constants with ancestral allele. As predicted (Moran1975), the spread
respect to, pi, and pj. of allele lengths within a subpopulation tends to be
When the coancestry coefficient must be estimated, more stable than the mode, which can occasionally drift
or when the Dirichlet approximation no longer holds, toward high repeat numbers. In fact, most variation in
the properties of an estimator based on naive substitu- allelic length (ⵑ80% for the D8S7911 simulations) is
tion are uncertain. We chose a moment estimator of observed across coalescent replicates rather than within
, which is easy to calculate and combines coancestry a replicate.
information across subpopulations (Weir1996).Lange Allelic associations:Allelic correlationsiiare plotted
(1995) used a maximum-likelihood approach to esti- in Figure 3 for parameter values reflecting D8S7911 in
mate the Dirichlet parameters with samples from several New Zealand. The stepwise mutation model introduces
subpopulations. Balding and Nichols (1997) intro- excess correlation, above the correlation of ⫽ 0.008
duced a Bayesian approach to modeling variation in (the coancestry coefficient) that would hold under the
among subpopulations to address the possibility that source-invariant mutation model. The average
correla-subpopulations may have different degrees of coances- tion weighted by allele frequency isR
ipiii≈0.095.
Corre-try, owing to differing demographic histories. However, lation is high for alleles of length 9 and 10 repeat units,
in the current study, all subpopulations were simulated which are associated with shorter ancestral trees. Short
to have the same coancestry coefficient. Hence, model- ancestral trees have alleles that tend to be more tightly
ing of variation in is unnecessary. clustered in length. Correlation is lowest for alleles with
very low repeat numbers, which tend to derive from long ancestral trees carrying alleles with a wider range of
RESULTS lengths. Further simulations indicate that, as expected,
correlation is diminished at higher mutation rates and,
Figure 2 shows the probability of drawing an allele Ai
when␣ ⫽0.5, drops off symmetrically from the ancestral
of length i repeat units from a subpopulation at present
allele length of A⫽ 9. Correlation is also reduced as
under parameter values selected to reflect D8S7911 in
the mutation model parameter P decreases, or the New Zealand. The marginal distribution has a longer
change in allelic length due to a mutation becomes right tail, with a mode of 13 repeat units, and a mean
more variable. The more variable the change in length,
ofⵑ16 units. Over 90% of the time, an allele is between
the wider the range of alleles within a subpopulation, 9 and 28 repeat units in length. The mode and longer
and the lower the allelic correlation. right tail of the distribution are consistent with the
an-Figure 4 displays associations 1 ⫺ ij in the natural
cestral allele A⫽9 and the parameter␣ ⫽0.720
describ-logarithmic scale for selected genotypes AiAj, i⬍j, under
ing the probability of an increase in allelic length given
parameter values selected to reflect D8S7911 in New a mutation event. Generally, over time, the mode of
Zealand. The figure illustrates the general finding that allele frequencies within a subpopulation tends to drift
the rarer the allele, the stronger the association with toward higher repeat numbers. Long ancestral trees
Figure5.—Empirical and predicted match probabilities for Figure4.—Within-subpopulation associations loge(1⫺ ij)
selected genotypes AiAj, i⫽13 and jⱖi. Solid line, empirical
for alleles j⬎ i; solid line, i⫽5; dotted line, i⫽ 20; short
probabilities; dotted line, predicted probabilities ⫽0.010; dashed line, i⫽30; long dashed line, i⫽40.
short dashed line, ⫽0.050; medium dashed line, ⫽0.100; long dashed line, ⫽0.150.
results indicate that as the step-size parameter P is
re-duced, or the mutation rateis increased, the strength
of association decreases. Smaller values of P imply more
type A13A14 approximately correct. However, the
re-variable changes in allelic size (and larger mean step
sulting match probabilities for the A13A13 homozygote
size), which, like larger mutation rates, lead to more
and the less common heterozygotes are then too conser-variability in allelic size within a subpopulation. The
vative. positive association between distinct alleles of similar
In further simulations, match probabilities increased length is at odds with the negative Dirichlet association
with the mutation parameter P as the distribution of that is predicted by the source-invariant mutation
allelic lengths within a subpopulation became more
con-model. Indeed, the overall weighted sumRijPijijfor the
centrated. As the mutation rate increased,
Dirichlet-D8S7911 simulations isⵑ⫺3.6, quite far from the value
based predictions of match probabilities became worse,
of ⫽0.008 predicted by the source-invariant mutation
particularly under small mean step-size (P → 1) and
model.
asymmetric mutation (␣→1). For instance, under ⫽
These diagnostics indicate that the Dirichlet
distribu-10⫺3, ␣ ⫽ 0.990, and P ⫽ 0.999, the true coancestry
tion does not fully capture the pairwise dependence of
⫽0.0005 must be inflated by a factor ofⵑ260 to avoid
alleles under a stepwise mutation model. It is therefore
understating match probabilities for more common ge-reasonable to expect that the joint distribution of three
notypes. However, the resulting predictions for rarer and four alleles, and hence the predicted match
proba-genotypes were then as much as eight times too conser-bilities, would also be misspecified. In the next section,
vative. we investigate the impact of the stepwise mutation
Overall, the Dirichlet approximation performed bet-model on Dirichlet match probabilities predicted by the
ter under low than under high mutation rates. For in-source-invariant mutation model.
stance, at the low rate of ⫽ 10⫺4, Dirichlet match
Predicted match probabilities:Figure 5 shows
empiri-probability predictions based on the true coancestry cally determined match probabilities and those
pre-coefficient were reasonably accurate for common geno-dicted under Dirichlet allele frequencies within a
sub-types, especially under symmetric mutation (␣ ⫽0.500).
population for parameter values selected to reflect
However, predictions for rare genotypes were still con-D8S7911 in New Zealand. Assumed values of the
coan-servative, with some more than twice the true match
cestry coefficient have been substituted in (1) for
probability. The variability in length of allelic change
selected genotypes AiAj, i⫽13 and jⱖi. This is
consis-due to mutation (controlled by P) had little effect on tent with current forensic practice of using assigned
performance.
values for . For the common genotypes, predicted
Under additional population subdivision early in hu-match probabilities systematically understate the
empir-man history, both match probabilities and the coances-ical (true) match probabilities, except when the
coan-try coefficient ( ⫽ 0.009) were slightly increased, as
cestry coefficient is taken to be very high. For example,
expected. The true coancestry coefficient required in-the coancestry coefficient must be inflated to a value of
flation by a factor ofⵑ10 to avoid understating match
0.15, ⬎18 times the true ⫽ 0.008, to make the
common genotype at all 5 loci, we would expect match
probabilities to be underestimated by a factor of 0.515⫽
3⫻ 10⫺2 with the Dirichlet-based estimator and by a
factor of 0.315⫽3⫻10⫺3with the product-rule
estima-tor, assuming statistical independence of alleles at un-linked loci. For 10 loci, we would expect
underestima-tion by factors ofⵑ1⫻10⫺3and 9⫻10⫺6, respectively.
This has implications for current FBI practice (reported in Science 278:1407, 1997) of not quoting match proba-bilities when these drop to some threshold value: it would seem to be important for these thresholds to be determined appropriately.
Further simulations explored the behavior of estima-tors under values at the end points of the plausible range for microsatellite mutation parameters. Estimated match probabilities for a suspect with the most common
Figure6.—Empirical match probabilities and expected
val-genotype were expected to be between 43 and 72%
ues of match probability estimators for selected genotypes
of the true match probability for the Dirichlet-based
AiAj, i⫽13 and jⱖi. Solid line, empirical probabilities; dotted
line, expected value of Dirichlet-based estimator; dashed line, estimator and between 12 and 47% for the product-rule
expected value of product-rule estimator. estimator.
DISCUSSION
the resulting predictions for rarer genotypes were then
as much as three times too conservative. Several aspects of population genetics require
condi-Estimated match probabilities:Figure 6 shows empiri- tional and unconditional genotype probabilities. In
fo-cally determined match probabilities and the expected rensic assessment of DNA profiles, conditional genotype
values of match probability estimators under simula- probabilities are used to calculate match probabilities,
tions reflecting D8S7911 in New Zealand for selected which account for the effects of coancestry (Balding
genotypes AiAj, i⫽13 and jⱖi. The product-rule estima- andNichols1995). The theory is based on a Dirichlet
tor is systematically biased, with a tendency to underesti- approximation to the joint distribution of allele
fre-mation. The Dirichlet-based estimator is less biased, but quencies. Assumptions include a source-invariant
muta-still tends to understate match probabilities for common tion model with steady-state distribution of allele
genotypes. For example, estimated match probabilities frequencies (Wright1951;Griffiths1979) and
pop-for a suspect with the more common genotype A13A14 ulations of constant size. However, modern DNA
pro-are expected to be ⵑ51 and 31% of the true match files are often constructed using microsatellite markers,
probability for the Dirichlet-based and product-rule esti- for which a stepwise mutation model would seem more
mators, respectively. Under additional population sub- realistic. Under stepwise mutation, there is no
steady-division early in human history, these match probability state distribution of allele frequencies (Moran1975).
estimators were expected to be ⵑ40 and 15% of the We have used simulation to investigate the fit of
Di-true value, respectively. richlet-based match probabilities to those under a
gen-The poorer performance of the product-rule estima- eralized stepwise model of mutation. Although a variety
tor under increased subdivision is not surprising. Given of demographic and stepwise mutation models may be
that the product-rule estimator understates the true applied, we have opted for simple versions as useful first
match probability, it is also unsurprising that for com- approximations. Demographic parameters are chosen
mon genotypes so does the Dirichlet-based estimator. to reflect a modern population such as New Zealand
Predicted match probabilities for common genotypes caucasians, as well as historical human population size
AiAjinvolve larger marginal probabilities piand pjin the estimates from the literature. Mutation parameters are
numerator of (1). Larger pi and pj reduce the impor- selected to be consistent with data for a microsatellite
tance of the coancestry coefficient in the numerator locus (D8S7911) used in forensic profiling of New
and make predicted match probabilities more similar Zealand caucasians. Further simulations explore the
ef-to those under the product rule. fect of additional population subdivision early in human
To consider the implications of these results, suppose history and different parameter values for the mutation
profile data from a subpopulation with demographic model. Perturbations of the D8S7911 parameter values
history similar to the hypothetical New Zealand popula- are explored, as well as more extreme values within the
tion are available on 5 unlinked microsatellite loci, all plausible range observed for human microsatellites.
with mutation parameters similar to those reflecting Our results confirm that it is important to account
implications for investigating identity and paternity, pp. 3–12 in
that the product-rule estimator is systematically biased,
Human Identification: The Use of DNA Markers, edited byB. S. Weir.
with a tendency to underestimate match probabilities. Kluwer Academic Publishers, Dordrecht, The Netherlands.
Balding, D. J.,andR. A. Nichols,1997 Significant genetic
correla-However, our results also illustrate potential problems
tions among Caucasians at forensic DNA loci. Heredity 78: 583–
with the growing use of the Dirichlet approximation
589.
for microsatellite profiles. As shown in Figure 6, the Brinkmann, B., M. Klintschar, F. Neuhuber, J. Hu¨ hne andB.
Rolf,1998 Mutation rate in human microsatellites: influence
Dirichlet-based estimator is less biased, but still tends
of the structure and length of the tandem repeat. Am. J. Hum.
to underestimate match probabilities for more common
Genet. 62: 1408–1415.
genotypes. However, as shown in Figure 5, such underes- Cavalli-Sforza, L., P. MenozziandA. Piazza,1994 The History
and Geography of Human Genes. University Press, Princeton, NJ. timation may be avoided by setting the coancestry
coef-DiRienzo, A., A. C. Peterson, J. C. Garza, A. M. Valdes, M.
Slat-ficient to be very high. The price for such corrections kinet al., 1994 Mutational processes of simple sequence repeat
is overly conservative predictions for rarer genotypes. loci in human populations. Proc. Natl. Acad. Sci. USA 91: 3166–
3170.
For example, in the simulations reflecting D8S7911 in
Evett, I.,andB. Weir,1998 Interpreting DNA Evidence. Sinauer
Asso-New Zealand, some predicted match probabilities were ciates, Sunderland, MA.
more than three times the empirical value. Fu, Y.-X.,andR. Chakraborty,1998 Simultaneous estimation of
all the parameters of a stepwise mutation model. Genetics 150:
It is clear that allelic associations must be taken into
487–497.
consideration when estimating match probabilities for Griffiths, R. C.,1979 A transition density expansion for a
multi-microsatellite profiles. However, as shown in Figures 3 allele diffusion model. Adv. Appl. Prob. 11: 310–325.
Gyapay, J., J. Morisette, A. Vignal, C. Dib, C. Fizameset al., 1994 and 4, these associations are inadequately characterized
The 1993–94 Ge´ne´thon human genetic linkage map. Nat. Genet.
by the coancestry coefficient. Estimation procedures for- 7:246–249.
mulated under the source-invariant mutation model will Harpending, H. C., M. A. Batzer, M. Gurven, L. B. Jorde, A. R.
Rogerset al., 1998 Genetic traces of ancient demography. Proc.
therefore be ineffective. One alternative suggested by
Natl. Acad. Sci. USA 95: 1961–1967.
the current study is a coalescent-based estimator. For Kruglyak, L.,1999 Prospects for whole-genome linkage
disequilib-a given microsdisequilib-atellite locus, disequilib-avdisequilib-aildisequilib-able ddisequilib-atdisequilib-a from well- rium mapping of common disease genes. Nat. Genet. 22: 139–144.
Lange, K.,1995 Applications of the Dirichlet distribution to forensic
characterized populations could be used to estimate the
match probabilities, pp. 107–117 in Human Identification: The Use
appropriate mutation parameters. Fu and Chakra- of DNA Markers, edited byB. S. Weir.Kluwer Academic
Publish-ers, Dordrecht, The Netherlands.
borty(1998) describe one such analysis. Estimated
pa-Levinson, G.,andG. A. Gutman,1987 Slipped strand mispriming:
rameters could then be used to evaluate match
probabil-a mprobabil-ajor mechprobabil-anism for DNA sequence evolution. Mol. Biol. Evol.
ities empirically, in conjunction with a variety of 4:203–221.
Li, W. H.,1976 Distribution of nucleotide differences between two
plausible demographic histories for the population of
randomly chosen cistrons in a subdivided population: the finite
the suspect. However, for a given mutation model, such
island model. Theor. Popul. Biol. 10: 303–308.
a procedure would only be as good as the parameter Li, Y.-J.,1996 Characterizing the Structure of Genetic Populations. Ph. D.
thesis, North Carolina State University, Raleigh, NC.
estimates. The statistical properties of estimators of
mu-Moran, P. A. P.,1975 Wandering distributions and the
electropho-tation parameters are uncertain and require further retic profile. Theor. Popul. Biol. 8: 318–330.
investigation. National Research council,1992 DNA Technology in Forensic
Sci-ence. National Academy Press, Washington, DC.
We thank Dr. John Buckleton and the Institute of Environmental Ohta, T.,andM. Kimura,1973 A model of mutation appropriate Science and Research Limited of New Zealand for the data, and Dr. to estimate the number of electrophoretically detectable alleles Ian Painter for helpful discussions. This work was supported in part in a finite population. Genet. Res. 22: 201–204.
by National Institutes of Health grant GM-45344 to North Carolina Weber, J.,andC. Wong,1993 Mutation of human short tandem repeats. Hum. Mol. Genet. 2: 1123–1128.
State University and by National Science Foundation grants
DMS-Wehrhahn, C.,1975 The evolution of selectively similar electropho-9208758, DMS-9700867, and DMS-9711365 to the National Institute
retically detectable alleles in finite natural populations. Genetics of Statistical Sciences, and in part by a postdoctoral fellowship from
80:375–394. the New Zealand Foundation for Research in Science and Technology
Weir, B. S.,1994 The effects of inbreeding on forensic calculations. (FORST) to J.M.C. Annu. Rev. Genet. 28: 597–621.
Weir, B. S.,1996 Genetic Data Analysis II. Sinauer Associates,
Sunder-land, MA.
Weir, B. S.,andC. Cockerham,1984 Estimating F-statistics for the
LITERATURE CITED analysis of population structure. Evolution 38: 1358–1370.
Weir, B. S., A. H. D. BrownandD. R. Marshall, 1976 Testing
Balding, D. J.,andR. A. Nichols,1994 DNA profile match proba- for selective neutrality of electrophoretically detectable protein bility calculation: how to allow for population stratification, relat- polymorphisms. Genetics 84: 639–659.
edness, database selection and single bands. Forensic Sci. Int. Wright, S.,1951 The genetical structure of populations. Ann.
Eu-64:125–140. gen. 15: 323–354.
Balding, D. J.,andR. A. Nichols,1995 A method for quantifying