Copyright 0 1996 by the Genetics Society of America
Maximizing
Transcription Efficiency Causes Codon Usage
Bias
Xuhua
XiaMuseum of Natural Science and Department of Zoology and Physiology, Louisiana State University, Baton Rouge, Louisiana 70803 and Department of Ecology and Biodiversity, University of Hong Kong, Hong Kong
Manuscript received April 15, 1996 Accepted for publication August 9, 1996
ABSTRACT
The rate of protein synthesis depends on both the rate of initiation of translation and the rate of elongation of the peptide chain. The rate of initiation depends on the encountering rate between ribosomes and mRNA, this rate in turn depends on the concentration of ribosomes and mRNA. Thus, patterns of codon usage that increase transcriptional efficiency should increase mRNA concentration, which in turn would increase the initiation rate and the rate of protein synthesis. An optimality model of the transcriptional process is presented with the prediction that the most frequently used ribonuclec- tide at the third codon sites in mRNA molecules should be the same as the most abundant ribonucleotide in the cellular matrix where mRNA is transcribed. This prediction is supported by four kinds of evidence. First, A-ending codons are the most frequently used synonymous codons in mitochondria, where ATP is much more abundant than that of the three other ribonucleotides. Second, A-ending codons are more frequently used in mitochondrial genes than in nuclear genes. Third, protein genes from organisms with a high metabolic rate use more A-ending codons and have higher A content in their introns than those from organisms with a low metabolic rate.
G
ENOMES from distantly related organisms exhibit different patterns of synonymous codon usage (GRANTHAM et al. 1980, 1981). In addition to this inter- genome difference, there are substantial intergene dif- ferences within the same genome (GOW and GAUTIER 1982; IKEMURA 1985, 1992; SHARP and LI 1986, 1987;SHARP et al. 1988). Natural selection for increased trans- lational efficiency has been proposed as the major hy- pothesis for the intergenome and -gene differences in codon usage (KIMURA 1983; ROBINSON et al. 1984; KUR- LAND 1987a,b; BULMER 1988, 1991). Three lines of evi- dence appear to support this hypothesis. First, the fre- quency of codon usage is positively correlated with tRNA availability (GOW and GALJTIER 1982; IJSEMURA 1981, 1982, 1985, 1992). Second, the degree of codon usage bias is related to the level of gene expression, with highly expressed genes exhibiting greater codon bias than lowly expressed genes (BENNETZEN and HALL 1982; SHARp and DEVINE 1989; SHARP et al. 1988). Third, mRNA consisting of preferred codons is translated faster than mRNA artificially modified to contain rare codons (SORENSEN et ul. 1989).
Not onIy are there differences in codon usage bias among genomes and among genes within the same ge- nome, but there are also differences in codon usage among different regions of the same gene. For exarn- ple, gene regions of greater amino acid conservation tend to exhibit more dramatic codon usage bias than do regions of less amino acid conservation (AKASHI
Addre.$.$ for correspondence: Xuhua Xia, Department of Ecologj and Biodiversity, University of Hong Kong, Pukfulam Road, Hong Kong. E-mail: [email protected]
Genetics 144: 130’9-1320 (November, 1996)
1994). This has been proposed as resulting from selec- tion for increased translational accuracy (AKASHI 1994;
HARTL et al. 1994), because selection for maximum translational efficiency does not seem satisfactory to ex- plain the phenomenon. However, this can be accommo- dated by the translational efficiency hypothesis if one defines what is maximized as the rate of production of
correctly translated proteins.
What all these studies have shown is that there is strong selection favoring increased rate of protein syn- thesis and that a coding strategy that increases the pep- tide elongation rate (and consequently increases the rate of protein synthesis) is favored by natural selection. However, efficient protein synthesis depends not only on the peptide elongation rate, but also on the initia- tion rate. Moreover, four lines of evidence support the claim that the initiation of protein synthesis, rather than elongation of the peptide chain, is rate-limiting
(BULMER 1991). Thus, if there is selection for increased rate of protein synthesis, then we should expect selec- tion to favor an increase of not only elongation rate, but also initiation rate. The evolutionary consequence of selection for increased elongation rate has been in- vestigated and empirically documented extensively
(Gow and GAUTIER 1982; IKEMURA 1985, 1992; SHARP and LI 1986, 1987; BULMER 1988, 1991; SHARP et al. 1988; SHARP and DEVINE 1989). In contrast, the evolu- tionary consequence of selection for increased initia- tion rate has not been equally well studied.
1310 X. Xia
centration of mRNA and ribosomes. Thus, the initiation rate of protein synthesis can be efficiently increased by increasing mRNA concentration. Both theoretical reasoning and empirical evidence suggest that the num- ber of mRNA copies available is a rate-limiting factor in protein synthesis (XIA 1995). It is conceivable that natural selection should favor increased rate of tran- scription and that a coding strategy leading to increased transcriptional efficiency should be at a selective advan- tage. Thus, studying the pattern of codon usage from the perspective of transcription adds one more dimen- sion to our understanding of the evolution of genetic information.
CONSEQUENCES O F MAXIMIZING TRANSCRIPTIONAL EFFICIENCY
I here present an optimality model showing the effect of maximizing transcription rate on codon usage bias. Suppose that an mRNA molecule of length L is com- posed of A, C, G, and U with frequencies NA, N,, NG
and Nu, respectively ( N A
+
Nc+
NG+
Ncl = L ) . In terms of a chemical equation,k
NA A
+
NcC
+
NG G+
Nu U - t mRNA (1)where k is the velocity constant of the transcriptional process. Let C be the concentration of transcribed mRNA, and let CA, C,,
C,
and C, be the concentration of A, C, G, and U, respectively, in the cellular matrix surrounding the active transcription site. Then, ac- cording to the law of mass action, the rate of transcrip- tion isdC
dt
" - k C ~ A
czc
CEG C ~ J (2)Evidently, if CA is greater than C,, CG and
C
,
,
then the transcription rate is increased by increasing NA and decreasing NC, NG and NcJ with the constraint that ENi = L, where i = A, C, G, U. Consequently, the maximum transcription rate is reached when NA = L and N,: =Equation (2) links the nucleotide composition of mRNA, i.e., NA, NC, NG and Nu, to the relative nucleotide concentration in the cellular matrix at the transcription site, i.e.,
C
,
,
CC,C,
andC
,
.
The equation predicts that the most frequently used nucleotide in mRNA mole- cules should be the same as the most abundant nucleo- tide in the cellular matrix. This implies that the relative concentration of the four nucleotides in the cellular matrix can affect patterns of synonymous codon usage. This hypothesis will hereafter be referred to as the tran- scription hypothesis of codon usage (THCU).The same conclusion can be derived from a deter- ministic model with more explicit assumptions. Con- sider the time required to transcribe a single nucleotide i. Let r be the rate of nucleotides diffusing to the tran- scription site and Pi be the probability that the arriving
NG = Nu = 0.
nucleotide is nucleotide i. Note that Pi (where i = A, C, G, U) simply represents the relative availability of the four nucleotides. Let tl be the time spent in linking this nucleotide to the elongating mRNA chain, and t, be the time spent in rejecting each of the wrong nucleo- tides that diffuse to the transcription site prior to the arrival of the nucleotide i. Now the total time spent in transcribing nucleotide i is
1
T , = - + t i +
r Pi
(;
- 1)where the first term on the right-hand side of the equa- tion is the time needed for the correct nucleotide to arrive at the transcription site, and the third term repre- sents time spent in rejecting the wrong nucleotides prior to the arrival of the correct nucleotide. The total time ( T ) required to transcribe L nucleotides (total elongation time) can be shown to be:
where
Note that N, is a property of the mRNA, whereas Pi is a property of the cellular matrix.
Our objective, then, is to find the conditions that minimize T. Because tl, t, and L are not dependent on
N, and
Pi,
they are treated as constants. Thus, minimiz- ing T in Equation (4) is equivalent to minimizing Y.We rewrite Y as:
NA PC PC Pr,
+
Nc PA PcPuIf PA is the largest of the four, then (PC P, P,) is smaller than either (PA PC; PcJ), (PA PC P,) or (PA PC PC). It is therefore obvious that minimization of Y in Equation
( 5 ) , given that PA is the largest of the four, requires an increase in NA and a decrease in Nc, Nc; and Nu, with the minimum of Y reached when
NA
= L and NC = N,;= Nu = 0. The general prediction from the optimality model, therefore, states that whenever different nucleo- tides in the cellular matrix differ in relative availability, the codon usage of the mRNA should evolve toward increasing the frequency of the most abundant nucleo- tide in the cellular matrix. Thus, we reached the same conclusion as that from the law of mass action.
Transcription and Codon Usage
TABLE 1
Codon usage bias in the mitochondrial genome (mtDNA) of the cow, Bos tuum
1311
Codon AA N RSCU
GCU A 0.84 52
GCC A 91 1.47 GCA A 103 1.66
GCG A 2 0.03
GAA E 78 1.64
GAG E 17 0.36
GGU G 0.53 29
GGC G 62 1.13
GGA G 97 1.77
GGG G 31 0.57
AAA K 90 1.78
AAG K 11 0.22
UUA L 110 1.11
UUG L 16 0.16
cuu
L 0.62 62CUC L 95 0.95
CUA L 285 2.86
CUG L 0.29 29
AUA M 218 1.66
AUG M 44 0.34
ccu
P 42 0.87CCC P 63 1.31
CCA P 85 1.76
CCG P 3 0.06
Codon AA N RSCU
CAA
Q
79 1.82CAG
Q
8 0.18CGU R 7 0.44
CGC R 11 0.70
CGA R 42 2.67
CGG R 3 0.19
ucu
S 51 1.11ucc
S 1.42 65UCA S 99 2.16
UCG S 5 0.1 1
UAA
*
8 3.20UAG
*
1 0.40AGA
*
1 0.40AGG
*
0 0.00ACU T 44 0.57
ACC T 96 1.25
ACA T 153 1.99
ACG T 15 0.19
GUU V 0.84 40
GUC V 48 1.01
GUA V 87 1.83
GUG V 15 0.32
UGA W 92 1.77
UGG W 12 0.23
1
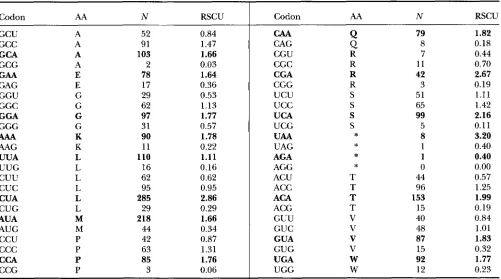
Values are based on all protein-coding genes with a total of 3800 codons in the complete mitochondrial sequence (GenBank accession No. 501394). AA, one-letter code for amino acid; N, number of codons; RSCU, relative synonymous codon usage (calculated as the observed frequency of a codon divided by its expected frequency under the assumption of equal codon usage, SHARP et al. 1986);
*,
stop codons. Note the excess of A-ending codons (shown in bold type) in all synonymous codon families. The probability that RSCU for Aending codons is not greater than 1 is <0.0001. The pattern is similar for rat, rabbit, sheep, human, and macaque.low). In addition, because introns are also transcribed and should be subject to selection maximizing tran- scription efficiency, we expect a nucleotide species to be used more frequently in introns when the concentra- tion of that nucleotide species increases in the cellular medium (prediction 4 below).
PREDICTIONS AND EMPIRICAL TESTS
Prediction 1: A-ending codons should be more fre- quent than alternative synonymous codons in mitochon- drial protein genes: The concentration of cellular ATP is much higher than that of the other three nucleotides (C, G, and U), and the ATP concentration in mitochon- dria is still higher than that in cytosol (BRIDGER and HENDERSON 1983, pp. 4-5). The high ATP concentra- tion in mitochondria might be caused by many factors, and one of these factors is that mitochondria have an efficient transport system to bring ADP into mitochon- dria for ATP production, but the transport system does not carry nonadenine nucleotides (BRIDGER and HEN- DERSON 1983, p. 59-60; OLSON 1986). Given that ATP concentration is higher than that of the other three nucleotides in mitochondria, we should expect synony- mous codon usage to be biased toward A-ending codons
in mitochondria to facilitate transcription, according to THCU. This expectation is born out with empirical evidence (Table 1).
Prediction
2
The proportion of Aending codons in each synonymous codonfamily
should be smaller in nu- clear protein genes than in mitochondrial proteingenes: Whereas ATP concentration should be much higher than the concentration of non-ATP nucleotides in mitochondria for reasons stated in the previous para- graph, the difference in concentration between ATP and non-ATP nucleotides should be relatively small in the nucleus because ATP concentration is lower in nucleus than in mitochondria. ATP concentrations in rat liver cytosol and mitochondria were 6.2 .f 0.63 and
7.5
20.73 pmol/(ml water), respectively (BRIDGER and HEN-
DERSON 1983, p. 5). The actual difference is expected to be greater because mitochondrial preparation was not absolutely free of cytosol contamination and vice versa. It is believed that little difference exists in ATP concen- tration between nucleus and cytoplasm (BRIDGER and HENDERSON 1983, p. 5), ie., the difference in ATP con- centration between mitochondria and cytosol is also the difference between mitochondria and nucleus.
1312 X. Xia
TABLE 2
Proportion of A-ending codons (NJN) in each synonymous
codon family on the nuclear and mitochondrial genomes in the cow, Bos taurus
NdN
Amino acids NUC mtDNA E. coli
Ala 0.1733 0.4153 0.22
Gln 0.2136 0.9080 0.31
Glu 0.3383 0.821 1 0.70
Leu 0.0899 0.6616 0.14
Pro 0.2235 0.4404 0.20
Ser 0.1906 0.4500 0.12
Thr 0.2211 0.4968 0.12
Val 0.0766 0.4579 0.17 A% 0.1593 0.6667 0.06
GlY 0.2130 0.4429 0.09
LYS 0.3469 0.891 1 0.76
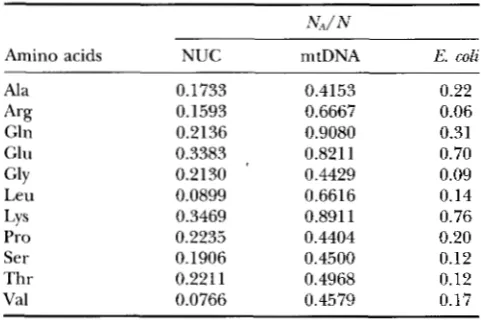
The last column is E. coli DNA. NA, number of A-ending codons, N, total number of codons. Data from mitochondrial DNA were based on data in Table 1. Data for Arginine is limited to CGN codons (i.e., excluding AGA and AGG, which are stop codons in mtDNA). Note the relative deficiency of A-ending codons in the nuclear genome relative to the mito- chondrial genome in the cow (P < 0.0001 based on paired t-test). The pattern is similar for rat, rabbit, cow, sheep, hu- man, and macaque. Data for cow nuclear DNA and E. coli DNA were derived from 261 and 681 genes, respectively, found in GenBank 63. NUC, nuclear; mtDNA, mitochondrial.
dons to be less frequent in the nuclear genome than in the mitochondrial genome, which is also true (Table
2). The data are derived from a compilation by
J .
M. CHERRY ([email protected]) with the GCG program CodonFrequency. The original compila- tion, together with a description of the compilation procedure, is available at the FTP site ftp.bio.india- na.edu. Thus, the difference in synonymous codon us- age between the nuclear genome and the mitochon- drial genome appears to be explained, at least partially, by the difference in relative ATP concentration between the nuclear medium and the mitochondrial medium.An alternative explanation for the difference be- tween mtDNA and nuclear DNA in Table 2 is that the prokaryotic ancestor of mtDNA had a high frequency of A-ending codons and that this high frequency of A- ending codons has been maintained through evolution- ary inertia rather than through any optimization pro- cess suggested by THCU. If this is true, then we would expect prokaryotic genomes, which presumably share the same ancestor with the mitochondrial genome, also to exhibit a high frequency of A-ending codons. This expectation is clearly not fulfilled (Table 2). The fre- quency of A-ending codons in Escherichia coli genome is significantly smaller ( P
<
0.0001, Table 2) than that of the mitochondrial genome in the cow. The pattern in Table 2 holds true if the cow in Table 2 is replacedby other eukaryotic organisms such as rat, rabbit, sheep, human, Macaca, Saccharomyces, or Drosophila. Note
that the mtDNA and nuclear genome have diverged a very long time. So an explanation of evolutionary iner- tia is perhaps unnecessary in the first place.
Prediction 3: The proportion of A-ending codons should be greater in organisms with a high weight-spe- cific metabolic rate (SMR) than in organisms with a low SMR Different animal species differ greatly in SMR (measured as O2 consumption in unit of milliliters
-
hour" * grams"). In mammals, SMR is inversely corre-lated with body size, with the mouse having much higher SMR than the cow (ALTMAN and DITTMER 1972: 1613-1616). Differences in SMR among animals of dif- ferent body sizes are correlated with the number of mitochondria per unit volume of tissue, with mammals of high SMR having more mitochondria per unit vol- ume of tissue than mammals of small SMR (SMITH 1956; MATHIEU et al. 1981; EKERT and RANDALL. 1983, pp. 698-699). According to WEIBEL'S (1984) authoritative review, the cell's potential for ATP production is pro- portional to the volume density of its mitochondria. This explains the rapid decrease of maximum sustain- able metabolic rate with increasing body weight (de- creasing volume density of mitochondria) in mamma- lian species (HOCHACHKA 1991). In light of all these related lines of evidence, I think it reasonable to assume that nucleotide production is more ATP-biased in small mammalian species with a high SMR than in large mam- malian species with a low SMR. In other words, the availability of cellular ATP (relative to the other three nucleotides, C , G, and U) is greater in small mammalian species with a high SMR than in large mammalian spe- cies with a low SMR.
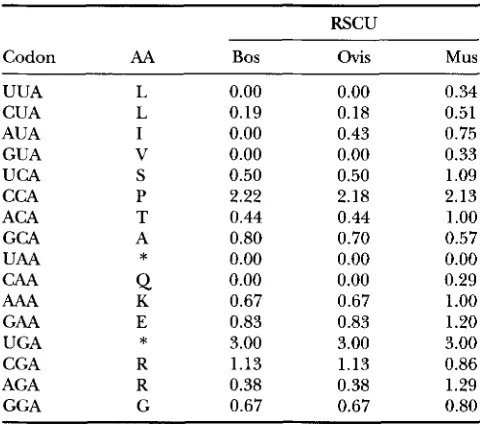
If the inference above is correct, then we should ex- pect a greater proportion of A-ending codons in small mammals, such as the mouse with SMR equal to 1.59, than in large mammals, such as the cow and sheep with SMR equal to 0.127 and 0.206, respectively (ALTMAN and DITTMER 1972: 1613-1616). This expectation is confirmed with erythropoietin gene from the mouse, cow and sheep (Table 3). A-ending codons are used significantly more frequently in the mouse gene than in the cow and sheep gene. Complete DNA sequence is also available for the erythropoietin receptor gene from the mouse and human (accession numbers 504843 and M60459), with the mouse gene having a signifi- cantly greater RSCU values for A-ending codons than the human gene. SMR for the human is 0.228, which is much smaller than that for the mouse.
Transcription
TABLE 3
Relative synonymous codon usage (RSCU) in the cow, sheep and mouse erythropoietin gene (complete sequence)
RSCU
Codon AA Bos ovis Mus
UUA L 0.00 0.00 0.34
CUA L 0.19 0.18 0.51
AUA I 0.00 0.43 0.75
GUA V 0.00 0.00 0.33
UCA S 0.50 0.50 1.09
CCA P 2.22 2.18 2.13
ACA T 0.44 0.44 1
.oo
GCA A 0.80 0.70 0.57
UAA
*
0.00 0.00 0.00AAA K 0.67 0.67 1
.oo
GAA E 0.83 0.83 1.20
UGA
*
3.00 3.00 3.00CGA R 1.13 1.13 0.86
AGA R 0.38 0.38 1.29
GGA G 0.67 0.67 0.80
The GenBank accession numbers for the cow, sheep and mouse genes are L41354, 224681, and M12482, respectively (The mouse erythropoietin gene M12930 exhibits identical codon usage as M12482). RSCU values based on 193 codons for the cow gene, 195 codons for the sheep gene and 193 codons for the mouse gene. RSCU for A-coding codons in the mouse gene is significantly greater than that in the cow gene ( P = 0.0056, paired t-test) and that in the sheep gene
( P = 0.0041). There is no difference between the cow gene and the sheep gene ( P = 0.5451, paired t-test). Bos, cow; Ovis, sheep; Mus, mouse.
CAA
Q
0.00 0.00 0.29marized in Table 4, with globin genes from six different mammalian species.
A comparative analysis involves constructing a phylo-
and Codon Usage 1313
- 0.111 Capra hircus:0.233,17.5
- 2.46
I
"00.344,19.96 - Homo sapiens:0.228,12 - 0.21 2
0.329,16.5
I 1 - 2.3
I
I
&
Macaca mulatta:0.43,21w f 0 . 7 6 8 2 1 . 2 0.375
1 5 . 5 Mus musculus:1.59,33
.215,27.5
Rattus rattus:0.84,22
- 5.5
FIGURE 1.-Partition of the differences in weight-specific metabolic rate (SMR) and the average number of A-ending codons
(EA)
along branches of the phylogenetic tree of the six mammalian species. The two numbers following each species name are observed SMR and NAvalues, respectively. The two numbers at each numbered internal node are inferred SMR and NAvalues. The two numbers above and below each branch represent changes in SMR andEA
from the ancestral taxon to the descendant taxon.genetic tree of the focal taxa, partitioning the differ- ences in the focal variables among the taxa (in our case
SMR and
mA
in Table 4) along the branches to obtain independent contrasts, and testing the covariation of the two focal variables during evolutionary history (FELSENSTEIN 1985, 1988;HARVEY
and PAGEL 1991). The phylogenetic tree for the six species (Figure 1) was taken from NOVACEK et al. (1988).The differences in the two focal variables were parti- tioned along the branches by using a computer pro- gram C.A.I.C, with the option of setting all branches
TABLE 4
Locus names of tu-globin and @-globin genes of six mammalian species
Locus name
~~
Species a-globin P-globin
NA
SMRCapra hircus
Homo sapiens
GOTHBAI GOTHBAII HUMHBA4 (a2)
HUMHBA4 (al)
Macaca rnulatta MACHBA
Otyctolagus cuniculus RABHBAP M u s musculus MUSHBA
Rattus noruet+xs RATHBAh4 GOTHBBEI 17.5 0.233
GOTHBBEII
HUMBETGLOA 12 0.228
HUMBETGLOB HUMBETGLOC
MACHBGAl 21 0.43
MACHBGA2
RABBGLOB 17 0.47
MUSHBBHO 33 1.59
MUSHBBHl
RATHBBM 22 0.84
1314 X. Xia
r
=
0 . 8 9 8 7p
=
0 . 0 0 0 4t
+
+
+
+
I I I I I I
-0.30
-0.15
0.00
0.15
0.30
0.45
Changes in SMR
FIC;URE 2,”Heuristic illustration of the effect of changes in weight-specific metabolic rate (SMR) on
R,,.
The 10 points are taken from the 10 branches in Figure 1.to the same value (PURWS and RAMBAUT 1994). The independent contrasts show that an increase in SMR is associated with an increase in
R4
(Figures 1 and2 ) ,
which is consistent with the third prediction.
There are two problems in the above test. First, the phylogenetic tree in Figure 1 is not universally agreed upon. Second, the test is based on globin genes only. One cannot make generalizations based on one or few genes. I have addressed these problems in several ways. First, I have compared codon usage between the mouse (SMR = 1.59) and the rat (SMR = 0.84) based on
877
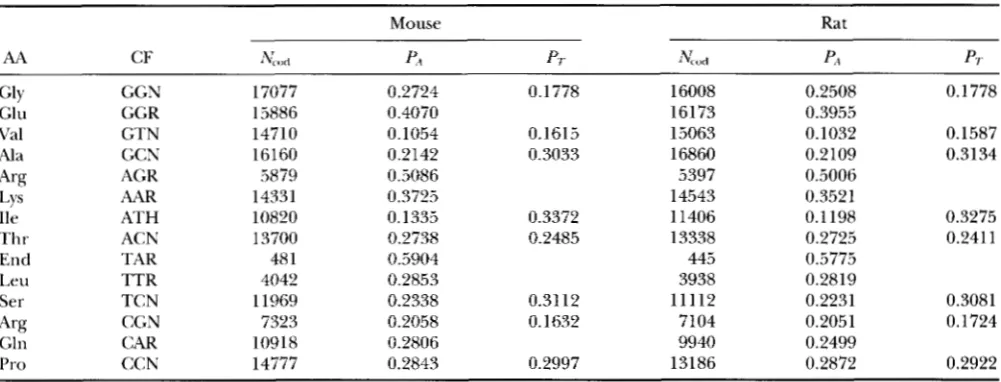
and 833 genes, respectively, from the mouse and the rat (Table 5). The mouse genes used A-ending codons significantly more frequently than the rat genes ( P =
0.0006, Table 5). These data strongly supported the third prediction.
I have also compared codon usage between the rabbit (SMR = 0.47) and the cow (SMR = 0.13) based on 133 and 261 genes, respectively, from the rabbit and the cow. There are 36417 and 58199 codons for the rabbit and the cow, respectively, of which 7614 and 11762 codons, respectively, are A-ending codons. A chi-square test showed that rabbit genes contained significantly more A-ending codons than the cow genes
(x’
= 6.699, d.f. = 1, P = 0.0096), which is again consistent withthe third prediction. A similar comparison between the human (1952 genes) and the macaque (19 genes) did not show any significant difference, which is perhaps attributable to the small number of macaque genes and to the fact that the difference in SMR between thc two species are not as great as that between the rat and the mouse or between the rabbit and the cow. In short, when two species differ much in SMR, they also differ in the use of A-ending codons in the direction predicted by THCU; when two species differ little in SMR, they also have similar codon usage.
Prediction 4: The A-content of introns should be greater in organisms with a high weight-specific meta- bolic rate (SMR) than in organisms with a low SMR This prediction is interesting in two aspects. First, its confirmation would strengthen THCU. Second, i t helps to distinguish between the transcription hypothe- sis and translational hypothesis concerning codon us- age. The transcription hypothesis predicts that both i n - trons and coding sequences should show the predicted “nucleotide usage bias”, whereas the translation hy- pothesis predicts that only coding sequences should exhibit nucleotide usage bias (or codon usage bias).
The test of prediction 4 can be illustrated with the cytoplasmic P-actin gene, which has been sequenced for the human and the rat, with GenBank LOCUS names HUMACCYBB and RATACCXB, respectively. The gene from both the human and the rat contain five introns, which are spliced out, joined, and the percentage of A nucleotide calculated. Because the rat has a much high metabolic rate (0.84) than the human (0.23)) predic- tion 4 would be supported if the introns of the rat gene have a higher percentage of A nucleotide than those of the human gene. Such a test should be applied to many genes to increase the generality ofthe test results. I retrieved DNA sequences from GenBank by using proteins listed in Table 1 of chapter 4 in L I and GKALIK
(1991) as keywords, which resulted in a total of 756 DNA sequences for various mammalian species. Most protein gene “loci” in GenBank do not contain se- quence information on introns. Some genes have in- tron sequences for only one species, which are useless for our comparative purpose (which requires intron information from at least two species differing in meta- bolic rate, SMR). Some genes contain only partial in- tron sequences, which are discarded. Also discarded arc those intron sequences with long stretches of unre- solved sites, ie., marked by “nnnnn .
.
.”.
For the few genes that do contain complete intron sequences from multiple species, only five (skeletal a-actin, cytoplasmic @-actin, growth hormone, a- and P-globin genes) can have their exons and introns aligned properly as shown in Figure 3 .Transcription and Codon Usage 1315
TABLE 5
Comparison of codon usage between the mouse and the rat based on 877 mouse genes and 833 rat genes
Mouse Rat
AA CF &,I P4 P/. N o d P4 PT
Gly GGN 17077 0.2724 0.1778 16008 0.2508 0.1778
Glu GGR 15886 0.4070 16173 0.3955
Val GTN 14710 0.1054 0.1615 15063 0.1032 0.1587
Ala GCN 16160 0.2142 0.3033 16860 0.2109 0.3134
'4% AGR 5879 0.5086 5397 0.5006
Lys AAR 14331 0.3725 14543 0.3521
lle ATH 10820 0.1335 0.3372 11406 0.1 198 0.3275
Thr ACN 13700 0.2738 0.2485 13338 0.2725 0.241 1
End TAR 48 1 0.5904 445 0.5775
Leu TTR 4042 0.2853 3938 0.2819 Ser TCN 11969 0.2338 0.31 12 11112 0.2231 0.3081
Gln CAR 10918 0.2806 9940 0.2499
Pro CCN 14777 0.2843 0.2997 13186 0.2872 0.2922
AA, amino acid; CF, codon family; Nc,,,I, total number of codons; PA and Pr, proportion of A- and T-ending codons. PA for nlouse is significantly larger than P-\ for rat (paired t-test, P = 0.0006). Data are based on a compilation by J. M. CHERRY (cherry8frodo.mgh.hanm-d.edu) with the GCG program CodonFrequency. The original compilation, together with a description of the compilation procedure, is available at the FTP site ftp.bio.indiana.edu.
Arg CGN 7323 0.2058 0.1632 7104 0.2051 0.1724
/"
intronSS
U 1 6368BTU02285 HUMSAACT MUSACASA RATACSKA
1
. . . . H U M A C C Y B B . . .
2
. . .
RATIQCCYB
. . .SHPGHOV PIGGH GOTGHRA
MMU02293 BOVGHGH RATG H 1
HUMGHN
3
RATGROW2
. . . . . .
MACHBA
. . . A
MUSHBA
HUMBETGLOB HUMBETGLOC MUSHBBHO MUSHBBH1 TGLHBB
4 . .
HUMB
ETGLOA . . .0 1 2 3 4
Thousands (bp)
FIGL'RE 3,"Aligned exons and introns for five protein genes from various mammalian species. The numbers desig- nate genes: 1, skeletal a-actin gene; 2, cytoplasmic ,&actin gene; 3 , growth hormone gene; 4, a-globin gene; 5, &globin gene. GenBank LOCUS names are on the y axis. See Table 6 for the common name of the species.
we do find a consistent pattern for each of the five genes that the A-content of introns is greater in organ- isms with a high weight-specific metabolic rate (SMR)
than in organisms with a low SMR (Table 6 ) . For exam- ple, rodents have higher P,4 than the human and the ungulates.
AN ALTERNATIVE EXPLANATION
One alternative hypothesis for the patterns shown in Tables 1-6 and Figures 1 and
2
is that of mutation bias. For example, a greater mutational pressure favoring A against G in the mitochondrial genomes than in the nuclear genomes would result in a greater proportion of A-ending codons in the mitochondrial genes than in the nuclear genes. MARTIN (1995) has argued that organisms of high metabolic rate should experience higher mutation rate favoring A than organisms of low metabolic rate.1316 X. Xia
TABLE 6
Data from five protein genes for testing prediction 4
Species Locus SMR P A PC PC P7.
N",,
Skeletal muscle a-actin gene
Pig SSUl6368
cow BTU02285
Human HUMSAACT
Rat RATACSKA
Mouse MUSACASA
Human HUMACCYBB
Rat RATACCYB
Cytoplasmic @-actin gene
Growth hormone gene Pig cow Sheep Goat Human Macaque Rat Rat Macaca Mouse Human Human Human Mouse Mouse Echidna a-Globin gene
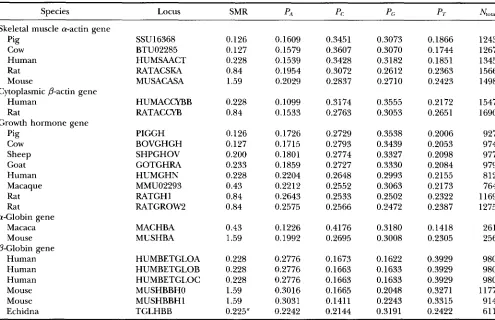
@Globin gene v PIGGH BOVGHGH SHPGHOV GOTGHRA HUMGHN MMU02293 RATGHl RATGROW2 MACHBA MUSHBA HUMBETGLOA HUMBETGLOB HUMBETGLOC MUSHBBHO MUSHBBHl TGLHBB 0.126 0.127 0.228 0.84 1.59 0.228 0.84 0.126 0.127 0.200 0.233 0.228 0.43 0.84 0.84 0.43 1.59 0.228 0.228 0.228 1.59 1.59 0.225" 0.1609 0.1579 0.1539 0.1954 0.2029 0.1099 0.1533 0.1726 0.1715 0.1801 0.1859 0.2204 0.2212 0.2643 0.2575 0.1226 0.1992 0.2776 0.2776 0.2776 0.3016 0.3031 0.2242 0.3451 0.3607 0.3428 0.3072 0.2837 0.3174 0.2763 0.2729 0.2793 0.2774 0.2727 0.2648 0.2552 0.2533 0.2566 0.4176 0.2695 0.1673 0.1663 0.1663 0.1665 0.1411 0.2144 0.3073 0.3070 0.3182 0.2612 0.2710 0.3555 0.3053 0.3538 0.3439 0.3327 0.3330 0.2993 0.3063 0.2502 0.2472 0.3180 0.3008 0.1622 0.1633 0.1633 0.2048 0.2243 0.3191 0.1866 0.1744 0.1851 0.2363 0.2423 0.2172 0.2651 0.2006 0.2053 0.2098 0.2084 0.2155 0.2173 0.2322 0.2387 0.1418 0.2305 0.3929 0.3929 0.3929 0.3271 0.3315 0.2422 1243 1267 1345 1566 1498 1547 1690 927 974 977 979 812 764 1169 1275 261 256 980 980 980 1177 914 611
LOCUS designates LOCUS name in GenBank. PA, PC, PC, and PT are the proportion of nucleotides A, C, G, and T, respectively.
N,,,,, is the total number of codons. Phylogenetically similar species are grouped next to each other. Note that species with higher SMR values tend to have higher A-content (PA). All SMR (weight-specific metabolic rate) values are taken from ALTMAN and DITTMER (1972: 1613-1616).
The reported value is a range (0.20-0.25).
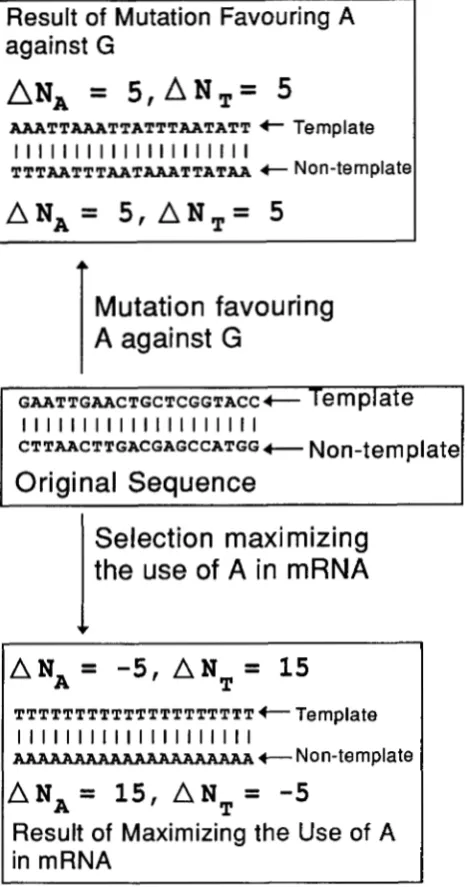
strand, the increment in the number of A nucleotides (five in our fictitious case) is matched by the increment in the number of T nucleotides (also five in our ficti- tious case). In other words,
AN,
= A N , on both tem- plate and nontemplate strands (Figure 4), so that A- and T-ending codons will be used equally frequently, and both used more frequently than G and C-ending codons.In contrast to the mutation hypothesis, THCU predicts that, with ATP more readily available than other nucleo- tides, the protein gene should evolve toward maximizing the use of A in mRNA (ie., maximizing the number of A on the nontemplate strand of the coding sequence, Figure 4). This will result in an increase in the number of A, and a decrease in the number of T in the nontemplate strand of the gene (Figure 4). In short, although both THCU and the mutation hypothesis would predict that A-ending codons should be much more frequent than G ending codons, the two hypotheses differ in that THCU predicts A-rich and T-poor on the nontemplate strand, whereas the mutation hypothesis (e.&, with mutation fa- voring A against G) predicts that both strands should be
AT-rich and GCpoor, with As and Ts distributed equally on the two strands (Figure 4).
The mutation hypothesis seems to explain satisfacto- rily the pattern of codon usage in Drosophila mitochon- drial DNA. The number of codons ending with A, C, G, and T in Drosophila yakuba is 1052,107,45, and 1092, respectively, for protein genes on the H strand, and is 403, 6, 31, and 428, respectively, for protein genes on the L strand. Thus, Drosophila mtDNA is AT-rich, with A- and T-ending codons used roughly equally, and both used much more frequently than C- and Gending co- dons. These fulfill t h e prediction based on mutation hypothesis (Figure 4, top). In neither strand do we ob- serve A-richness and T-poorness expected from THCU
(Figure 4).
Transcription and Codon Usage 1317
Result
of
Mutation Favouring A
against G
AN,
=
5 , A N T =
5
A A A T T A A A T T A T T T A A T A T T 4- Template
I I I I I I I I I I I I I I I I I I I I
TTTAATTTAATAAATTATAA t Non-template
A N A =
5,
A N T =
5
Mutation favouring
A
against G
I I I I I I I I I I I I I I I I I I I I
CTTAACTTGACGAGCCATGG-
Non-template
Original Sequence
I
Selection maximizing
T T T T T T T T T T T T T T T T T T T T +- Ternplate
I I I I I I I I I I I I I I I I I I I I
AAAAAAAAAAAAAAAAAAAA
+-
Non-templateA N , =
1 5 ,
AN
=
-5
Result
of
Maximizing the
Use
of
A
in mRNA
T
FIGURE 4.-Contrasting predictions from the mutation hy- pothesis (with mutation favoring A against G) and THCU (transcription hypothesis of codon usage). THCU predicts A- richness and T-poorness in the nontemplate strand (bottom), and the opposite in the template strand. A designates incre- ment. Because mutation favoring A against G is expected to
occurred equally frequently on both DNA strands, the muta- tion hypothesis expects both DNA strands to accumulate equal number of As and, consequently, equal number of Ts,
so that both strands will be AT-rich and GC-poor.
quence divergence, suggesting that the nucleotide se- quence is mainly under the control of mutation bias (GODDARD et al. 1982). The fact that the region is made of almost entirely of AT pairs implies that the mutation spectrum in Drosophila is strongly AT-biased, and that the preponderance of A- and T-ending codons in Dro- sophila mtDNA can be explained as a consequence of the mutation bias.
Another DNA region that appears to be strongly af-
fected by mutation bias is the D-loop of mammalian mtDNA. GODDARD et al. (1982) has suggested that the D-loop is homologous to the highly variable AT-rich region in Drosophila mtDNA mentioned above. Like the AT-rich region in Drosophila, the D-loop also flanks the replication origin, is also highly variable in nucleo- tide sequences (AVISE 1994), and is not transcribed ex- cept for perhaps a few bases. Thus, the nucleotide com- position of the D-loop should reflect the mutation spectrum in the mammalian mtDNA. The number of
A, C, G, and T in the mouse D-loop is 258, 104, 218, and 299, respectively. This is consistent with what we would expect if the D-loop is under mutation bias fa- voring A or T (Figure 4, top).
The mutation hypothesis, however, fails in explaining the pattern of codon usage in mammalian mtDNA. The data in Table 1 shows that A-ending codons are always much more frequently used than T (or U)-ending co- dons in bovine mtDNA, in contrast to what we see in Drosophila mtDNA where A- and T-ending codons are used equally frequently and also in contrast to the D- loop region where T is more frequent than A.
The data from mouse mtDNA further highlight the inadequacy of the mutation hypothesis. The number of codons ending with A, C, G, and T in the mouse mtDNA is
1677,
1000, 117, and 825, respectively, with A-ending codons far outnumbering not only Gending codons but also T-ending codons. This pattern is the same as what we see in Table 1 for the cow and is expected from THCU, but not from the mutation hypothesis. (Note that there are more NNY codons than NNR co- dons in mammalian mtDNA, with the difference >300.So the observed excess of A-ending codons and defi- ciency of T-ending codons in mammalian mtDNA is not a consequence of protein genes made of mostly NNR codons).
Although the pattern of codon usage in mtDNA is more satisfactorily explained by THCU than by the mu- tation hypothesis, one can still argue that the difference in codon usage between mtDNA and nuclear DNA (Ta- ble 2) is attributable to mutations in mtDNA more bi- ased in favor of A than mutations in nuclear genome, which could result in more A-ending codons in mtDNA than in nuclear genome. A new finding summarized below appears to favor THCU.
ZISCHLER et al. (1995) discovered a segment (540 bp) of the human mitochondrial D-loop to have been in- serted into the nuclear genome, and that the inserted sequence has presumably existed as nonfunctional DNA. The nucleotide frequencies of the insert for A, C, G, and T are 30.7%, 32.6%, 13.9%, and 22.8%, re- spectively. The equivalent values for the homologous
1318 X. Xia
a reduction of the proportion of A in the insert, which is not true.
ZISCHLER et al. (1995) also sequenced the nuclear DNA sequences flanking the insert. The two flanking regions add up to a total of 385 bp, with the nucleotide frequencies being 41.3%, 18.2%, 13.576, and 27.0%, respectively, for A, C, G, and T. Thus, the A-content of the nonfunctional DNA of nuclear origin appears to be in excess rather than in deficiency in comparison with the equivalent values in mitochondrial D-loop. This sug- gests that mutations in mtDNA is not more biased in favor of A than those in the nuclear genome. In short, the larger proportion of A-ending codons in mtDNA relative to nuclear DNA is not due to mutation bias favoring A in mtDNA.
It is much more difficult to distinguish THCU from the mutation hypothesis regarding the differences in codon usage among mammalian species of different metabolic rates (Tables 3-5). For example, although the proportion of A-ending codons (PA in Table 5) is greater for mouse genes than for rat genes, the propor- tion of T-ending codons (PT) also seems to be greater for the mouse genes than for the rat genes. This concur- rent increase in both PA and P?. in animals of higher metabolic rate ( i e . , the mouse) is compatible with the mutation hypothesis (MARTIN 1995) invoking mutation bias favoring A or T in animals of higher metabolic rate
(SRM). However, for the nine codon families with both A- and T-ending codons in Table 5, PA for the mouse genes is significantly larger than PA for the rat genes ( P
= 0.017, paired t-test, one-tailed), whereas the differ- ence in Py. between the mouse genes and the rat genes is not significant ( P = 0.507). This suggests that THCU is a plausible alternative to the mutation hypothesis.
The data of introns (Table 6) are almost entirely compatible with the mutation hypothesis in that a con- current increase in both A- and T-content is observed in genes from mammalian species with a high metabolic rate relative to those from mammalian species with a low metabolic rate. The only exception involves com- parisons between human and mouse for the P-globin gene. The mouse introns for the P-globin gene show higher A content and lower T content than human introns. This is expected under THCU, but not under the mutation hypothesis. However, such a single case should not be taken as a rejection of the mutation hy- pothesis, which to me remains a plausible hypothesis in many other cases.
I conclude that THCU is a sufficient, and perhaps unique, explanation for the biased codon usage favoring A-ending codons in mammalian mtDNA (Table 1) and
the differences in codon usage between the mitochon- drial genomes and the nuclear genomes (Table 2). My
results further suggest that THCU is a plausible hypothe- sis in explaining the differences in codon usage in nu- clear genomes among mammalian species of different metabolic rates (Table 3-6 and Figures 1 and 2).
DISCUSSION
The prevailing hypothesis on the evolution of codon usage suggests that the pattern of synonymous codon bias is a consequence of adaptation of codon usage to relative availability of tRNAs in the cellular matrix (reviewed by IKEMURA 1992). A more relaxed hypothe- sis invokes the mutual adaptation of codon usage and tRNA availability ( BULMER 1988). According to this sec- ond hypothesis, there are three elements in the system determining the evolution of codon usage: mutation bias, tRNA availability, and random genetic drift
(BULMER 1991). Random genetic drift could lead to biased codon usage and unequal availability of different tRNAs in the absence of natura1 seIection. If a synony- mous codon that drifts to high frequency happens to be the one recognized by the most abundant tRNA or if a tRNA that drifts to high abundance happens to be the one that recognizes the most frequently used co- don, then these genetic drifts would result in increased translational efficiency and accuracy, and would there- fore be favored by natural selection. This would ulti- mately result in the most frequently used synonymous codon being recognized by the most abundant tRNA, which has been documented by Gow and GAUTIER (1982) and IKEMURA (1981,1982,1985,1991). In short, the second hypothesis suggests that mutation bias, tRNA availability and random genetic drift form a self- contained system such that the interaction among the three elements is sufficient to explain the pattern of codon usage.
The results in this paper indicate that this second hypothesis is too restrictive because some features of codon usage, such as the usage of A-ending codons, depend on factors that are not contained in the system of the three elements specified in that hypothesis. Spe- cifically, our optimality model of the transcriptional process predicts that the pattern of synonymous codon usage should depend on the relative concentration of nucleotides in the cellular medium. This is consistent with the findings that the mitochondrial genome has a greater proportion of A-ending codons than the nu- clear genome and that the nuclear genome in organ- isms with a high metabolic rate has a greater proportion of A-ending codons than the nuclear genome in organ- isms with a low metabolic rate. Thus, a more complete theory of the evolution of codon usage should consider the relative availability of ribonucleotides in the cellular matrix.
Transcription and Codon Usage 1319
that CTP and UTP can come free without spending ATP to synthesize them. It is in fact energetically more efficient to use ATP directly to fill a nucleotide site than to use ATP to synthesize an alternative NTP and then use that alternative NTP to fill in the nucleotide site. In other word, using ATP directly in transcription not only speeds up transcription, it also consmes available energy sources.
I should admit here that, although predictions from the model appear consistent with empirical data, the construction of the model itself is not vigorous because of simplifjmg assumptions. Protein synthesis is a multistep process including initiation of transcription, elongation of mRNA chain, initiation of translation, and elongation of the peptide chain. By assuming that the rate of transcription rate is limiting, we have re- duced the multistep process to a one-step process, which obviously is a distortion of the reality. This criti- cism can also be levelled against those studies focusing on the translation component of the process. However, the recognition that even a very simple model could account for a substantial amount of variation in codon (nucleotide) usage would help to reduce the mystique surrounding the operation of natural selection on the biochemical systems in the living cell.
I thank M. S. HAFNER, A. ZHARKIKH, T. SPRADLING, J. DEMASTES, and D. W. FOLTZ for their stimulating discussion and constructive comments on various versions of the manuscript. The two anonymous reviewers and JODY HEY suggested the analysis on introns and pointed to additional sources of data relevant to the hypothesis presented in this paper. This project is supported by National Science Foundation grant DEB95-27583 to M. S. HAFNER and X.X. and by the University
of Hong Kong.
LITERATURE CITED
AKASHI, H., 1994 Synonymous codon usage in Drosophila melano- gaster: natural selection and translational accuracy. Genetics 1 3 6
ALTMAN, P. L., and D. S. DITTMER, 1972 Biology Data Book, Vol. 111. Ed. 2. Federation of American Societies for Experimental Biol-
ogy, Bethesda, MD.
AVISE, J. C., 1994 Molecular Markers, Natural History and Evolution. Chapman and Hall, New York.
BENNETZEN, J. L., and B. D. HALL, 1982 Codon selection in yeast. J. Biol. Chem. 257: 3026-3031.
BRIDGER, W. A,, and J. F. HENDERSON, 1983 Cell ATP, Wiley, New York.
BULMER, M., 1988 Coevolution of codon usage and transfer RNA abundance. Nature 325: 728-730.
BUI.MER, M., 1991 The selection-mutation-drift theory of synony- mous codon usage. Genetics 129: 897-907.
EKERT, R., and D. RANDAIJ., 1983 AnimalPhysiology. Ed. 2. Freeman, New York.
FAURON, C. M. R., and D. R. WOLSTENHOLME, 1980a Extensive diver- sity among Drosophila species with respect to nucleotide se- quences within the adenine
+
thymine-rich region of mitochon- drial DNA molecule. Nucleic Acids Res. 8: 2439-2452. FAURON, C. M.-R., and D. R. WOLSTENHOLME, 1980b Intraspecificdiversity of nucleotide sequences within the adenine+thymine- rich region of mitochondrial DNA molecules of Drosophila mauri-
Acids Res. 8: 5391-5410.
liana, Drosophila melanogaster and Drosophila simulans. Nucleic FELSENSTEIN, J., 1985 Phylogenies and the comparative method.
Am. Nat. 125: 1-15. 927-935.
FELSENSTEIN, J., 1988 Phylogenies and quantitative methods. Annu. Rev. Ecol. Syst. 19: 445-471.
GODDARD, J. M., and D. R. WOLSTENHOLME, 1980 Origin and direc- tion of replication in mitochondrial DNA molecules from the genus Drosophila. Nucleic Acids Res. 8: 741-757.
GODDARD, J. M, FAURON, C. M.-R. FAURON and D. R. WOLSTENHOLME,
1982 Nucleotide sequences within the A+T-rich region and the
large-rRNA gene of mitochondrial DNA molecules of Drosophila yakuba, pp. 99-103 in Mitochondrial Genes, edited by P. SLONIMSKI, P. BORST and G. ATTARDI. Cold Spring Harbor Laboratory Press, Cold Spring Harbor, NY.
Gow, M., and C. GAUTIER, 1982 Codon usage in bacteria: correla- tion with gene expressivity. Nucleic Acids Res. 10: 7055-7064. GRANTHAM, R., C. GAUTIER, M. COW, R. MERCER and A. PAVE, 1980
Codon catalog usage and the genome hypothesis. Nucleic Acids Res. 8: 49-79.
GRANTHAM, R., C. GAUTIER, M. Gorru, M. JACOBZONE and R. MERCIER,
1981 Codon catalog usage is a genome strategy modulated for
gene expressivity. Nucleic Acids Res. 9: 43-79.
HARTL, D. L., E. N. MORIYAMA and S. A. SAWYER, 1994 Selection intensity for codon bias. Genetics 1138: 227-234.
HARVEY, P. H., and M. D. PAGEI., 1991 The Comparative Method in
Evolutionary Biology. Oxford University Press, Oxford.
HOCHACHKA, P., 1991 Design of energy metabolism, pp. 353-436 in Environmental and Metabolic Animal Physiology, edited by C. L. PROSSER. Wiley-Liss, New York.
IKEMURA, T., 1981 Correlation between the abundance ofEschm.chia coli transfer RNAs and the occurrence of the respective codons in its protein genes: a proposal for a synonymous codon choice that is optimal for the E. coli translational system. J. Mol. Biol.
151: 389-409.
IKEMURA, T., 1982 Correlation between the abundance of yeast transfer RNhand the occurrence of the respective codons in protein genes. J. Mol. Biol. 158: 573-597.
IKEMLIRA, T., 1985 Codon usage and tRNA content in unicellular and multicellular organisms. Mol. Biol. Evol. 2: 13-34. IKEMURA, T., 1992 Correlation between codon usage and tRNA con-
tent in microorganisms, pp. 87- 1 1 1 in Transfer RNA in Protein
Synthesis, edited by D. L. HATFIELD, B. J. LEE, and R. PIRTLE. CRC Press, Boca Raton, Fla.
KIMuRA, M., 1983 The Neutral Theory of Mokrular Evolution. Cam- bridge University Press, Cambridge.
KURLAND, C. G., 1987a Strategies for efficiency and accuracy in gene expression. I. The major codon preference: a growth optimiza- tion strategy. Trends Biochem. Sci. 12: 126-128.
KURLAND, C. G., 1987b Strategies for efficiency and accuracy in gene expression. 2. Growth optimized ribosomes. Trends Biochem. Sci. 12: 169-171.
LI, W.-H., and D. GRAUR, 1991 Fundamentals of Molecular Evolution.
Sinauer Associates, Sunderland, MA.
MARTIN, A. P., 1995 Metabolic rate and directional nucleotide sub- stitution in animal mitochondrial DNA. Mol. Biol. Evol. 12:
MATHIEL!,
o.,
R. KRAUER, H. HOPPELER, P. GEHR, S. L. LINDSTEDT etal., 1981 Design of the mammalian respiratoly system. VI. Scal- ing mitochondrial volume in skeletal muscle to body mass. Re- spir. Physiol. 4 4 113-128.
NOVACEK, M. J., A. R. WYSS and M. MCKENNA, 1988 The major groups of eutherian mammals, pp. 31-71 in The Phylogeny and Classification of the Tetrapods, Vol. 2, edited by M. J. BENTON. Clarendon Press, Oxford.
OLSON, M. S., 1986 Bioenergetics and oxidative metabolism. pp
212-260 in Text Book o/Biochemistry with Clinical Correlations, Ed.
2, edited by T. M. DEVLIN. John Wiley & Sons, New York. PURVIS, A., and A. WBAUT, 1994 Comparative Analysis by Independent
Contrasts (CAIC, version 2 ) . Oxford University.
ROBINSON, M., R. LII.I.EY, S. LITTLE, J. S. EMTAGE, G. YAMAMOTO et
aL, 1984 Codon usage can effect efficiency of translation of
genes in Escherichia coli. Nucleic Acids Res. 12: 6663-6671.
SHARP, P. M., and K. M. DEVINE, 1989 Codon usage and gene expres- sion level in Dictyostelium discoideum: highly expressed genes d o “prefer” optimal codons. Nucleic Acids Res. 17: 5029-5038.
SHARP, P. M., and W. H. LI, 1986 An evolutionary perspective on
synonymous codon usage in unicellular organisms. J. Mol. Evol.
SHARP, P. M., and W. H. LI, 1987 The codon adaptation index - a 1124-1131.
1320 X.
measure of directional synonymous codon usage bias, and its potential applications. Nucleic Acids Res. 15: 1281-1295.
SITARP, P. M, M. F. TLIOHY and K. R. MOSURSKI, 1986 Codon usage
in yeast: cluster analysis clearly differentiates highly and lowly
expressed genes. Nucleic Acids Res. 14: 5125-5143.
SHARP, P. M., E. COWE, D. G. HIGGINS, D. C. SHIELDS, K. H. WOI.FE et
al., 1988 Codon usage patterns in Escherichia coli, Bacillus suDlili5,
Saccharomyces rermi.$iaQ, Srhizosaccharomyres pombp, Ihosophila mda-
nogastw and Homo .sapirna: a review of the considerable within- species diversity. Nucleic Arids Res. 16: 8207-8211.
SMITH, R. E., 1956 Quantitative relations between liver rnitochon-
dria metabolism and total body weight in mammals. Ann. NY
Acad. Sci. 62: 403-422.
Xia
SORENSEN, M. A., C. G. KVRIAND, and S. PEDLKSEN, 1989 Codon
usage determines translation rate in Escherichia coli. J. Mol. Bid.
WEIBEI., E . R., 1984 The Pathway for Oxygen: Structure and Function in
the Mammalian RPspirutory System. Harvard Univ. Press, Cam- bridge.
XIA, X., 1995 Body temperature, rate of biosynthesis and evolution
of genome size. Mol. Biol. Evol. 1 2 834-842.
ZIS(:HI.ER, H., H. CEISEK?‘, A. \’ON HAESELER, and S . P h B o , 1995 A
nuclear “fossil” of the mitochondrial D-loop and the origin of modern humans. Nature 378: 489-492.
207: 365-377.