Some aspects of structural analysis and design in seismic environment
Someswara Rao Kola1, Asha Viswanath1, B. Sreehari Kumar2, G V Rao1, S Wong3
1
CAE R&D Services, Cranes Software International Limited 5th Floor, Block-I, Shankaranarayana Bldg., MG Road, Bangalore, 560 001, INDIA
2
Corresponding author: [email protected], CAE R&D Services, Cranes Software International Limited, 5th Floor, Block-I, Shankaranarayana Bldg., MG Road, Bangalore, 560 001, INDIA
3
CAE R&D Services, Cranes Software, Inc. 1607 E. Big Beaver Road, Suite 250, Troy, MI 48083, USA
ABSTRACT
In the analysis and design of important structures, in particular of a nuclear power plant, specification of design response spectra is associated with different codes of practice and further followed by a combination rule for normal modes and the ground motion directions. While there are guidelines available for the seismic analysis of primary structures like reactor building, the same may not apply for the analysis of the secondary structures like piping systems. Hence, there is a need for the better specification of the earthquake motion, which is filtered through the primary structure. Support motions can be described using time histories, response spectra, frequency functions and power spectral density (PSD) functions. This paper aims at exploring the different structural analysis methods for multiply supported structures in NISA – A general purpose finite element based software. Floor response spectra (FRS) approach, which can be used for qualification of sensitive secondary systems and equipments, is discussed in detail. Generation of FRS from the random vibration analysis which is an attractive and better alternative method is discussed. Cross response spectrum method using the random vibration analysis of primary structure is proposed. Also, multiple support frequency, random vibration and transient vibration analyses features are presented.
INTRODUCTION
Rigorous analysis via time history approach is attractive and may be more realistic for seismic analysis of important structures such as nuclear power plants and their equipment. However, response spectrum approach remains still the most preferred one [1] by most of the designers in the field. The interesting part of the response spectrum approach is the progressive nature of improvements that are constantly being evolved in its application. Examples are recommendations by USNRC [2] for use of additional combination rules like Grouping method, Double sum method, Ten percent method, and improvements to CQC combination rule [3]. Further, suitable methods are available for generation of compatible time histories or power spectral density functions so as to be able to perform either time history analysis or random vibration analysis. While these methods can be conveniently applied for analyzing structures for uniform ground motion, analysis under non-uniform ground motion is specific to multiply supported structures like piping structures in nuclear power plants and long-span bridges. Specification of support motions for these structures is a challenging task given the uncertainty in the specification of seismic loads for the primary structure. In practice, design response spectra are specified for a site location, using which response spectrum analysis can be done on a primary structure to obtain the maximum response estimates. The analysis techniques applicable to the multisupport excitation problems include frequency response analysis, time history analysis and random vibration analysis in addition to the usual response spectrum approach. Multiple support excitation problems are typified by the necessity to evolve procedures to obtain the quasi-static part of the solution and the dynamic part as well. In the sections to follow, some of these aspects are described in detail followed by set of typical results pertaining to mostly nuclear engineering structures. NISA is equipped with a suite of finite element analysis programs for seismic applications and is utilized for presentation of the various results in this paper.
ANALYSIS FOR UNIFORM SUPPORT MOTION
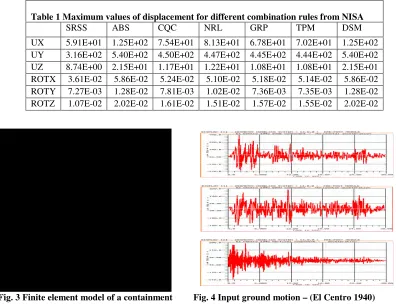
A typical building structure supporting a piping system in a power plant is shown in Fig. 1. For response spectrum analysis under uniform ground motion, it is assumed to be excited by the ground acceleration whose response spectrum is given in the Fig. 2, Eigen value analysis gives the first five natural frequencies as 0.98, 1.28, 1.85, 1.86 and 3.15 Hz, respectively. The structure is analyzed for maximum values of the displacements using NISA/DA (Advanced Dynamics) [4] module using different combinations rules and the results are shown in the Table 1.
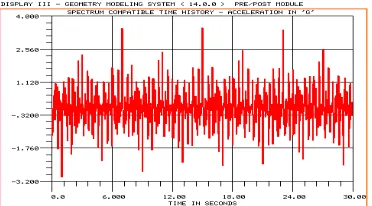
In time history approach, the forcing functions are specified in terms of ground motion time histories. The governing equations of motion can be directly integrated or the seismic response can be obtained by modal superposition. Fig. 3 shows containment structure subjected to uniform seismic ground motion (Fig. 4). The response contour plot as obtained in the form of a snap shot from NISA/Transient dynamic analysis is shown in Fig. 3.
Fig. 1 FE model of structure supporting a piping system
Fig. 2 Input acceleration response spectrum
Table 1 Maximum values of displacement for different combination rules from NISA
SRSS ABS CQC NRL GRP TPM DSM
UX 5.91E+01 1.25E+02 7.54E+01 8.13E+01 6.78E+01 7.02E+01 1.25E+02 UY 3.16E+02 5.40E+02 4.50E+02 4.47E+02 4.45E+02 4.44E+02 5.40E+02 UZ 8.74E+00 2.15E+01 1.17E+01 1.22E+01 1.08E+01 1.08E+01 2.15E+01 ROTX 3.61E-02 5.86E-02 5.24E-02 5.10E-02 5.18E-02 5.14E-02 5.86E-02 ROTY 7.27E-03 1.28E-02 7.81E-03 1.02E-02 7.36E-03 7.35E-03 1.28E-02 ROTZ 1.07E-02 2.02E-02 1.61E-02 1.51E-02 1.57E-02 1.55E-02 2.02E-02
Fig. 3 Finite element model of a containment structure
Fig. 4 Input ground motion – (El Centro 1940)
Similar to the case of spectrum compatible time histories, procedures are available in literature for generation of spectrum compatible PSD also. Since characterization of ground motion through PSD is more appropriate, the spectrum compatible PSD can be directly used to estimate the peak structural responses. Fig. 8 shows a generated PSD - stationary - from the same design response spectrum in Fig. 5.
Fig. 5 Target spectrum along with realized spectra of both stationary and non-stationary time histories.
Fig. 6 Spectrum compatible stationary time history
Fig. 7 Spectrum compatible Non-stationary time history Fig. 8 Spectrum compatible PSD
ANALYSIS FOR MULTIPLE SUPPORT MOTIONS [6]
Consider a structure, which is subjected to Ng number of support excitations. The governing equation for this system can be shown to be given by
[ ]
M
{ }
&
x
&
+
[ ]
C
{ }
x
&
+
[ ]
K
{ } {
x
=
P
(
t
)
}
(1)where the mass (M), damping(C) and stiffness (K) matrices of N x N order ( N is the degree of freedom) in partition form are given by
[ ]
[ ]
[ ]
=
=
=
gg T sg sg s gg T sg sg s gg T sg sg sK
K
K
K
K
C
C
C
C
C
M
M
M
M
M
,
,
(2)Here subscript‘s’ refers to superstructure and ‘g’ to the supports. Partitioning the displacement vector as
x
=
{
x
su
g}
Twhere xs is the superstructure displacement vector and
u
gis support displacement vector. Further expressing xs in the form{
}
Tg s
u
x
x
=
wherex
s(
t
),
x
(
t
)
are pseudo static and dynamic components of the displacements. By neglecting the
designated as influence matrix. By using this relation between
x
s andu
gin equation (1), the governing equation of dynamicresponse can be obtained as
[
M
s]
{ }
&
x
&
+
[ ]
C
s{ }
x
&
+
[ ]
K
s{ }
x
=
{
P
eff(
t
)
}
(3)And ignoring contribution of damping to the effective force,
P
eff(
t
)
can be shown to be given by
P
eff(
t
)
=
(
M
gs+
M
gL
)
u
&
&
g=
Γ
u
&
&
g (4)The above equation (3) can be solved using normal mode expansion. Let
φ
and
ω
n,
n
=
1
to
N
be the eigen vector and natural frequencies of the undamped structure. Modal response can be computed from the equation.
q
&
&
n( )
t
+
2
η
nω
nq
&
n( )
t
+
ω
n2q
n( )
t
=
φ
nTP
eff(
t
)
(5)And kth displacement vector can be calculated using the modal transformation
(
)
(
)
1
t
q
t
x
nN
n kn
k
∑
=
=
φ
.Floor response spectra:
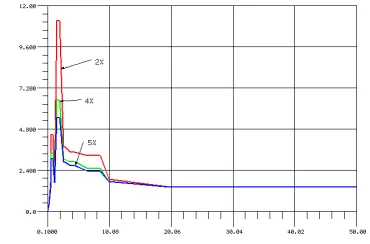
The approach described above can be conveniently applied to analyze secondary structures with support excitations described either in time or frequency domain. These methods are highlighted in sections to follow. In the particular case of response spectrum approach, floor response spectra (FRS) can be used for analysis of secondary structures that are in turn generated from the analysis of the primary supporting structure. A time history approach can be used to generate the FRS. In this approach, the input ground motion is specified in the three global directions and permuted with specified scale factors (See Table 2).The output time histories at different floor levels where the piping system is supported are converted to response spectra and averaged (Fig. 9) [4].
Table 2. FRS generation from NISA transient dynamics analysis- Six Combinations of the input seismic time histories in the three directions
Combination 1 2 3 4 5 6 Factor
X direction A(t) A(t) B(t) B(t) C(t) C(t) 1
Y direction B(t) C(t) A(t) C(t) B(t) A(t) 1
Z direction C(t) B(t) C(t) A(t) A(t) B(t) 0.667
Response spectrum analysis - multiple support motions
In response spectrum approach, the inherent assumption is that support excitations are mutually independent. For example, using CQC rule for combination across modes and SRSS across excitation directions, the displacement can be shown to be given by
∑ ∑∑
=
gN N N
in im in im mn
k
R
R
x
2
max
γ
µ
µ
(6)Fig 9. Floor response spectra at a particular node in a floor for 2%, 4% and 5% damping
where,
µ
im,
R
im andγ
mn are modal participation factors, response spectrum ordinates and CQC coefficients respectively. The assumption of the excitations being independent is not valid incase of secondary systems. A more accurate method proposed here - cross spectrum method [7,8] to account for these correlations involves random vibration analysis first performed on the primary structure and the auto and cross PSD function of the support points determined. Response spectra – which can be termed as FRS are now derived from the auto PSD functions using the random vibration theory [9]. Any response quantity of interest can be obtained from the modified combination rule.
∑∑∑∑
= = = ==
g g N i N j N m N n jn im jn im ijmnk
R
R
X
1 1 1 1
max
γ
µ
µ
(7)where,
γ
ijmn are new “cross response spectrum coefficients” which can be computed from the auto and cross PSD functions of the support motions using the following equations.( )
( ) ( )
nj mi ij n m ijmnS
H
H
σ
σ
ω
ω
ω
ω
γ
d
*∫
∞ ∞ −=
andσ
2( )
ω
2( )
ω
dω
ii m mi
∫
H S∞ ∞ −
= (8)
where,
S
ii(
ω
)
andS
ij(
ω
)
are auto and cross PSD functions respectively. And these cross response spectrum coefficients ijmnγ
degenerate to exact CQC coefficients wheni
=
j
.
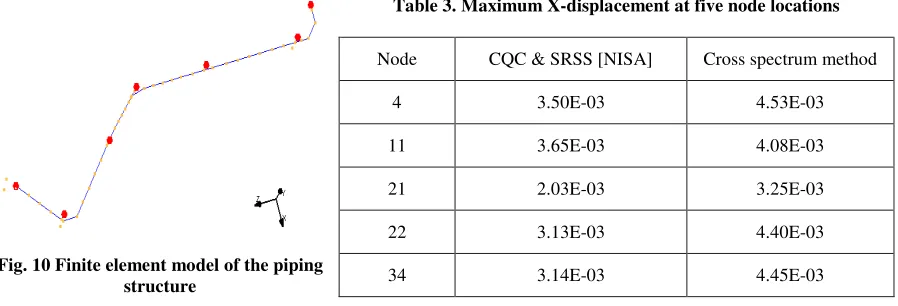
As can be observed from the equation (7), this new method incorporates the correlation effects efficiently through cross PSD function. To demonstrate the results from the two approaches, a piping structure supposed to be supported at various floor levels of a typical nuclear reactor building has been considered. The finite element model of the piping structure is shown in the Fig. 10.The first five natural frequencies of the structure are found to be 1.51, 2.69, 2.97, 4.05 and 5.31 Hz respectively. It is assumed that structure is viscously damped with 4% damping for all modes.Maximum X-displacements at five node locations on the structure found using the two methods are shown in the table 3. As can be observed from the displacement results, cross spectrum method incorporates the correlation effects efficiently through cross PSD function.
Envelope spectrum method [1]
As an approximate alternative, envelope response spectrum method can be used to analyze the secondary structure. As its name indicates, the envelope spectrum method uses the envelope of the non-uniform ground motion spectra and is assumed to be acting uniformly in each global direction thus resulting in a reduced computation. NISA/Advanced dynamics
Table 3. Maximum X-displacement at five node locations
Node CQC & SRSS [NISA] Cross spectrum method
4 3.50E-03 4.53E-03
11 3.65E-03 4.08E-03
21 2.03E-03 3.25E-03
22 3.13E-03 4.40E-03
Fig. 10 Finite element model of the piping
module, which is provided with this option, is used to obtain this result on the pipe model (Fig. 10) and the results shown in Table 4 below.
Table 4. Maximum displacement for CQC rule using Envelope spectrum method
UX UY UZ ROTX ROTY ROTZ
CQC& SRSS method 5.26E-03 1.14E-02 4.56E-03 1.34E-03 1.61E-03 1.28E-03 Envelope method 5.57E-03 2.05E-02 5.42E-03 1.69E-03 1.62E-03 1.67E-03
Time history approach - multiple support motions
To illustrate the multiple support transient analysis, a two span bridge (Fig. 11) modeled with two-dimension beam elements have been considered. Two spans are assumed to be 55m and 45 m respectively. The structure is taken to have a constant mass per unit length m and flexural rigidity EI, such that EI/m is to be equal to 3.25E5 m4/s2. First three Eigen values are found to be 3.83, 6.78 and 14.81 Hz respectively.
Fig. 11 Finite element model of bridge
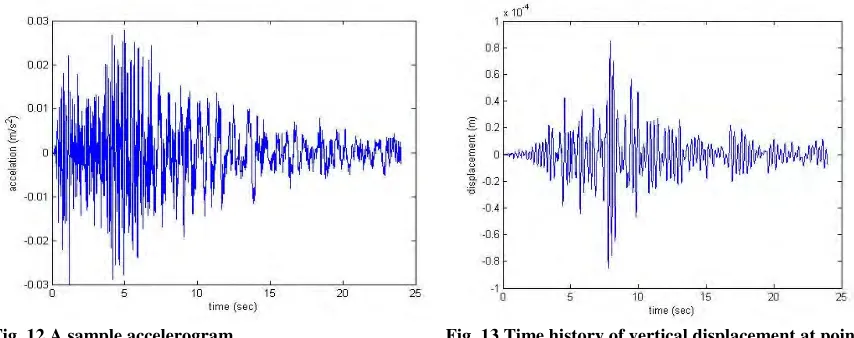
Three ground excitation records are taken from PEER Strong Ground Motion Database [10] to be used as excitation a sample of which is shown in Fig. 12. The governing equations of motion for dynamic part of the solution (equation 5) can be directly integrated or the seismic response can be obtained by modal superposition. NISA uses two methods of directly integrating the linear dynamic equations, namely Newmark method and adaptive Newmark method [11]. Adaptive Newmark method has advantage over the original Newmark method as it computes the next time step based on the norm of the acceleration at each time. For illustration time history of vertical displacement at point P is shown in Fig. 13.
Fig. 12 A sample accelerogram Fig. 13 Time history of vertical displacement at point ‘P’
Frequency response analysis - multiple support motions
There are again to two approaches available to perform frequency analysis of a structure. In the first method, modal summation approach, each modal response in frequency domain can be obtained by taking Fourier transform of equation (5).
( )
ω
η
ω
( )
ω
ω
( )
ω
φ
eff( )
ω
T n n
n n
n n
n
q
q
P
q
&
+
2
&
+
2=
With modal response obtained as
Q
(
ω
)
=
H
M(
ω
)
P
eff(
ω
)
, dynamic response is now obtained from modal dynamic run of frequency response analysis asX
d(
ω
)
=
φ
Q
(
ω
)
, where HM(
ω
)is the frequency response function ineach mode and is of the form
H
M(
ω
)
=
[
−
ω
2+
i
2
ηωω
n+
ω
n2]
−1. The total response in frequency domain is obtainedby appropriately combining the quasi-static and dynamic parts of the solution. In the second method - direct frequency analysis - Fourier transform of the governing equation of system (5) of the dynamic part of the response and solution avoids the eigen value analysis which may be in some cases practically infeasible for large order systems. In the frequency domain equation (3) can be written as
[
−
ω
M
+
i
ω
C
+
K
]
{
x
( )
ω
}
=
{
P
eff( )
ω
}
2(10)
Once solution x(
ω
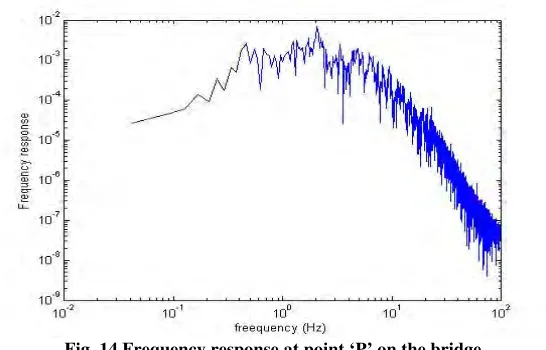
) is obtained from equation (10), the total response can be obtained by appropriately combiningx(w) with the quasi-static solutionto illustrate the above two methods, same structure as in example 2 is considered. Input frequency functions required for frequency analysis are obtained from the ground motion time histories using DFT facility of NISA/DYSPAN. Then the structure is analyzed using the two methods explained above which essentially yield same response. For illustration vertical displacement at point P is shown in Fig. 14.
Fig. 14 Frequency response at point ‘P’ on the bridge
Random vibration analysis - multiple support motions
Under multiple support excitations, the dynamic part of the response from equation (5) can be directly obtained in terms of the input PSD matrix as
( )
ω
H
( )
ω
S
( )
ω
H
( )
ω
S
g
u x
*
Γ
Γ
=
(11)Here
( )
ω
g
u
S
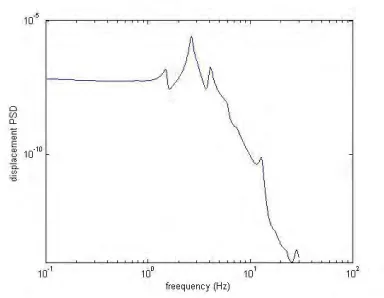
is the psd matrix of ground accelerations. In this connection, complete input specification for random vibrationanalysis includes auto and cross PSD functions for the differential support motions. One can use the modal summation method also to obtain the response PSD. NISA takes advantage of the bandwidth of the excitations to optimise the modal summation procedure. Response spectra at support points are assume to be given and a sample has been shown in Fig. 15. These spectra are converted into PSD functions using NISA/DYSPAN. Dynamic part of displacement PSD at one location of the pipe is shown in fig. 16.
Fig. 15 Response spectra Fig. 16 Displacement PSD at point on pipe
CONCLUSIONS
In this paper, methods of analysis of important structures such as those of a nuclear power plant are described. The emphasis is on special techniques to handle multi-level specifications with regard to the seismic events. In particular, alternative methodologies that can be utilized for analyzing secondary systems are highlighted. The approach primarily involves using the concept of multiple support excitations at the secondary structure supports. A novel method is suggested for multiple support response spectrum analysis using random vibration theory. This approach efficiently incorporates the correlation effects between support excitations through cross PSD functions.
REFERENCES
1.ASCE 4-98 American Society of civil Engineers, Seismic Analysis of Safety – Related Nuclear Structures and Commentary, 2000.
2.USNRC Regulatory Guide 1.92, ‘Combining Modal Responses and Spatial Components in Seismic Response Analysis’, February 1976.
3.Der Kiureghian, A and Nakumara, Y, ‘CQC Modal Combination Rule For High Frequency Modes’, Earthquake Engineering and Structural Dynamics, V 22, pp. 943-956, 1993.
4.NISA II User’s Manual Version 15.0, Cranes Software, Inc. 1607 E. Big Beaver Road, Suite 250,Troy, MI, 48083, USA, 2007.
5.NISA/DYSPAN User’s Manual Version 15.0, Cranes Software, Inc. 1607 E. Big Beaver Road, Suite 250,Troy, MI, 48083, USA, 2007.
6.Anil K. Chopra, Dynamics of Structures, Pearson Education, Second edition, New Delhi, 2001.
7.Someswara, Rao Kola,A new modal combination rule for multiply supported structural analysis using critical cross power spectral density functions, M.E. thesis, Department of Civil Engineering, Indian Institute of Science, 2002.
8.Der Kiureghian, A. and Neuenhofer, A. “Response spectrum method for incoherent support motions.” Proceedings of the Tenth World Conference on Earthquake Engineering, 1992, pp.4757-4762.
9.Nigam, N C, Introduction to Random Vibrations, The MIT press series in structural mechanics, 1983.
10. PEER strong ground motion database, http://peer.berkeley.edu/products/strong_ground_motion_db.html