ABSTRACT
Recently, the concept of a risk-informed design (RI-D) has been widely accepted during the design process of new nuclear plants, e.g., the EPR-1500, the Gen-IV reactors. The roles of the RI-D will be defined differently for each design work of a plant. However, two basic roles of the RI-D are widely accepted: (1) a derivation/classification of the accidents types, i.e. Anticipated Operational Occurrence, Design Basis Accident (DBA), and Beyond DBA, (2) a classification of the structures, systems and components (SSCs) based on risk information. It is expected that such features of the RI-D will considerably increase the safety and economy of new plants over the conventional ones. In this paper, we propose a method to classify the SSCs at a design stage by using a genetic algorithm. The proposed method is tested with a simple PSA (Probabilistic Safety Assessment) model of a PWR (Pressurized Water Reactor).
INTRODUCTION
Recently, the concept of a risk-informed design (RI-D) has been widely accepted during the design of new reactors such as the EPR-1500, the Gen-IV reactors [1-2]. The role of the RI-D will be defined differently for each design work of a plant. However, two basic roles of the RI-D are commonly accepted: (1) a derivation/classification of the accident types, i.e. Anticipated Operational Occurrence, Design Basis Accident (DBA), and Beyond DBA, (2) a classification of the structures, systems and components (SSCs) based on the results of a risk evaluation [3].
In this paper, we propose a method to optimize a classification of the SSCs at design stage by using a reliability allocation approach.
Fig. 1 Risk-informed SSCs Classification
We can reduce the number of SSCs that belong to the SRSS group by using a risk-informed SSC classification process. However, in addition, we can reduce this number further via a reliability allocation approach. That is, the PSA (Probabilistic Safety Assessment) provides the important information for classifying the SSCs. Therefore, if we can optimize the reliability of the SSCs, we can minimize the number of SSCs which belong to the SRSS group. This can be regarded as a kind of reliability allocation problem. Therefore, we used a genetic algorithm to solve this problem.
In section 2, we will explain the general risk-informed SSCs classification process and the developed PSA model. The developed genetic model with an objective function will be explained in section 3. The conclusions will be given in the final section.
THE DEVELOPED PSA MODEL
As explained in the introduction, the SSCs are classified into four groups according to their importance from a risk point of view. The PSA plays a major role in a classification of the SSCs. However, not all the SSCs are modeled in the PSA. That is, the SSCs of a nuclear power plant can be divided into two categories: (1) the SSCs modeled in the PSA, (2) the SSCs not modeled in the PSA.
For the secondary category, expert judgments are used to classify the SSCs into four groups. For the SSCs modeled in the PSA, the importance measures, i.e. FV (Fussel-Veselly) and RAW (Risk Achievement Worth) are used for a classification of the SSCs. Fig.2 shows that the criteria to classify the SSCs of the first category with FV and RAW.
In this paper, we will focus on the first category, i.e. the SSCs modeled in the PSA. Therefore, a simplified PSA model is developed for a PWR (Pressurized Water Reactor) in order to evaluate the proposed method. We developed simplified event trees for the following four major initiating events:
Fig.2 The Criteria to Classify the SSCs
(1) Loss of Coolant Accident Group;
9 Large & Medium LOCA; the frequency is assumed as 6.60E-6/year. 9 Small LOCA; the frequency is assumed as 2.43E-5/year.
(2) Transient Group;
9 Loss of Main Feedwater; the frequency is assumed as 5.40E-3/year. 9 Loss of Offsite Power; the frequency is assumed as 6.15E-4/year. The following 11 systems are modeled in the PSA model.
(1) Reactor Trip System (RT), (2) Bleed System (BD),
(3) Safety Injection Tank (SIT),
(4) High Pressure Safety Injection System (HPSI), (5) Low Pressure Safety Injection System (LPSI), (6) Main Feedwater System (MFWS),
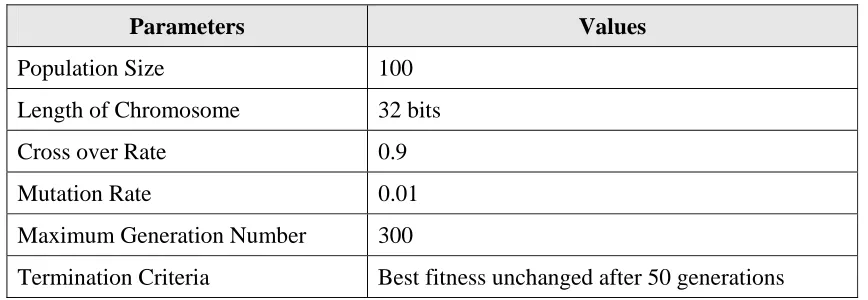
Length of Chromosome 32 bits
Cross over Rate 0.9
Mutation Rate 0.01
Maximum Generation Number 300
Termination Criteria Best fitness unchanged after 50 generations
With the developed model, an optimization is performed to minimize the number of SSCs which belong to the SRSS group. The fitness of an the individual is measured by using an objective function. We defined the objective function for the optimization as the number of SSCs which belong to the SRSS, i.e., the number of SSCs with FV > 0.05 and RAW > 20.
In addition, we do not want to decrease the safety of a nuclear power plant due to a re-classification of the SSCs. So, the CDF (Core Damage Frequency) is maintained at a fixed value, 3.94E-5/yr. as an important constraint during the optimization process. That is, before and after the optimization process, the CDF value is not changed.
Fig. 4 Optimized Reliabilities of the Main Systems
Fig.5 Changes of the FV Importance
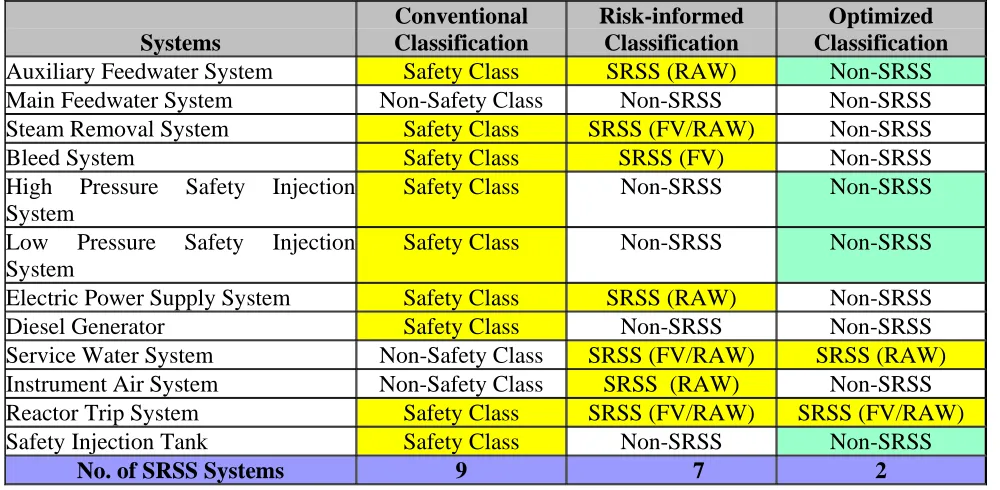
High Pressure Safety Injection System
Safety Class Non-SRSS Non-SRSS Low Pressure Safety Injection
System
Safety Class Non-SRSS Non-SRSS Electric Power Supply System Safety Class SRSS (RAW) Non-SRSS
Diesel Generator Safety Class Non-SRSS Non-SRSS
Service Water System Non-Safety Class SRSS (FV/RAW) SRSS (RAW) Instrument Air System Non-Safety Class SRSS (RAW) Non-SRSS Reactor Trip System Safety Class SRSS (FV/RAW) SRSS (FV/RAW) Safety Injection Tank Safety Class Non-SRSS Non-SRSS
No. of SRSS Systems 9 7 2
As we can see in Table 2, there are 9 systems which belong to a safety class if we follow the conventional SSCs classification approach. If we adopt the risk-informed SSCs classification approach, there are 7 which systems belong to the SRSS group.
However, after the optimization process, there is only two systems which belong to the SRSS group. The results show that our approach can reduce the number of systems which belong to the SRSS group greatly, while maintaining the same safety level of a nuclear power plant.
CONCLUSIONS
In this paper, we proposed a method to classify the SSCs at a design stage of a nuclear reactor by using a genetic algorithm. In general, the relationship between the reliability of SSCs and the cost of them is widely used as an objective function in traditional reliability allocation problems. However, it is very difficult to define reliable objective functions in such cases since it is difficult to obtain an exact relationship between them. So, in most cases, assumed relationships between them are used.
The proposed method is tested with a simple PSA model of a PWR. The simulation results showed that we can reduce the number of SSCs which belong to the SRSS group. This will help to considerably reduce the operational and/or construction costs of a plant. The present work was undertaken at a feasibility study level. This approach will be applied and validated at a component level in a future work.
REFERENCES
1. Ari Julin, "PSA in the Design Phase of NPPs: Experience from Olkiluoto 3 EPR NPP Licensing ," IAEA W/S on PSA-Implementation and Applications, China, May 29 - June 2, 2006
2. A Technology Roadmap for Gen-IV Nuclear Energy Systems, GIF-002-00, D.O.E., Dec. 2002
3. Malcolm La Bar, "ANS Gas Reactor Safety Criteria Standard - Status of Development," PROBABILISTIC SAFETY ANALYSIS 2005, San Francisco, California, September 12, 2005
4. NEI (2005), “10 CFR 50.69 SSCs Categorization Guideline,'' NEI-00-04
5. Joon-Eon Yang et al., “Application of genetic algorithm for reliability allocation in nuclear power plants,” RESS, Vol.65, Issue 3, Sep. 1999