Reliability Analysis of Pipe Whip Impacts
Robertas Alzbutas 1), Gintautas Dundulis1), Ronald F. Kulak2), Paul V. Marchertas2)
1)
Lithuanian Energy Institute, Lithuania
2)
Argonne National Laboratory, USA
ABSTRACT
The material strength parameters, the geometry parameters of components and structures and loads are uncertain. These random effects associated with material properties, loads, geometry of components need be incorporated into the reliability analysis in order to have more realistic estimation of the structural response. The reliability analysis uses probabilistic methods to take a more structured view as well as the random variables in order to model these uncertainties. A probability-based approach is presented as the integration of probabilistic methods and deterministic modelling based on the finite element method used for mechanical analysis of components and structures. The software ProFES was used for the probabilistic analysis and the finite element software NEPTUNE for deterministic structural integrity evaluation. The developed methodology is applied to the analysis of a whipping group distribution header, which results from a guillotine break, and subsequent impact with the adjacent building wall; this is a postulated accident for the Ignalina Nuclear Power Plant RBMK-1500 reactors. The Monte Carlo Simulation, First Order Reliability Method and Response Surface Method were used in the probabilistic analysis. The uncertainties of material properties, component geometry data and loads were taken into consideration. The probabilities of failure for the impacted building wall and of the group distribution header support-wall from uncertainties in material properties, geometry parameters and loading were estimated.
KEY WORDS: Finite Element Method, Probabilistic Finite Element Analysis, RBMK-1500, Ignalina NPP, Pipe Whip Impact, Failure of Wall, Structural Integrity Evaluation
INTRODUCTION
The Ignalina Nuclear Power Plant consists of two RBMK-1500, graphite moderated, boiling water, multichannel reactors [1]. In comparison to Western power plants, RBMK-type reactors contain a large number of pipes. Some compartments contain a lot of high-energy pipelines, which are located close each to other. A guillotine rupture of one of these high-energy pipelines raises serious safety concerns about severe damage to neighbouring pipelines and to the building structures. In order to investigate the possible extent of damage from pipe ruptures, it is extremely important to verify that the building structure is sufficient to endure the dynamic loading during a maximum design accident. At the same time calculations should be performed to determine if the strength of the pipes themselves is sufficient to prevent a single rupture from propagating into a multiple rupture event. This latter event is not addressed in this paper.
The Group Distribution Header (GDH) is one of the most important components for reactor safety. The Emergency Core Cooling System (ECCS) piping is connected to the GDH. In case of a rupture, coolant flows through the ECCS and the GDH piping creating a new load. The GDH, which is involved in the motion after a guillotine break, can impact the neighbouring GDH or the adjacent wall of the compartment.
A conservative analysis of the GDH pipe break transient was performed [2]. This paper presents methodology of integration of probabilistic methods and deterministic modelling based on nonlinear finite element transient analysis. The developed methodology is applied to the analysis of a whipping group distribution header and subsequent impact with the adjacent building wall. A whipping GDH, the supporting concrete walls and adjacent building wall were modelled using the deterministic finite element software NEPTUNE [3]. It enabled the structural analysis of the dynamic pipe whip that accommodates large displacements and nonlinear material response, both of which occur in considered simulations.
The ProFES [4] software was used for the probabilistic analysis related to the same piping failure and wall damage after the GDH guillotine failure. ProFES is a probabilistic analysis system that allows designers to perform probabilistic finite element analysis in a 3D environment that is similar to modern deterministic FEA. In this study, ProFES is coupled to the deterministic finite element software NEPTUNE as described in [5]. This coupling simplifies the modelling of uncertainties and their affect on model and system reliability. The Monte Carlo Simulation Method, the First Order Reliability Method and the Response Surface Method were used for probabilistic analyses of the impacted- wall and the support-wall for the case of a GDH guillotine break.
MODEL FOR THE ANALYSIS OF DAMAGE TO THE ADJACENT WALL
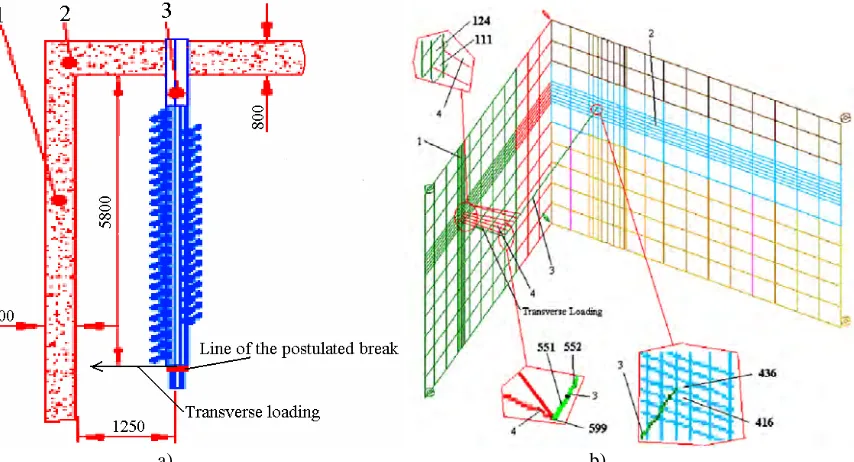
The subject of this investigation is the collision between the GDH and the adjacent wall that would result from a guillotine break at the blind end of a GDH. Structural integrity of the GDH support-wall is also important. Therefore, the GDH 3 and the walls 1 and 2 (see Fig. 1) are included in the model of a whipping GDH analysis.
Transactions of the 17th International Conference on
Structural Mechanics in Reactor Technology (SMiRT 17) Prague, Czech Republic, August 17 –22, 2003
a) b)
Fig. 1. Top view of the GDHs in the compartment and combined model of GDH pipes and concrete walls for
investigation of impact to wall: 1 – adjacent impacted-wall, 2 – GDH’s support-wall, 3– broken GDH, 4 - contact element between GDH pipes, 111 – number of rebar element adjacent to nodes of GDH and wall contact, 124 – number of concrete element adjacent to nodes of GDH and wall contact, 416 – number of rebar element adjacent to node of the whipping GDH pipe fixity, 436 – number of concrete element adjacent to node of the whipping GDH pipe fixity, 599 number of end node of the whipping GDH, 551, 552 – number of the whipping GDH pipe elements..
The group distribution header is a horizontal cylinder (pipe) with outside diameter of 0.325 m, wall thickness of 0.015 m, and is about 6 m long. The distance from the centreline of the outboard GDH to the inside surface of the adjacent wall is 1.25 m. The thickness of the impacted wall is 0.5 m and of the supporting wall is 0.8 m.
The compartment walls were modelled using the four-node quadrilateral plate element developed by Belytschko, et al. [6]. The formulation of this element is based upon the Mindlin theory of plates and uses a velocity strain formulation. The material model can treat elastoplastic behaviour. Kulak and Fiala [3] expanded the formulation by incorporating the ability to model a composite plate of reinforced concrete. GDHs were modelled using three-dimensional pipe elements. For the global solution of a pipe whip event, the use of a pipe element capable of undergoing large displacements in three–dimensional space was required.
Regarding material properties, the model to be analysed has two basic parts: the GDH that is made from 08X18H10T steel and the compartment walls that are made from M300 reinforced heavy concrete.
More detailed descriptions of the geometry of the GDH, adjacent piping and surrounding walls, material properties and description of the finite-element methodology are presented in [2].
The transient analysis of a guillotine pipe break was reported in [2]. It was conservatively assumed that the transverse load applied to the end of the GDH was equal to the axial load. This load was also applied here in the probabilistic analysis. This essentially is an upper bound load and, for this study using Monte Carlo Simulation and First Order Reliability. Method, was not treated as a random variable. However, the load of the guillotine break is uncertain. The RS/MCS method was used to express failure probability as function of the loading and to investigate the dependence between impact load and failure probability.
PROBABILISTIC ANALYSIS METHODS
NASTRAN. The software NEPTUNE was used to perform deterministic transient analysis of a GDH break. By default, NEPTUNE input/output cannot be imported directly into ProFES. Thus, for this purpose, a special ProFES/NEPTUNE translator was developed at Argonne National Laboratory. The translator, which is written in Perl, has been developed to exchange information between NEPTUNE and ProFES [5]. The Monte Carlo Simulation (MCS), the First Order Reliability Method (FORM) and the Response Surface (RS/MCS) method were used to perform probabilistic analyses of a whipping GDH impacting against adjacent piping and concrete walls.
Monte Carlo Simulation generates samples of each random variable and runs the deterministic model with different combinations of these random variables. Estimates of uncertainties and probabilities are determined by a simple statistical analysis of the simulation results. The First Order Reliability Method searches the input variables for the combination that is most likely to cause failure. This point is often referred to as the design point or the most probable point (MPP). It then fits a linear surface at the MPP and uses this surface (along with transformations for any non-normal random variables) to compute probabilities. A variant of this method is SORM; wherein a second order surface is fit at the MPP. The RS/MCS method fits a response surface about the mean of the random variable and then computes statistics of response variables and probabilities for each limit state using MCS.
MCS was the primary method used to study the sensitivity of the response variables and the effect of uncertainties of material properties and geometry parameters to probability of limit states. MCS is a method, which is suitable for simulations that execute relatively quickly (e.g. simple linear finite element models or closed form expressions), because it typically requires a large number of response variables and limit state function evaluations. The precision of the evaluations depends on the number of evaluations and the chosen value of the failure probability.
The second method, FORM, was used to study the probability of failure for the impacted GDH and the support-wall. FORM is the preferred method for evaluating small probabilities (failure of concrete, rebars and GDH) because for the same precision as MCS it often requires the least number of finite element model runs. With FORM, the computational effort is proportional to the number of random variables and limit states. Therefore, the most important random variables and limit states were selected according the results using MCS.
Initially, the RS/MCS method was used to determine a function that express the failure probability. Then the RS/MCS method was used to study the relation between failure probability and impact loading.
Probabilistic Analysis using MCS Method
The MCS method was used to study the effect of uncertainties in material properties and geometry parameters as well as to calculate the probabilities of limit states. The aim of the uncertainty analysis is to identify and quantify all potential important uncertainty parameters. Ranges and subjective probability distribution describe the state of knowledge about all uncertain parameters. In probabilistic analysis, uncertainties in numerical values are modelled as random variables. The following mechanical properties and geometrical parameters important to strength of structures were simulated as random variables:
- Uncertain mechanical properties:
• Concrete – Poisson ratio, Young’s modulus, uniaxial tensile strength of pipe support-wall (wall No. 1 and 2 in Fig. 1);
• Rebar – Yield stress (wall No. 1 and 2 in Fig. 1);
• Pipe – Poison ratio, Young modulus, Yield stress (pipes 3);
• Contact modulus. - Uncertain geometry data:
• Reinforced concrete – Rebar area (wall No. 1 and 2 in Fig. 1);
• Pipe – thickness and mid-surface radius of the 3rd pipe.
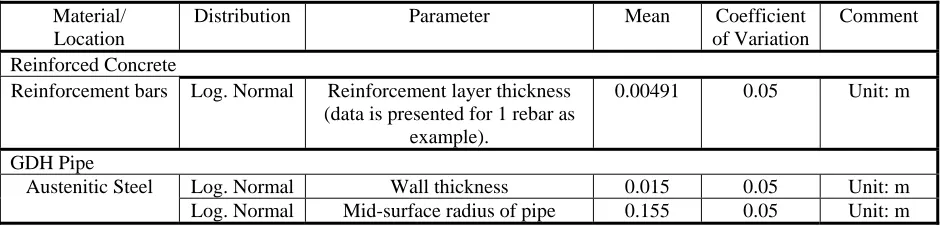
The coefficient of variables was adopted according to data and approaches presented in papers [7, 8]. The logarithmic normal distribution for mechanical properties and geometry parameters was used in this analysis. The selected random variables, distributions and coefficients of variation are presented in Table 1 and Table 2.
The GDH pipe, displaced after guillotine break, may impact on the adjacent wall. Therefore, GDH impact on adjacent wall was investigated. The aim of the transient analysis was to evaluate:
• Structural integrity of adjacent wall after impact;
• Structural integrity of the GDH support-wall.
According to the aim of the analysis the following limit states were assumed for the case of the GDH impact on the adjacent wall:
1. Limit State 1 - Contact between the broken GDH and the adjacent wall occurs.
2. Limit States 2, 3, 4, 5 and 6 - The concrete element adjacent to node of the GDH and wall contact reaches the ultimate strength in tension and the crack in concrete starts to open. NEPTUNE calculates stresses of the concrete element at five integration points. Therefore, the same limit states at all five integration points through wall thickness were checked.
4. Limit State 12 – The strength limit of the rebars (first rebar layer) in the concrete adjacent to the node of the GDH pipe and wall contact is reached and the rebars can fail.
5. Limit State 13 - The strength limit of the rebars (first rebars layer) in the concrete adjacent to pipe fixity in the support-wall is reached and the rebars can fail.
Table 1. The material properties and parameters expressed as random variables
Material/ Location
Distribution Parameter Mean Coefficient of Variation
Comment
Reinforced Concrete
Log. Normal Poisson’s ratio 0.2 0.1
Log. Normal Young’s modulus 2.7e+10 0.1 Unit: Pa Concrete (1, 2 walls –
Fig. 1)
Log. Normal Uniaxial tensile strength 1.5 e+6 0.1 Unit: Pa Reinforcement bars (1,
2 walls)
Log. Normal Yield stress 3.916e+8 0.03 Unit: Pa
GDH Pipe
Log. Normal Young’s modulus 1.8e+11 0.03 Unit: Pa Log. Normal Poisson’s ratio 0.3 0.03
Austenitic Steel
Log. Normal Yield stress 1.77e+08 0.03 Unit: Pa Contact of Pipes Normal Contact modulus 1.8e+11 0.1 Unit: Pa
Table 2. The geometry parameters of random variable
Material/ Location
Distribution Parameter Mean Coefficient
of Variation
Comment
Reinforced Concrete
Reinforcement bars Log. Normal Reinforcement layer thickness (data is presented for 1 rebar as
example).
0.00491 0.05 Unit: m
GDH Pipe
Log. Normal Wall thickness 0.015 0.05 Unit: m Austenitic Steel
Log. Normal Mid-surface radius of pipe 0.155 0.05 Unit: m
It is important to calculate the probability of concrete element failure at the same run at all five integration points. Therefore, the following two system events were used in the probability analysis:
• System event 1 – Limit state 2, limit state 3, limit state 4, limit state 5 and limit state 6. This system event is evaluated as true if all the limit states are true. This system event evaluates the probability of crack opening in concrete at all integration points of the impacted wall, i.e., a complete crack through the wall.
• System event 2 – Limit state 7, limit state 8, limit state 9, limit state 10 and limit state 11. This system event is evaluated as true if all the limit states are true. This system event evaluates the probability of concrete failure (in compression) at all integration points of the GDH pipe fixity in support wall.
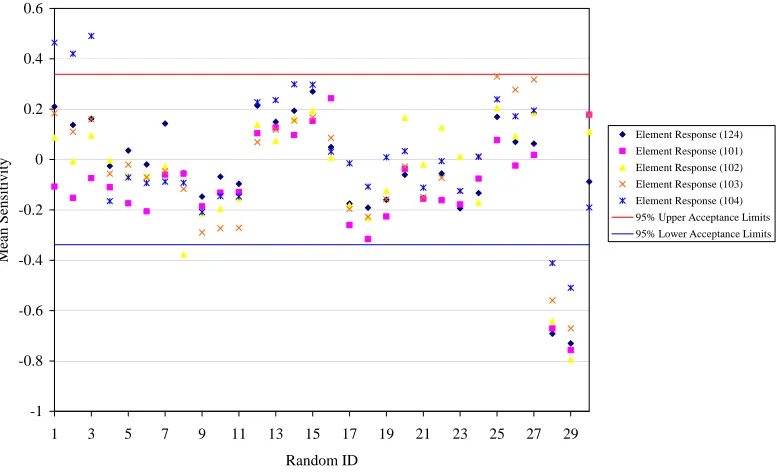
The MCS method was used to study the sensitivity of the response variables and the effect of uncertainties of material properties and geometry parameters to the probability of limit states. The screening of insignificant random variables from the large number of input random variables was performed using 95% confidence limits for sensitivity measures (acceptance limits for correspondent random variables). In order to have the possibility to compare different values, the sensitivity measures and 95% confidence limits were normalized.
-1 -0.8 -0.6 -0.4 -0.2 0 0.2 0.4 0.6
1 3 5 7 9 11 13 15 17 19 21 23 25 27 29
Random ID
Mean S
ensitivity
Element Response (124) Element Response (101) Element Response (102) Element Response (103) Element Response (104) 95% Upper Acceptance Limits 95% Lower Acceptance Limits
Fig. 2 Significant Random Variables for Element Response (124, 101, 102, 103, 104) Stress Equivalent
The following input random variables are the most significant random variables for the impacted wall at concrete element number 124 (101, 102, 103, 104- are only conditional designation of 2nd, 3rd, 4th and 5th integration points of element 124), which is located at the point of impact:
• Poisson’s ratio of the impacted-wall concrete (1 – Fig. 1) – input random variable 1;
• Young’s modulus of the impacted-wall concrete (2 – Fig. 1) – input random variable 2;
• Tensile Strength of the impacted-wall concrete (1 – Fig. 1) – input random variable 3;
• Yield Stress of the impacted-wall rebars (1 – Fig. 1) – input random variable 8;
• Young’s modulus of the whipping GDH (3 – Fig. 1) – input random variable 25;
• Wall thickness of the whipping GDH (3 – Fig. 1) – input random variable 28;
• Mid-surface radius of the whipping GDH (3 – Fig. 1) - input random variable 29.
These input random variables have the greatest positive (1, 2, 3, 25) or negative (8, 28, 29) influence on all integration points of concrete element 124.
According to the results of the sensitivity analysis related to response variables, materials properties, geometry data and limit states, the following additional items have the greatest influence on the probability of failure for the support-wall:
• Poisson’s ratio of the support-wall concrete (4 – Fig. 1) – input random variable 9;
• Young’s modulus of the support-wall concrete (4 - Fig. 1) – input random variable 10;
• Tensile Strength of the support-wall concrete (4 - Fig. 1) – input random variable 11.
All the previously listed random variables were used in the FORM analysis as input random variables.
Probabilistic Analysis Using the FORM Method
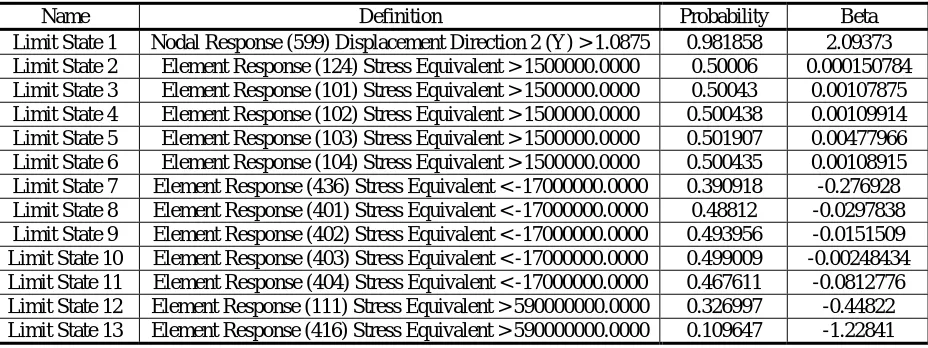
Table 3. Results related to each Limit State
Name Definition Probability Beta
Limit State 1 Nodal Response (599) Displacement Direction 2 (Y) > 1.0875 0.981858 2.09373 Limit State 2 Element Response (124) Stress Equivalent > 1500000.0000 0.50006 0.000150784 Limit State 3 Element Response (101) Stress Equivalent > 1500000.0000 0.50043 0.00107875 Limit State 4 Element Response (102) Stress Equivalent > 1500000.0000 0.500438 0.00109914 Limit State 5 Element Response (103) Stress Equivalent > 1500000.0000 0.501907 0.00477966 Limit State 6 Element Response (104) Stress Equivalent > 1500000.0000 0.500435 0.00108915 Limit State 7 Element Response (436) Stress Equivalent < -17000000.0000 0.390918 -0.276928 Limit State 8 Element Response (401) Stress Equivalent < -17000000.0000 0.48812 -0.0297838 Limit State 9 Element Response (402) Stress Equivalent < -17000000.0000 0.493956 -0.0151509 Limit State 10 Element Response (403) Stress Equivalent < -17000000.0000 0.499009 -0.00248434 Limit State 11 Element Response (404) Stress Equivalent < -17000000.0000 0.467611 -0.0812776 Limit State 12 Element Response (111) Stress Equivalent > 590000000.0000 0.326997 -0.44822 Limit State 13 Element Response (416) Stress Equivalent > 590000000.0000 0.109647 -1.22841
Table 4. Data of the System Event
Name Probability Beta
Limit State 2 & Limit State 3 & Limit State 4 & Limit State 5 & Limit State 6 0.01299 -2.22695 Limit State 7 & Limit State 8 & Limit State 9 & Limit State 10 & Limit State 11 0.01261 -2.23846
The calculated probability of ‘Limit State 1’ is 0.982. This limit state probability indicates that contact between the whipping GDH and the adjacent wall will occur with probability of 0.982.
For the adjacent impacted-wall (element 124), the calculated probability of ‘Limit States 2, 3, 4, 5 and 6’ is from 0.50001 to 0.502 (Table 3). This indicates that the ultimate tensile strength of concrete will be reached at the five integration points and cracking in these layers may occur. The probability for a through crack in the concrete wall was calculated using System Event 1, which determines, for the same computer run, if cracking occurs in all the layers of the concrete element. The calculated probability of ‘System Event 1’ is 0.013 (Table 4). Thus, the probability for a through crack to develop is 0.013.
For the support-wall (element 436), the calculated probability for ‘Limit states 7, 8, 9, 10 and 11’ is from 0.391 to 0.499 (Table 3). These limit states indicate that the ultimate compressive strength of concrete will be reached at the five integration points and failure may occur. The system event was used for the analysis of probability of failure during the same computer run at all integration points of the concrete element. The calculated probability of ‘System Event 2’ is 0.0126 (Table 4). Thus, the ultimate compressive strength of concrete will be reached with a probability 0.0126, and the support-wall may fail at the location where the GDH is attached with a probability 0.0126.
For the impacted wall (element 111), the probability for ‘Limit State 12” to be reached was 0.327. This limit state indicates that the ultimate stress of the rebars in the first rebar layer will be reached and the bars may fail. For the support-wall (element 416), the probability for ‘Limit State 13” to be reached was 0.11. This limit state indicates that the ultimate stress of the rebars in first rebar layer will be reached with a probability 0.11 and this layer may fail.
Probabilistic Analysis Using RS/MCS Method
The load of the guillotine break is uncertain, and it is widely accepted that to determine the loading from a guillotine break experiment is very difficult. Therefore, it is important to estimate the probability of failure of the impacted neighbouring wall due to the magnitude of the transverse load applied to the GDH. The RS/MCS method was used to express failure probability as a function of the loading and to investigate the dependence between impact load and failure probability.
In the first part of the RS/MCS analysis, the Response Surface (RS) method was used to obtain dependence functions between the response variables and the input random variables. The number of RS simulations performed was 100. In the second part of the RS/MCS analysis, the Monte Carlo Simulation method was used to determine the probability of failure based upon these dependence functions. The number of MC simulations performed was 1,000,000.
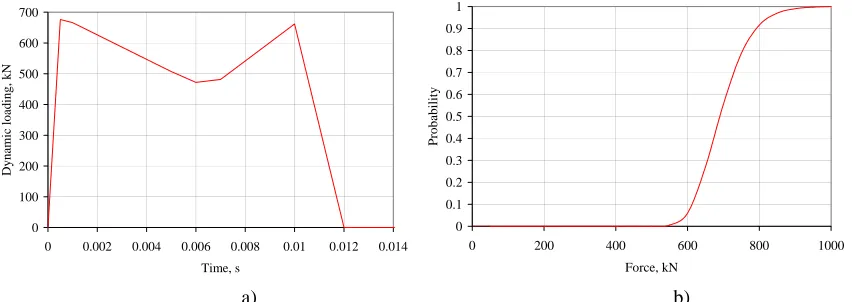
analysis. The RS/MCS method in ProFES could not handle all the random variables related to the critical loading points (Fig. 3, a). So the loading was defined to be a constant value of 338290 N in the range from 0.00 s up to 0.012 s and zero thereafter. The load value 338290 N is a half of the maximum load value (676580 N). The uniform distribution was used for loadings in RS part of the RS/MCS analysis. The distribution range of loading was from 0 N to the maximum loading of 676580 N.
In the RS/MCS analysis the same mechanical properties and geometrical parameters identified above as being important for the strength of structures were selected as random variables. The logarithmic normal distribution of material properties and geometry parameters were used for this analysis. The same limit states were also used in the RS/MCS analysis as those limit states used in the MCS and the FORM analysis.
Using the Response Surface method, the dependence functions between Response Variables and Input random variables were calculated. In the second part of the RS/MCS analysis, which is the Monte Carlo method, these functions were used to determine the failure probability.
The probability to reach the ultimate strength for compression of concrete in the support-wall as a function of the applied loads is presented here. As an example, the following equation was obtained from the RS analysis for the determination of the failure probability in relation to Limit State 7 (Table 3) - “Element Response (436 is the element number (first integration point) – Fig. 1)) Stress Equivalent > -1.7e+7”:
y=1.04735e+007+ 7.15074*L1+ 1.48883*L1+ 2.04335e+006*P1+ 0.00034832*Y1+
9.06781e+007*u1+ 0.0222667*r1+ 1.85264e+006*P4+ 0.000158399*Y4+ 7.98442e+006*u4+
-2.10484e-007*Y7+ 1.02299e+009*t7+ -1.53013e+007*m7 (1)
where the response variable y is used in limit state: y > -1.7e+7; L1 – LoadUnit 1-1 and LoadUnit 1-3; P1 - Poisson's ratio of wall 1 (Fig. 1), Y1 - Young's modulus of wall 1, u1 – Uniaxial tensile strength of wall 1, r1 – Yield stress of reinforcement bar in wall 1, P4 - Poisson's ratio of wall 4, Y4 - Young's modulus of wall 4, u4 – Uniaxial tensile strength of wall 1, Y7 - Young's modulus of pipe 7, t7– thickness of pipe 7, m7 - mid-surface radius of pipe 7.
L1 - LoadUnit 1-1 and Load 1-3 are loading points at different times, i.e. LoadUnit 1-1 at 0 second, LoadUnit 1-3 – at the time when the whipping GDH moves outside of the diameter of the GDH end cap (0.012 second). The random variables included in this equation are explained in the section above entitled ‘Probabilistic analysis using MCS method’.
The dependence function, Eq. (1), which was obtained using the RS method, was applied as an internal response functions in the MCS analysis. The number of MCS simulations was 1,000,000. In Eq. (1) the loads L1 and L3 were assumed equal. They were changed step-by-step while the probability of limit state have been changing from 0 to 1. The normal distribution with Coefficient of Variation equal 0.1 (10%) for loading and the logarithmic normal distribution of material properties and geometry parameters was used in this analysis. In Eq. (1), the nominal values of material properties and geometry parameters were the same as used in other analysis.
The analysis results are presented in Fig. 3, b. According to these result the relation between the probability of the ‘Limit State 7’ and the applied loads was determined. The compressive strength limit of concrete element 436 is first reached at a loading approximately equal to 550 kN, and the concrete failure probability reaches 1 at a load of approximately 950 kN. Note, the probability of failure at a load of 677 kN is about 0.4, which is good agreement with the results from the FORM analysis.
0 100 200 300 400 500 600 700
0 0.002 0.004 0.006 0.008 0.01 0.012 0.014
Time, s
Dynamic loading, kN
0 0.1 0.2 0.3 0.4 0.5 0.6 0.7 0.8 0.9 1
0 200 400 600 800 1000
Force, kN
P
robability
a) b)
SUMMARY
A probabilistic analysis of a GDH guillotine break and the damage consequences resulting from the failed GDH impacting against a neighbouring wall was carried out. The NEPTUNE software system was used for the deterministic transient analysis of a GDH guillotine break. Many deterministic analyses were performed using different values of the random variables that were specified by ProFES. All the deterministic results were transferred to the ProFES software system, which then performed probabilistic analyses of piping failure and wall damage.
The MCS method was used to study the sensitivity of the response variables and the effect of uncertainties of material properties and geometry parameters to the probability of limit states. The FORM method was used to study the probability of failure of the impacted-wall and the support-wall. The RS/MCS method was used in order to express failure probability as function and to investigate the dependence between impact load and failure probability.
The results of the probability analyses for a whipping GDH impacting onto an adjacent wall show that:
• There is a 0.982 probability that after a GDH guillotine break contact between GDH and wall will occur;
• There is a probability of 0.013 that the ultimate tensile strength of concrete at the impact location will be reached, and a through-crack may open;
• There is a probability of 0.0126 that the ultimate compressive strength of concrete at the GDH support location will be reached, and the concrete may fail;
• At the impact location in the adjacent wall, there is a probability of 0.327 that the ultimate tensile strength of the rebars in the first layer will be reached and the rebars will fail;
• At the GDH support location, there is a probability of 0.11 that the ultimate stress of the rebars in the first layer will be reached and the rebars will fail.
It can be concluded that after a GDH guillotine break, the GDH reinforced concrete support-wall and the impacted wall will develop a through-crack or crush with a probability ~0.013. Only the first layer of rebars, however, will fail in either the impacted-wall or the support-wall with probabilities of 0.327 and 0.11, respectively.
ACKNOWLEDGMENTS
This work was supported by the U.S. Department of Energy, National Nuclear Security Administration. The authors from LEI would like to acknowledge the support and access to the newest NEPTUNE software provided by the US DOE and ANL. The authors also want to extend thanks to the administration and technical staff at the Ignalina NPP, for providing information regarding operational procedures and operational data.
The U.S. Government makes no endorsement of the results of this work.
REFERENCES
1. Almenas K., Kaliatka A., and Uspuras E., Ignalina RBMK-1500, A Source Book, Extended and Updated Version, Lithuanian Energy Institute, Kaunas, Lithuania, 1998.
2. Dundulis G., Kulak R., Marchertas A., Narvydas E., Petry M., Uspuras E., “Evaluation of Pipe Whip Impacts on Neighboring Piping and Walls of the Ignalina Nuclear Power Plant”, Proc. of ICONE10 (CD version), 9 pp, Arlington, Virginia, USA April 14-18, 2002.
3 Kulak R.F. and Fiala C., “Neptune a System of Finite Element Programs for Three Dimensional Nonlinear Analysis”, Nuclear Engineering and Design, 106, 1988, pp. 47-68.
4 Cesare M. A. and Sues R. H., “PROFES Probabilistic Finite Element System – Bringing Probabilistic Mechanics to the Desktop”, American Institute of Aeronautics and Astronautics, AIAA 99-1607, 1999, pp. 1-11.
5 Kulak, R. F. and Marchertas, P., “Development of a Finite Element Based Probabilistic Analysis Tool, Transaction
17th International Conference on Structural Mechanics in Reactor Technology, Prague, Czech Republic, August
17-22, 2003 (CD-ROM), Paper B215.
6 Belytschko T., Lin J.I., and Tsay C.S., “Explicit Algorithms for Nonlinear Dynamics of Shells”,
Computer Methods
in Applied Mechanics and Engineering, 42, 1984, pp. 225-251
7 Hsin Yu Low, Hong Hao, “Reliability analysis of reinforced concrete slabs under explosive loading”, Structural Safety 23, 2001 pp.157-178,.
8 Braverman J. I., Miller C.A., Ellingwood B. R., Naus D. J., Hofmayer C. H., Bezler P. and Chang T. Y., “Structural Performance of Degraded Reinforced Concrete Members”, Proc. of SMiRT 16, (CD-ROM version) 8 pp., Washington, USA, August 12-17, 2001
9 Cruse T. A., Reliability-Based Mechanical Design, Mechanical Engineering, Marcel Dekker, Inc., New York, 1997.