18th International Conference on Structural Mechanics in Reactor Technology (SMiRT 18) Beijing, China, August 7-12, 2005 SMiRT18-K12-6
RESEARCH AND DEVELOPMENT OF THREE DIMENSIONAL
MEASUREMENT TECHNIQUE FOR SHAKE TABLE TEST USING
IMAGE PROCESSING
Satoshi FUJITA
Dept. of Mech. Eng., Tokyo Denki
University, 2-2, Kanda-Nisiki-cho,
Chiyoda-ku, Tokyo 101-8457, JAPAN
+81-3-5280-3372/3568
[email protected]
Osamu FURUYA
Dept. of Mech. Eng., Tokyo Metropolitan
College of Tech., 1-10-40, Higashi-Ohi,
Shinagawa-ku, Tokyo 140-0011, JAPAN
+81-3-3471-6331/6338
[email protected]
Yasushi NIITSU
School of information environment, Tokyo
Denki University, 2-1200
Muzai-Gakuendai, Inzai, Chiba,
270-1382, JAPAN
+81-476-46-8769/8779,
[email protected]
Tadashi MIKOSHIBA
National Research Institute for, Disaster
Prevention Research Division
3-1, Tennoudai, Tsukuba-shi 305-0006,
JAPAN
+81-298-51-1611/52-8512
[email protected]
ABSTRACT
In recent years, the importance of the fracturing test using the full-scale model is recognized in order to upgrade an earthquake resistant design. It is, moreover, important to develop a new measurement technique which can measure complex three-dimensional behaviour in such fracturing test. This study has been doing research and development of new three-dimensional measurement technique using image processing technique for a measurement of dynamic displacement caused by the fracturing process in shake table test without any contact. This measurement system is a very convenient system because it can measure the three-dimensional dynamic displacement in the simple experimental condition that the several makers are only attached to the surface of an experimental structure. The system therefore is the most suitable measurement system for an evaluation of complex three-dimensional behavior of test model. This measurement system will measure the fracturing process of the real scale structures of bridges, buildings, tanks, electric power facilities, soils, underground structure and so on. Fundamental hardware and software for the measurement system has been constructed until now. The fundamental dynamic measurement accuracy and effectiveness of the measurement system has been also confirmed from several shake table tests. This paper describes the measurement performance in actual fracturing test. The full scale wooden houses were used for the shake table test.
Keywords: Three dimensional measurement, Image processing, Non-contact, Real scale, Shake table test
1. INTRODUCTION
taken place for long years. However, we sometimes find difficulties in validating seismic resistant design capabilities of the real structures especially in the case of clarifying the fracturing process of them because the limitations regarding the size of test structures and the table capacity exist definitely. National Research Institute for Earth Science and Disaster Prevention constructed the largest three-dimensional shake table in Miki, Hyogo prefecture to evaluate fracturing mechanism and process of many types of structures such as bridges, buildings, containment vessels, electric power facilities, soils, foundations and underground structures of the full scale.
In this study, the research and development of 3-dimensional measurement method of non-contact type is now being carried out for establishing a suitable system to measure the structural fracturing process accurately during the shake table tests using the real scale model[1]. This paper describes the measurement performance in actual fracturing test. Two types of full scale wooden house were used for the shake table test. One is the two-storey house model which is a Japanese conventional model. The other is the relocated model using the mortar wall from the existing house which was constructed 26 years ago.
2. MEASUREMENT METHOD
2.1 Outline of measurement method
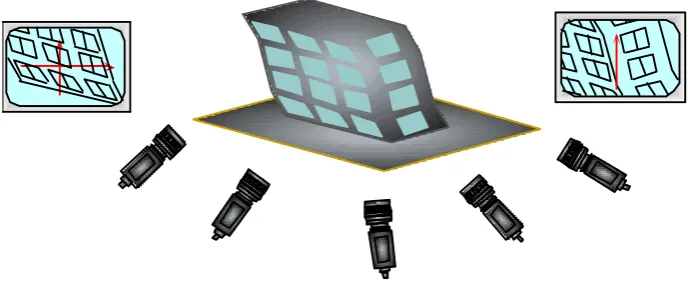
The concept of measurement method proposed in this study is a three-dimensional measurement method of non-contact type using image processing based on stereo method, which is widely recognised as so-called motion-capture technique and the schematic image of the shake table test using this system is shown in Fig. 1. Basic ideas of several methods regarding this technology have already been established and they are roughly divided into passive and active measurement method and the proposed system is categorised in passive one. In addition to the basic functions of the system, the desired measurement method suitable for seismic testing is being examined to fulfill the following design requirements.
1) To measure large displacement in excess of elastic deformation in real scale model 2) To measure 3-dimensional structural deflexion
3) To measure structure without any direct contacts
4) To measure structural motion in at least cm order precision till collapse 5) No special environment for measurement is required
6) To capture data at 5ms resolution for continuous 60 seconds
The measuring procedure of this system is roughly described as follows:
Multiple markers ( measuring targets ) are utilised on the surfaces of real-scale structure and the motion of the markers are captured by the several CCD cameras placed in surrounding area of the shake table. The dynamic displacements of the markers (structure) are calculated from camera image data.
Although this method is based on a simple theory of measurement, it is a very convenient system which only requires to install the markers on the object structure and it can be considered as the most suitable measurement system to evaluate the complex 3-dimensional behaviour of real scale structure.
Figure 1 Image view of shake table test using proposed system
2.2 Theory of measurement method
obtained from 2-dimensional camera image data. Therefore, the coordinate transformation from 2-dimensional camera image coordinate system to 3-dimensional object coordinate system is required in the procedure. The coordinate transformation is carried out by using the transformation matrix which is called 'camera parameter'[2], [3]. It is fundamentally possible to express the 2-dimensional camera image in 3-dimensional object information by using 3-dimensional affine transformation in the case that the object is captured in an optional camera direction and from an optional position. When the test object is measured by using one camera unit, the relation between the object coordinate system (x,y,z) and the camera image coordinate system (XC,YC) is
obtained from affine transformation equation including the transfer and the rotation, and from the direct view conversion formula in the homogeneous coordinate style as follows.
[HcXc,HcYc,1]=[x,y,z,1]
C11 C21 C31
C12 C22 C32
C13 C23 C33
C14 C24 C34 ⎡ ⎣ ⎢ ⎢ ⎢ ⎢ ⎤ ⎦ ⎥ ⎥ ⎥ ⎥ (1)
Matrix [Cij] in above equation is called as the camera parameter. By eliminating HC from above equation, next
two equations can be established.
C11x+C12y+C13z+C14−C31xXc−C32yXc−C33zXc=C34Xc
C21x+C22y+C23z+C24−C31xYc−C32yYc−C33zYc=C34Yc ⎫ ⎬
⎭ (2)
Since the two equations are formed from one maker, if six or more than six makers are installed in the object, the camera parameter in the right side of Eq. (1) comprising twelve unknown factors can be obtained. Generally, the following equation is established for n point markers when n is in excess of six.
AC=R (3)
where,
A=
[
A1 A2 A3]
, C=[
C11 C12 C13 C32 C33]
T
, R=
[
Xc1 Yc1 Xcn Ycn]
T
Besides,
A1=
x1 y1 z1
0 0 0
xn yn zn
0 0 0
⎡ ⎣ ⎢ ⎢ ⎢ ⎢ ⎢ ⎢ ⎤ ⎦ ⎥ ⎥ ⎥ ⎥ ⎥ ⎥
, A2=
0 0 0
x1 y1 z1
0 0 0
xn yn zn ⎡ ⎣ ⎢ ⎢ ⎢ ⎢ ⎢ ⎢ ⎤ ⎦ ⎥ ⎥ ⎥ ⎥ ⎥ ⎥
, A3=
−x1Xc1 −y1Xc1 −z1Xc1 −x1Yc1 −y1Yc1 −z1Yc1
−xnXcn −ynXcn −znXcn −xnYcn −ynYcn −znYcn ⎡ ⎣ ⎢ ⎢ ⎢ ⎢ ⎢ ⎢ ⎤ ⎦ ⎥ ⎥ ⎥ ⎥ ⎥ ⎥
Then the camera parameter is finally going to be obtained from the following equation by using the least square method.
ATAC=ATR
(4)
It is possible to transform each coordinate system by using Eq. (3), so long as camera position and direction do not change during the measurement process.
C111 −C311Xc111 C121 −C321 Xc111 C131 −C331 Xc111
C211 −C 31 1Yc
11
1 C
22 1 −C
32 1Yc
11
1 C
23 1 −C
33 1Yc
11 1
C11n −C
31
nXc
11
n C
12
n −C
32
nXc
11
n C
13
n −C
33
nXc
11
n
C11n −C31nYc11n C12n −C32nYc11n C13n −C33nYc11n ⎡ ⎣ ⎢ ⎢ ⎢ ⎢ ⎢ ⎢ ⎤ ⎦ ⎥ ⎥ ⎥ ⎥ ⎥ ⎥ x y z ⎡ ⎣ ⎢ ⎢ ⎢ ⎤ ⎦ ⎥ ⎥ ⎥ =
Xc111 −C141
Yc111 −C 24 1
Xcnn1−C
14
n
Ycnn1−C24n ⎡ ⎣ ⎢ ⎢ ⎢ ⎢ ⎢ ⎢ ⎤ ⎦ ⎥ ⎥ ⎥ ⎥ ⎥ ⎥ (5)
By obtaining x,y,z from above equation, the 3-dimensional coordinate of the object can be deribved from the two-dimensional camera image coordinate.
3. MEASUREMENT SYSTEM FOR THREE-DIMENSIONAL DYNAMIC DISPLACEMENT USING IMAGE PROCESSING
3.1CCD camera used for test
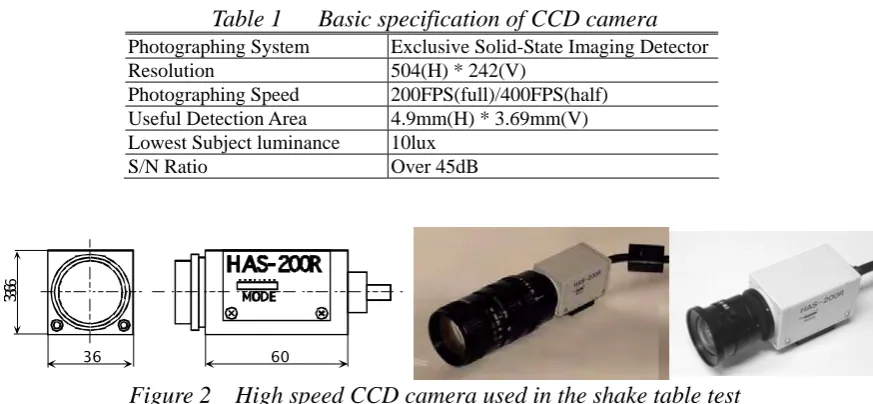
Figure 2 show a CCD camera unit used in the shake table test to evaluate the effectiveness of the measurement method proposed in this study. It is desirable that the dynamic displacement of the structure is measured at the adequately high sampling frequency to capture the fracturing process of the structure during earthquake with the highest accuracy. The basic specification of the CCD camera is shown in Table 1. The camera can take 200 frame per second in order to satisfy the requirements described before and the higher speed photographing is also possible in 400 frame per second if the camera images are reduced to the half size. The resolution of camera has 504(H)×242(V). Moreover, the small size and the light weight of the camera make it to be easily installed in any place. The lowest subject illuminance is 10LUX and it is also suitable for the measurement under the experimental environment without high-lighting.
Table 1 Basic specification of CCD camera
Photographing System Exclusive Solid-State Imaging Detector Resolution 504(H) * 242(V)Photographing Speed 200FPS(full)/400FPS(half) Useful Detection Area 4.9mm(H) * 3.69mm(V) Lowest Subject luminance 10lux
S/N Ratio Over 45dB
36
36
60
Figure 2 High speed CCD camera used in the shake table test
3.2 Marker
57
57
54
Figure 3 Two kinds of marker used for the shake table test
3.3 Marker recognition method on 2D camera image
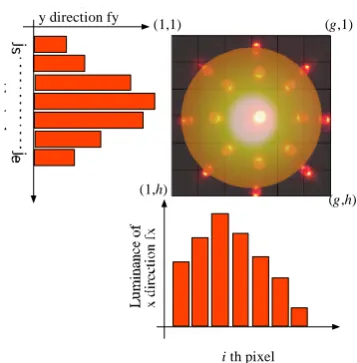
In this study, the marker on the camera image with the resolution of the k×m pixels is recognized by the following method. First, the luminance of the whole image is obtained from the image information, and referring to this luminance, the optional threshold is set. Next, the image having the luminance over the optional threshold is searched. Fundamentally, the marker used in this study is not a point light source as shown in Fig.4, and it was designed to have resultant spread light area of some pixels on the camera image. Therefore, the light source is blurred in the camera image and the luminance distribution of the pixels can be obtained from the g×h pixels which were recognized as the image of marker as shown in Fig.4. The luminance for the x direction, fx ,means the summation of the luminance, c, for the y direction on the ith pixel for the x direction. The luminance value, fx(i), on the ith pixel of x direction is expressed as
fx( )i = c i( ),p p=1
h
∑ (6)
then the luminance value fy(j) on the jth pixel of y direction is given by
fy( )j = c p( ),j p=1
g
∑ (7)
Next, the position of the marker on the g×h images is obtained using centre of gravity calculation method. The position for the x direction is given as
x=
fx( )ss s=is
ie ∑
fx( )s s=is
ie ∑
(8)
then the position in y direction is also given by
y=
fy( )ss s=js
je ∑
fy( )s s=js
ie ∑
(9)
Luminance of y direction fy
i th pixel (1,1)
(1,h)
(g,1)
(g,h)
Figure 4 Marker recognition method on 2D camera image
4. FRACTURING TEST USING WOODEN HOUSE MODEL 4.1 Measurement object of Wooden house model
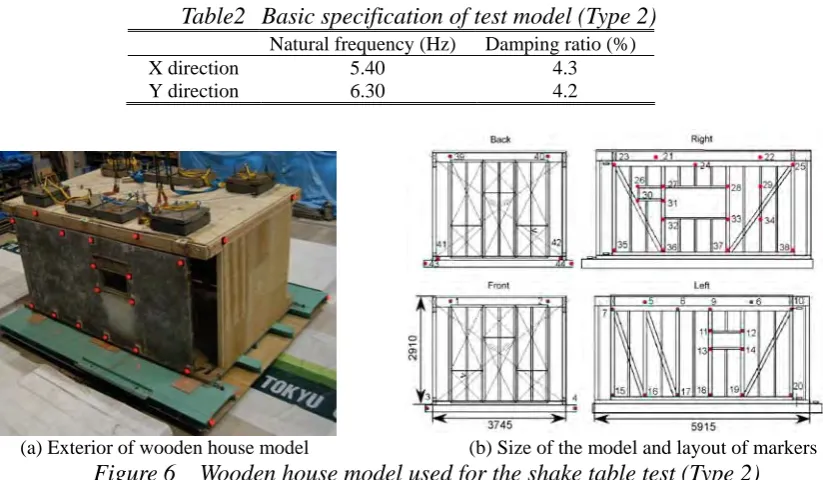
Figure 5 shows the full scale model of two-storywooden house used for the shake table test (Type1). The size of the test object is 3.640W[m] *5.450D[m] *5.820H[m]. Natural frequency and damping coefficient are shown in Table 2. This wooded house was modelled as a Japanese conventional wooden house under the old Japanese structural code for seismic safety. The strap bolt was used in the edge of the beam, and also the T shape metallic element was used in the top and the bottom part of the column for estimating the conventional wooden house based on 1979’s code. The total mass is 6400 [kg] including the additional mass in 1st and 2nd floor. Figure 6 shows the other type model used for the shake table test. This model has the wall structure plane for investigating a dynamic behavior and fracturing process of the existing wooden house (Type2). The walls were sampled from the north and south side of first floor of the existing house with secular change during 26 years. The other components of the model was made in the new wooden material. The size of the test object is 3.747W[m] *5.915D[m] *2.910H[m]. Natural frequency and damping coefficient are shown in Table 3.
Table 2 Basic specification of test model (Type 1)
Natural frequency (Hz) Damping ratio (%)X direction 2.49 1.8
Y direction 1.98 2.7
Table2
Basic specification of test model (Type 2)
Natural frequency (Hz) Damping ratio (%)X direction 5.40 4.3
Y direction 6.30 4.2
(a) Exterior of wooden house model (b) Size of the model and layout of markers
Figure 6 Wooden house model used for the shake table test (Type 2)
4.2 Measurement and experimental method
Figures 5(b) and 6(b) show the layout of markers on the test objects. In the two-story wooden house model shown in Fig.5(b), the each face of the object had six markers on the beams to measure the dynamic behavior in the first and second floors. Two markers were also placed in the front and back of the shake table. Therefore, twenty-eight markers were used for the test, on the other hand, there were forty-four markers including four markers on shake table in the model of Type 2 as shown in Fig.6(b). Especially, since the fracturing process of the Lath mortar wall, eighteen markers and sixteen markers were attached to the right and left face of the test object. The initial 3-dimensional positions of these markers were measured by the space instruments before the shake table tests for using the camera parameter matrix.
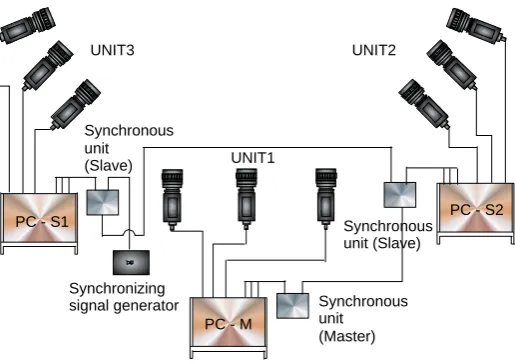
The nine CCD cameras were placed around the shake table as shown in Fig.7. Figure 8 shows the instrumental layout for measurement system. The distance between the camera and the origin of the object coordinate system, which was set to the corner of the shake table, was from about 6 [m] to 17 [m]. The combination of two CCD cameras basically captured the one face of the object. In the measurement, the infrared ray filter was installed to the camera lens to reduce the effect of the lighting in the facility and natural light from the windows.
PC - S1
PC - M
PC - S2 UNIT1
UNIT3 UNIT2
Synchronous unit (Slave)
Synchronous unit (Master) Synchronizing
signal generator
Synchronous unit (Slave)
Figure 8 Instrumental layout for measurement system
The shake table in Tokyu Construction laboratory was used for the test. The size of the table is 4 [m]*4 [m], and then this shake table can induce the seismic wave to the object in the three dimensions. In this test, the seismic wave, which was recorded in Takatori station at Kobe earthquake in 1995, was used as an input wave. Maximum accelerations in horizontal X and Y-direction are 741 and 624 [Gal], respectively.
The displacement in the shake table obtained from the information of shake table system, and also the displacement in between each story measured by the displacement transducer of reel type, were used for the accuracy evaluation of the measurement system using the image processing. Besides, the sampling frequency was set to 100 [Hz] in the test.
4.3 Measurement result
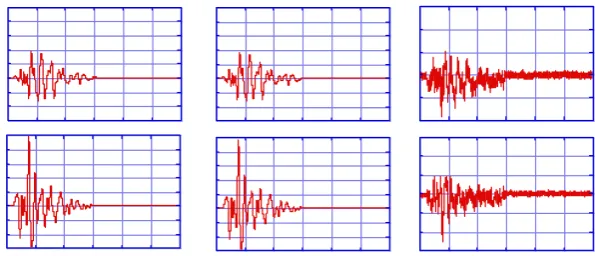
Figure 9 shows the measurement results of dynamic displacement in which the shake table was induced to the seismic wave in two horizontal directions. In these figures, the left column shows the measurement result obtained from the information of shake table system, which is the evaluation index for the image processing system. The middle column indicates the results of the No. 7 marker by using the image processing system. The right column means the difference between the monitored results of the shake table and of the image processing system. Moreover, the upper line shows the measurement results in the X-direction, and then the lower line shows the results in the Y-direction. Table 3 summarized the main results of the difference in between the both of the measurement results. It is confirmed that the measurement results captured by the image processing system agree well with the monitored results from the shake table. In the shake table test, the camera were placed in the distance from 6 [m] to 17 [m] against the origin of the coordinate system, and then the image processing system measured the instrumental space in about 14[m]*14[m]*6.5[m]. Although the resolutions of the camera became about 28[mm/pixel] in X-direction, 35[mm/pixel] in Y-direction and 27[mm/pixel] in Z-direction, respectively, it is indicated that the image processing system can measure the dynamic displacement of the shake table on the accuracy of the sub-pixel order.
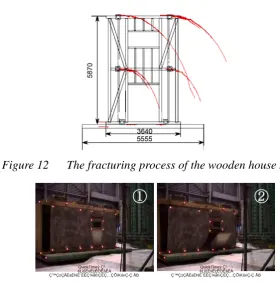
Figure 10 shows the fracturing process of the two-story wooden house model induced by the seismic wave. Figure 11 shows the time history of fracturing process at the time, and also the comparison with the dynamic displacement in the superstructure. These figures show the X, Y and Z-direction from the left column, and then the results of second story and first story in the upper and lower line are shown. Especially, the measured results of the first floor and the second floor in the lower line were indicated along with the measured results using the displacement transducer of wind type shown as a dotted line in the same figures. In this test, the wooden house model was collapsed. As shown in this figure, it was evaluated that the image processing system has an adequate performance to be able to measure the fracturing process of real scale structure, which is difficult to measure by using a conventional displacement transducer. Then, it is possible to express the fracturing process as shown in Fig.12 by using the captured results.
Figure 9 The comparison with the measurement results of the shake table
Table3 Measurement result of dynamic displacement in shake table on the test case using
Type1 model
Max. error [mm] RMS .error [mm] Max disp .error [mm]
X direction 28.4 3.65 6.31
Y direction 27.1 3.61 13.5
QuickTimeý Dz êLí£ÉvÉçÉOÉâÉÄ Ç™Ç±ÇÃÉsÉNÉ`ÉÉǾå©ÇÈÇ…ÇÕïKóvÇ-Ç ÅB
QuickTimeý Dz êLí£ÉvÉçÉOÉâÉÄ Ç™Ç±ÇÃÉsÉNÉ`ÉÉǾå©ÇÈÇ…ÇÕïKóvÇ-Ç ÅB
QuickTimeý Dz êLí£ÉvÉçÉOÉâÉÄ Ç™Ç±ÇÃÉsÉNÉ`ÉÉǾå©ÇÈÇ…ÇÕïKóvÇ-Ç ÅB
QuickTimeý Dz êLí£ÉvÉçÉOÉâÉÄ Ç™Ç±ÇÃÉsÉNÉ`ÉÉǾå©ÇÈÇ…ÇÕïKóvÇ-Ç ÅB
①
②
③
④
Figure 10 Fracturing process of two-story wooden house model
-1000 -500 0 500 1000
0 5 10 15
X Direction (Marker 6)
Time[s]
Disp.[mm]
-4000 -3000 -2000 -1000 0 1000
0 5 10 15
Z Direction (Marker 3)
-500 0 500 1000 1500
0 5 10 15
X Direction (Marker 3)
Disp.[mm]
-1000 0 1000 2000 3000
0 5 10 15
Y Direction (Marker 6)
Time[s]
-4000 -3000 -2000 -1000 0 1000
0 5 10 15
Z Direction (Marker 6) Time[s] -1000
0 1000 2000 3000 4000 5000
0 5 10 15
Y Direction (Marker 3)
Figure 12 The fracturing process of the wooden house model
QuickTimeý Dz êLí£ÉvÉçÉOÉâÉÄ Ç™Ç±ÇÃÉsÉNÉ`ÉÉǾå©ÇÈÇ…ÇÕïKóvÇ-Ç ÅB
QuickTimeý Dz êLí£ÉvÉçÉOÉâÉÄ Ç™Ç±ÇÃÉsÉNÉ`ÉÉǾå©ÇÈÇ…ÇÕïKóvÇ-Ç ÅB
①
②
③
④
Figure 13 Fracturing process of the mortar wall
500 1000 1500 2000 2500
0 5 10 15 20
Time[s] Z Direction (Marker 11) -1500
-1000 -500 0 500 1000
0 5 10 15 20
Time[s]
Disp.[mm]
X Direction (Marker 11) 2800 3000 3200 3400 3600 3800 4000
0 5 10 15 20
Time[s] Y Direction (Marker 11)
Figure 14 Time history of fracturing process of the mortar
5. CONCLUSIONS
AKNOWLEDGEMENTS
The work presented in this paper was carried out as a part of the study for Enhancement of Earthquake Performance of Infrastructures Based on Investigation Into Fracturing Process, and financially supported by Special Coordination Funds for Promoting Science and Technology (SCF), the Science and Technology Agency (STA), Japan. Moreover, the shake table test using the real scale wooden house model is being carried out under the Special Research Project of Earthquake Disaster Mitigation for Metropolis "Experimental study of wooden buildings". The authors wish to thank the members for their fruitful discussions. Special thanks are also given to Mr. Daisuke Nakano, Mr. Hiroki Mizuno and Mr. Hidetaka Hayashi, graduate students of Tokyo Denki University, for their help.
REFERENCES
[1] Fujita S., Furuya O., Niitsu Y., Mikoshiba T., Aikawa S., Fujimura S., 'Study on Measurement Method for Structural Fracturing and Breakdown Process in Shake Table Tests', PVP-Vo. 402-2 Seismic Engineering, pp. 225-230, July 2000.
[2] Fujita S., Furuya O., Niitsu Y., Mikoshiba T., Aikawa S., Study on Measurement Method for Structural Fracturing Process in Shake Table Tests using Image Processing ', PVP-Vo. 428-1 Seismic Engineering, pp. 167-172, July 2001.
[3] Fujita S., Furuya O., Niitsu Y., Mikoshiba T., Yamazaki H., Study on 3-D Measurement Method for Structural Dynamic Displacement in Shake Table Tests using Image Processing, PVP-Vo. 445-1 Seismic Engineering, pp.35-41, August 2002.
[4] Fujita S., Furuya O., Niitsu Y., Mikoshiba T., Nakano D., Study on 3-D Measurement Method using Image Processing Technique for Dynamic Displacement in Shake Table Tests, PVP-Vo. 466 Seismic Engineering, pp.1-7, July 2003