ABSTRACT
DOH, SONG JUN. A study on the effects of textile processing on tensile properties of single cotton fibers - From raw cotton to washed garments (Under the direction of Moon W. Suh.)
Effects of textile processing on breaking strength, breaking elongation, morphological properties and dimensional properties were investigated and analyzed. Cotton varieties were obtained from fields and processed under various ginning and carding conditions into a T-shirts. The produced T-shirts were washed and dried repeatedly. A large number of fibers were collected at various processing stages and tested one by one by a Mantis® single fiber tensile tester. During repeated washing/drying experiment, progressive shrinkage in length, width, and area were measured. The surface characteristics of fibers in yarns from washed T-shirts were observed by a scanning electron microscope. It was found that the breaking strength and breaking elongation of cotton fibers were reduced substantially due to textile processing. A higher ginning rate generated a higher average breaking strength and a lower breaking elongation compared to that from a lower ginning rate. However, based on the fibers taken from washed and unwashed T-shirts, the higher ginning rate was shown to have produced a lower average breaking strength as well as breaking elongation compared to the case at lower ginning rate.
A higher carding rate adversely affected the tensile properties for entire range of the processes. Using of 2 lint cleaners at the gin resulted in a lower tensile properties than that of 1 lint cleaner.
resulted in a lower average length shrinkage in T-shirts and more damage to the fiber surface after repeated washing/drying.
A STUDY ON THE EFFECTS OF TEXTILE PROCESSING ON
TENSILE PROPERTIES OF SINGLE COTTON FIBERS
- FROM RAW COTTON TO WASHED GARMENTS
by
SONG JUN DOH
A dissertation submitted to the Graduate Faculty of
North Carolina Stats University
in partial fulfillment of the
requirements for the Degree of
Doctor of Philosophy
FIBER AND POLYMER SCIENCE
Raleigh
2004
Approved By:
Bhupender S. Gupta
Pamela Banks-Lee
Jacqueline M. Hughes-Oliver
Moon W. Suh
DEDICATION
BIOGRAPHY
The author, SONG JUN DOH, the son of Moo-Hoe Doh and Young-Ah Kim, was born on December 21, 1974, in Seoul, Korea. He graduated from Young-Dong High School, Korea in February, 1993 and entered Seoul National University, Seoul in March, 1993. He received the Bachelor of Science degree in Textile Engineering in February, 1997. After receiving the Master of Science degree in Textile Engineering in February, 1999, under the direction of Dr. Sang Yong Kim, he came to the United States in May, 1999, to work towards the Ph. D degree in Fiber and Polymer Science at College of Textiles, North Carolina State University.
ACKNOWLEDGMENTS
The author would like to express his sincere appreciation and gratitude to Prof. Moon W. Suh, Chairman of his Advisory Committee, for his active guidance, advice, and encouragement through the course of this study.
The author also thank the other members of his Advisory Committee, Dr. B. S. Gupta of the Textile Engineering, Chemistry and Science Department, Dr. Pamela Banks-Lee of the Textile Technology Department, and Dr. Jacqueline Hughes-Oliver of the Statistics Department for their suggestions and encouragement.
The author expresses his gratitude to Cotton Incorporated and the staffs for sponsoring this research. Especially, he gives his sincere thanks to Mr. M. Watson, Mrs. N. Keyes, and their staff members.
Special thanks are also extended to the USDA Stoneville Laboratory, Clemson Laboratory, and [TC]2 facilitating the long-term experimental work for this study.
The author would also like to extend his thanks to other faculty and staff of the College of Textiles, and to his fellow graduate students for their assistance and kindness in completing his study.
TABLE OF CONTENTS
LIST OF FIGURES ... vii
LIST OF TABLES ... x
1 INTRODUCTION ... 1
2 LITERATURE REVIEW ... 3
2.1 Effects of Ginning and Carding on Cotton Fiber Properties... 4
2.1.1 Quantification of Cotton Quality Changes in Terms of Fiber Processing Propensity ... 4
2.1.2 Quantification of Cotton Quality Changes in Terms of Short Fiber Content and Fiber Length Characteristics... 6
2.2 Effects of Structural Characteristics of Cotton Fibers on Tensile Properties ... 7
2.2.1 Fibrillar Structure of Cotton Fiber... 7
2.2.2 Inner and Outer Fibrillar Layers... 10
2.3 Relationships Between Fiber Properties and Yarn Properties ... 12
2.4 Changes of Various Properties of Cotton After Laundering ... 15
2.4.1 Morphology Characteristics of Cotton Fibers After Laundering ... 15
2.4.2 Changes of Dimensional Properties of Cotton Fabrics After Laundering. 16 3 RESEARCH OBJECTIVES... 18
4 EXPERIMENTS... 19
4.1 Sing Fiber Tensile Test by Mantis®... 20
4.2 Hand-picked and Hand-ginned Cotton ... 20
4.3 Spindle-harvested and Conventional Ginning Process ... 21
4.4 Experimental Design for Ginning and Carding Effects – Based on Card Slivers .. ... 21
4.5 Drawing, Spinning and Knitting ... 23
4.6 Garment Manufacturing... 24
4.7 Repeated Washing and Drying of T-shirts... 24
4.7.1 Apparatus and Materials... 24
4.7.2 Specimens... 25
4.7.3 Test Procedure ... 25
4.7.4 Measurements... 26
4.7.5 Calculation and Interpretation ... 27
4.8 Microscopic Observation ... 29
4.8.1 Apparatus... 29
4.8.2 Materials ... 29
5 RESULTS AND DISCUSSIONS... 30
5.1.1 Effects of Ginning Rates on Tensile Properties of Ginned Cotton Fibers. 31 5.1.2 Comparison of the Tensile Properties for Hand-ginned Cotton and
Machine-ginned Cotton ... 39
5.1.3 Hand-picked and Hand-ginned Cottons ... 40
5.2 Effects of Textile Processing on the Tensile Properties of Single Fibers: Sequential Property Changes from Card Slivers, Unwashed, and Washed shirts... 49
5.3 Study on the Tensile Properties of Cotton Fibers at Each Processing Stages .... 59
5.3.1 After Carding... 59
5.3.1.1 Effects of Process Parameters on the Tensile Properties of STV 747 Cotton Fibers 60 5.3.1.2 Effects of Process Parameters on the Tensile Properties of DPL 33B Cotton Fibers 63 5.3.1.3 Summary 66 5.3.2 Before Repeated Washing and Drying of Garments ... 66
5.3.3 After Repeated Washing and Drying of Garments... 75
5.4 Possible Model for Strength of Cotton Fibers ... 83
5.4.1 Structural Characteristics and Mechanical Properties of Cotton Fiber ... 83
5.4.2 Fibrillar Layers in a Cotton Fiber and Their Tensile Behaviors... 83
5.4.3 Results and Discussion: Interpretation of the Results in Terms of Inner-outer Fibrils Theory ... 85
5.5 Relationships Between Single Fiber Tensile Properties and the Amount of Shrinkage of T-shirts after Repeated Washing/Drying... 89
5.6 Study of Fiber Morphology by a Scanning Electron Microscope ... 102
5.6.1 Results and Discussion ... 103
6 CONCLUSIONS... 108
7 RECOMMENDATIONS FOR FUTURE WORK ... 110
8 REFERENCES ... 111
LIST OF FIGURES
Figure 1. (a) Model of Cotton Fiber as an Assembly of Fibrils Following Helical Paths.
(b) Path of a Single Fibril. (c) "Opened-out" Diagram. ...9
Figure 2. Measurements in a T-shirt ...26
Figure 3. Distributions of Breaking Elongation of Ginned Cottons for Different Ginning Rates (No. of test: 4800) ...33
Figure 4. Distributions of Breaking Strength of Ginned Cottons for Different Ginning Rates (No. of test: 4800) ...34
Figure 5. Scatter Plot of Breaking Strength vs. Breaking Elongation of Single Fibers: High Ginning Rate vs. Normal Ginning Rate (No. of test: 3200)...36
Figure 6. Scatter Plot of Breaking Strength vs. Breaking Elongation of Single Fibers: High Ginning Rate vs. Low Ginning Rate (No. of test: 3200) ...37
Figure 7. Scatter Plot of Breaking Strength vs. Breaking Elongation of Single Fibers: Normal Ginning Rate vs. Low Ginning Rate (No. of test: 3200) ...38
Figure 8. Histogram of Single Fiber Strength for STV 747 (No. of test: 4400)...43
Figure 9. Histogram of Single Fiber Strength for DPL 33B (No. of test: 4800) ...44
Figure 10. Histogram of Single Fiber Strength for STV 4892 (No. of test: 4400) ...45
Figure 11. Histogram of Single Fiber Elongation for STV 747 (No. of test: 4400)...46
Figure 12. Histogram of Single Fiber Elongation for DPL 33B (No. of test: 4800) ...47
Figure 13. Histogram of Single Fiber Elongation for STV 4892 (No. of test: 4400)....48
Figure 14. Average Single Fiber Breaking Strength (Elongation)* at Various Processing Stages - High Ginning, 1 Lint Cleaner, and High Carding Rate (No. of test: 21200) ...52
Figure 15. Average Single Fiber Breaking Strength vs. Ginning Rates ...53
Figure 16. Average Single Fiber Breaking Strength vs. Number of Lint Cleaners ...54
Figure 17. Average Single Fiber Breaking Strength vs. Carding Rates ...55
Figure 18. Average Single Fiber Breaking Elongation vs. Ginning Rates ...56
Figure 19. Average Single Fiber Breaking Elongation vs. Number of Lint Cleaners (No. of test: 80727) ...57
Figure 20. Average Single Fiber Breaking Elongation vs. Carding Rates ...58
Figure 22. Fiber Elongation of STV 747 Card Slivers vs. Ginning Rates, No. of Lint
Cleaner, and Carding Rates...62
Figure 23. Fiber Strength of DPL 33B Card Slivers vs. Ginning Rates, No. of Lint Cleaner, and Carding Rates...64
Figure 24. Fiber Elongation of DPL 33B Card Slivers vs. Ginning Rates, No. of Lint Cleaner, and Carding Rates...65
Figure 25. Fiber Strength of STV 747 Unwashed T-shirts vs. Ginning Rates, No. of Lint Cleaner, and Carding Rates...68
Figure 26. Fiber Elongation of STV 747 Unwashed T-shirts vs. Ginning Rates, No. of Lint Cleaner, and Carding Rates ...69
Figure 27. Fiber Strength of STV 747 Washed T-shirts vs. Ginning Rates, No. of Lint Cleaner, and Carding Rates...78
Figure 28. Fiber Elongation of STV 747 Washed T-shirts vs. Ginning Rates, No. of Lint Cleaner, and Carding Rates...79
Figure 29. Theoretical Tensile Response of Cotton Fibers; (a) Before Ginning; (b) After Low Ginning; (c) After High Ginning ...88
Figure 30. Length Shrinkage (%) after 32 W/D cycles for STV 747 T-shirts...91
Figure 31. Length Shrinkage (%) after 32 W/D cycles for DPL 33B T-shirts ...92
Figure 32. Width Shrinkage (%) after 32 W/D cycles for STV 747 T-shirts ...93
Figure 33. Width Shrinkage (%) after 32 W/D cycles for DPL 33B T-shirts ...94
Figure 34. Fibers on the Surface of T-shirt with Low Shrinkage (× 300) ...105
Figure 35. Fibers on the Surface of T-shirt with Low Shrinkage (× 1500) ...105
Figure 36. Fiber on the Surface of T-shirt with Medium Shrinkage (× 1500)...106
Figure 37. Fibers on the Surface of T-shirt with Medium Shrinkage (× 3000) ...106
Figure 38. Fibers on the Surface of T-shirt with High Shrinkage (× 1500)...107
Figure 39. Fibers on the Surface of T-shirt with High Shrinkage (× 1500)...107
Figure 40. Theoretical Load-Extension Curve - Case I: the Maximum Strength Realized at the Breaking Extension of Inner Fibrils ...116
Figure 41. Theoretical Load-Extension Curve - Case II: the Maximum Strength Realized at the Breaking Extension of Outer Fibrils ...117
Figure 42. Load-Extension Curve for Cotton Fiber: Volume Ratio of Inner and Outer Fibril = 10:90...121
Figure 44. Load-Extension Curve for Cotton Fiber: Volume Ratio of Inner and Outer Fibril = 30:70...123 Figure 45. Load-Extension Curve for Cotton Fiber: Volume Ratio of Inner and Outer
LIST OF TABLES
Table 1. Experimental Design for Producing Samples – Card Slivers ...23
Table 2. Washing and Drying Conditions...28
Table 3. Washing Machine Setting Conditions without Load...28
Table 4. Dryer Setting Conditions ...28
Table 5. Summary Statistics of Tensile Properties of Ginned Cotton Fibers Processed with Three Ginning Rates (No. of Sample Tested: 4800)...31
Table 6. Summary Statistics for Single Fiber Tensile Properties - Obtained at Three Different Ginning Rates and from Hand-ginned Cotton...40
Table 7. Summary Statistics of Tensile Properties of DPL 33B Hand-ginned Cotton (No. of sample tested: 4400) ...41
Table 8. Summary Statistics of Tensile Properties of STV 747 Hand-ginned Cotton Fibers (No. of sample tested: 4400) ...41
Table 9. Summary Statistics of Tensile Properties of STV 4892 Hand-ginned Cotton Fibers (No. of sample tested: 4400) ...42
Table 10. ANOVA for Processing Effects on Breaking Strength of Single Fibers from Various Unwashed T-shirts...70
Table 11. ANOVA for Processing Effects on Breaking Elongation of Single Fibers from Various Unwashed T-shirts ...71
Table 12. Summary Statistics for Tensile Properties of Single Fibers Undergone Various Ginning and Carding Conditions - Unraveled from Unwashed T-shirts ...72
Table 13. Summary Statistics for Tensile Properties of Fibers Unraveled from Unwashed T-shirts in Terms of Ginning Rate ...74
Table 14. Summary Statistics for Tensile Properties of Fibers Unraveled from Unwashed T-shirts in Terms of No. of Lint Cleaners ...74
Table 15. Summary Statistics for Tensile Properties of Fibers Unraveled from Unwashed T-shirts in Terms of Carding Rate...74
Table 16. Summary Statistics for Tensile Properties of Single Fibers Undergone Various Ginning and Carding Conditions - Unraveled from Washed T-shirts ...76
Table 17. ANOVA for Processing Effects on Breaking Strength of Single Fibers from Various T-shirts Undergone 32 Repeated W/D ...80
Table 18. ANOVA for Processing Effects on Breaking Elongation of Single Fibers from Various T-shirts Undergone 32 Repeated W/D ...81
Table 20. Summary Statistics for Tensile Properties of Fibers Unraveled from Washed T-shirts in Terms of No. of Lint Cleaners ...82 Table 21. Summary Statistics for Tensile Properties of Fibers Unraveled from
Washed T-shirts in Terms of Carding Rate...82 Table 22. Length Shrinkages of Washed STV 747 T-shirts Corresponding to the
Processing Conditions of the Constituent Fiber (After 32 W/D Cycles) ...95 Table 23. Width Shrinkages of Washed STV 747 T-shirts Corresponding to the
Processing Conditions of the Constituent Fiber (After 32 W/D Cycles) ...95 Table 24. Area Shrinkages of Washed STV 747 T-shirts Corresponding to the
Processing Conditions of the Constituent Fiber (After 32 W/D Cycles) ...97 Table 25. Area Shrinkages of Washed DPL 33B T-shirts Corresponding to the
Processing Conditions of the Constituent Fibers (After 32 W/D Cycles) ...97 Table 26. Summary Statistics for Area Shrinkages of STV 747 T-shirts Based on the
Ginning Rate ...98 Table 27. Summary Statistics for Area Shrinkages of STV 747 T-shirts Based on the
Number of Lint Cleaners...98 Table 28. Summary Statistics for Area Shrinkages of STV 747 T-shirts Based on the
Carding Rate...98 Table 29. Summary Statistics for Area Shrinkages of DPL 33B T-shirts Based on the
Ginning Rate ...98 Table 30. Summary Statistics for Area Shrinkages of DPL 33B T-shirts Based on the
Number of Lint Cleaners...98 Table 31. Summary Statistics for Area Shrinkages of DPL 33B T-shirts Based on the
Carding Rate...99 Table 32. ANOVA for Processing Effects on Area Shrinkage of STV 747 T-shirts
Undergone 32 Repeated W/D ...100 Table 33. ANOVA for Processing Effects on Area Shrinkage of DPL 33B T-shirts
1 INTRODUCTION
The mode and extent of damages inflicted upon cotton fibers by mechanical actions during cotton ginning and the subsequent textile manufacturing processes have long been speculated but have not been carefully studied in the past.
directly to the shrinkage of cotton fabrics, any attempt to relate the two appears totally unsatisfactory.
As consumers began demanding quality of cotton-made goods over and above lower prices, it is time to reexamine the qualities of cotton products to see if indeed the speed of production has to be evaluated carefully in light of the possible adverse effects originating from fast processing. Therefore, it is prudent to study two major sources of fiber damage, namely, ginning and carding for each of their individual and combined effects on the resulting yarns and fabrics. This paper examines the possible relations between single fiber tensile properties and dimensional properties of garments and the effects of the speed of gin, card, and the number of lint cleaners.
Although HVI (High Volume Instrument) has been used generally for examining various properties of fibers from ginned cotton and card slivers[1-10], it is impossible to measure tensile properties of cotton fibers within yarns, fabrics, and garments by using HVI due to the restriction in sample preparation. This is a great obstacle which hinders broader application of HVI data to predict the properties of yarns with various counts.
Although the only way to measure the tensile properties of cotton fibers at post-carding process is single fiber test, it has not been as widely applied as HVI due to the extensive time and labor requirements. More recently, however, the invention of Mantis® single fiber tester made it possible to test individual fibers at reasonable cost and speed.
For the above reasons, the changes in tensile properties from the opening process to the garment-consuming (repeated washing and drying of garments) step, may be measured and analyzed based on the results of tensile tests on individual cotton fibers. By assuming that the dimensional properties of washed garments are related to the tensile properties of constituent fibers, and that their properties are affected by the opening processes, tracking the single fiber tensile properties from the early process stages to washing steps would disclose the effects of the speed of the opening and cleaning processes on the quality of the end product.
2 LITERATURE REVIEW
In order to analyze the response of fibers to the mechanical impact during ginning and spinning, studies on the macrostructure of fibers and their effects on the mechanical actions were reviewed after repeated washing/drying of knitted garments, also.
The effects of repeated washing and drying of garment on tensile properties of fibers as well as the dimensional properties of a garment are of great interest. Several researchers studied about the effects of washing and drying on the dimensional properties of garments and surface characteristics of the fabrics. Hypothetically, the effects of the changes in processing rates could be detected from the fibers tested after repeatedly washing and drying of the garments. For this reason, references on the effects of washing and drying on dimensional properties of the fabrics were also reviewed.
2.1 Effects of Ginning and Carding on Cotton Fiber Properties
2.1.1 Quantification of Cotton Quality Changes in Terms of Fiber Processing Propensity
could be attributed to the mechanical processing. They found that breaking load and weight-fineness of the fibers were essentially the same before and after processing and the significant difference between the unprocessed and processed cottons was noted in the values for elongation at break. They discovered that during the processing, the tension which stretched the fiber also removed kinks and produced a permanent deformation which may be repeated several times as fibers pass through opening, carding, and drawing machine. Leitgab et al. [15] investigated the effects of overdrying on the processing characteristics of cotton and to determine any changes in fiber properties relating thereto. They suggested that there was evidence to indicate a greater crystallinity for the heated cottons.
better nep removal efficiency and brought down the opening roller waste on OE machine
2.1.2 Quantification of Cotton Quality Changes in Terms of Short Fiber Content and Fiber Length Characteristics
rate, but the effects from high-ginning rates were secondary to the effects of ginning at low-moisture levels. Conclusively, he asserted that moisture in cotton and the number of lint-cleaning stages had more influence on SFC than did ginning rates or saw speeds.
As stated in the first paragraph, short fiber content and length properties are closely related to the fiber breakage. Although the fiber breakage is a conspicuous feature showing degradation of the fiber quality, it is impossible to find potential damages inflicted upon the fibers based on these properties, alone. For example, internal damage of the unbroken fiber is not exhibited by the length. Therefore, it is prudent to consider potential damages on fibers during textile processing in order to investigate the changes in fiber quality during repeatedly washing and drying of the end products. One of the methods for studying the fiber damage during textile processing is to study the structural characteristics of the fibers and relate them to the tensile properties. Following section deals with the literatures about the macrostructures of cotton fibers.
2.2 Effects of Structural Characteristics of Cotton Fibers on Tensile Properties
2.2.1 Fibrillar Structure of Cotton Fiber
disordered regions are present. Hearle [31] suggested that plant fibers are composed of an assembly of fibrils, each of which is a single crystal made up of folded polymer chains. However, there is a piece of evidence which suggests that the fibers cannot be an assembly of completely separate fibrils. If the fibrils were independent of one another, there would be no reason why the swelling should stop as it does at a well-defined limited value. It therefore seems that there must be some tie between the fibrils with at least small lengths of polymer chains linking one fibril to one another. He studied the effect of helix angle of fibrils on the tensile properties of cotton fiber. The fibrils in cotton fiber were known to have spiral angle of about 30º to the fiber axis. He suggested two modes of deformation during fiber extension: either the fibrils may stretch as the fiber extends at constant volume or the fibrils may change their helical configuration, like spiral springs, without change in length but with a reduction in volume giving the resistance to fiber extension.
Considering the balance between the two modes of deformation comes in through the use of the principle of minimum energy. With this minimum energy principle, breaking strength, modulus, and breaking elongation were calculated in terms of the helix angle, local tensile modulus of fibril assembly, and local bulk modulus of fibril assembly.
Figure 1. (a) Model of Cotton Fiber as an Assembly of Fibrils Following Helical Paths. (b) Path of a Single Fibril. (c) "Opened-out" Diagram.
He considered fibers to be made up of an assembly of fibrils, each following a helix of angle θ, as shown in Figure 1a. If we consider a length l, corresponding to one turn of the helix of radius r, Figure 1b, this can be represented by the diagram of the cylinder opened out flat as in Figure 1c. We then have: 2 2 2 2 4 r h
l = +
π
(1)He assumed for simplicity that if the fibrils are extended independently, they would deform at constant volume. However, due to the helical arrangement of the fibrils, the fiber as a whole may reduce in volume during extension in order to relieve the tensile strain. By the derivation based on the above information, he calculated the following equations
where
Ef = fiber Young’s modulus (kg/mm2) Kf = bulk modulus (kg/mm2)
σi = Poisson’s ratio of a fibrillar layer
The stress f was given by the equation:
2
2 + (1−2 )
) −
=
=
δ
Uδε
Efε
θ
σ
θ
Kfε
σ
f 2 2
sin (cos
/ (3)
And hence the fiber modulus E was given by: 2 2 2 2 1 sin
(cos − ) + ( − )
= θ σ θ 2 σ
f
f K
E
E (4)
If Kf is very large, then
θ θ 2 2
sin cos
2Kf >>Ef and 4Kf >>Ef sin4θ, so that 2 1 =
σ
and:2 2
1 )
−
= 2θ 2θ
sin (cos
f E
E (5)
The same reduction will occur when θis very small.
The alternative reduction, when Kf is small and Ef is large, so that
f
f Κ
E 2θ 2θ >>2
sin
cos and Ef 4θ >>4Kf
sin gives:
2 ) − = =
θ
θ
σ
2 2 cot 2 1 ( cot f KE (6)
Waterkeyn et al. [32] introduced the constant-gyre-length model, meaning the spiral angle of the fibrils decreased uniformly from the surface of the fiber to the core. They observed from fibers grown in situ that the cellulose fibrils in the first layer of the secondary wall are inclined at 55º to the longitudinal axis of the fiber. The next inner layer of the secondary wall is then laid down with a helical structure of fibrils inclined at 50º to the fiber axis. During the subsequent cellulose deposition, from day 30 to 59 postanthesis, the inclination of fibrils diminishes gradually to 20º or less. Warrier et al. [33], studied the relationships between orientation of fibrils and tensile properties of cotton fibers. They indicated that fibrils with different inclinations to the fiber axis have different extents of influence on a specific fiber property. Chidambareswaren et al. [34] found that cottons with smaller convolution angles registered noticeable orientation changes at small extensions, while highly convoluted cottons did not show this behavior. Orientation in mature cottons was found to respond better to extension than that in immature ones. In addition, the rate of change of orientation with extension depended upon the normal orientation, convolution angle, and maturity of the fibers.
2.3 Relationships Between Fiber Properties and Yarn Properties
In studying the response of cotton to stress forces, it is considered essential to investigate the properties of individual cotton fibers [35]. There have been numerous researchers who elucidated the relationship between fiber properties and yarn properties. Virgin and Wakeham [9] studied the single-fiber testing methods for the determination of cotton fiber properties and for the prediction of yarn quality. They stated that yarn strength depends strongly on fiber length, fineness, and elastic modulus, and only weakly on fiber strength; yarn elongation depends greatly on fiber elongation and elastic modulus. Fiber elongation was found to be the most important fiber property influencing yarn elongation. Unlike the conclusion of Virgin and Wakeham, Fiori et al. [21, 36] suggested that high-strength cotton produces stronger yarns than low-strength cottons for any given yarn number or twist, a well-known general relationship. They made several conclusions about the effect of cotton fiber strength on single yarn properties and on processing behavior; the strength of the fiber has little or no effect on processing efficiency through spinning. High-strength cotton produced stronger yarns than low-strength cottons for any given yarn number or twist, a well-known general relationship. The amount of twist required to obtain maximum strength in single cotton yarns is not affected by fiber strength. Fiber strength does not significantly affect the uniformity of slivers, rovings, or single yarns. Fiber strength does not significantly affect yarn elongation
tenacity was positively correlated with yarn tenacity. The correlation coefficients were the largest of any of the fiber properties except for zero-gauge tenacity with the lower twist open-end spun yarn. They also stated that fiber length parameters were positively correlated with yarn tenacity. They found that correlation coefficients were nearly as large as that for fiber tenacity and yarn tenacity. Simpson and Murray [40] showed that fiber fineness was more important in open-end than in ring spinning due to poor fiber parallelization in open-end yarns and fiber strength was more important in ring spinning. They suggested that for the most efficient overall processing there must be a compromise between the fiber properties required for efficient carding and those for efficient spinning and end products. El Hattab et al. [41] also showed a positive correlation between fiber length and strength of yarn as for fiber properties/yarn strength relationships. Louis et al. [38] ranked fiber properties in their order of importance relative to yarn properties and end breakage in addition to ranking yarn properties in their order of importance relative to end breakage. They provided the result that fiber strength had a high coefficient with regard to yarn strength and low coefficient with end breakage. Also fairly high correlation coefficients were observed between fiber average stiffness with yarn strength, toughness with yarn elongation and fiber elongation with yarn elongation. He stated that fiber strength ranked first to yarn strength and fiber length to end breakage.
therefore expensive, the textile industry has for years relied on bundle tests to predict cotton performance [35]. Researchers also worked to develop methods to measure the bundle strength of cotton fibers [6]. Pressley published a paper on an instrument to test the strength of a flat bundle of fibers, which became known as the Pressley tester [7, 44]. In 1953, Hertel introduced the Stelometer for measuring the breaking force and elongation of flat fiber bundles [7, 45]. In 1960s, the U.S. Department of Agriculture and U.S. cotton producers began to support research to develop an automated “high speed” bundle strength tester, which resulted in the “high volume instrument (HVI)” system. Extensive studies have been made of each of these instruments to develop relationships between fiber bundle and yarn strength. Sasser et al. [7] showed, however, that correlations between fiber strength and yarn strength for the samples improved somewhat when they used the average single fiber strength rather than HVI or Stelometer bundle strength.
2.4 Changes of Various Properties of Cotton After Laundering
2.4.1 Morphology Characteristics of Cotton Fibers After Laundering
2.4.2 Changes of Dimensional Properties of Cotton Fabrics After Laundering
Knitted fabrics are popular for their shape fitting properties, softer handle, bulkier nature, and high extension at low tension [54]. However, they also suffer from various forms of dimensional distortion due to the dimensional instability of knitted loop construction, especially after laundering steps. For elucidating the dimensional characteristics of knitted fabric, Munden [55] defined the relationship between courses per unit length, wales per unit length, and loop length using four parameters k1, k2, k3, k4:
w c k l w k l c k l w c k / 4 3 2 2 1 = × = × = × × =
where c = courses per unit length, w = wales per unit length and l = loop length. The significance of these equations is that plain knitted fabric dimensions are basically defined by the length of yarn in the knitted loop. All other variables, including knitting, yarn and machine variables only have effect on fabric dimensions with the change of loop length. Based on his theory, he then introduced the concept of a knitted fabric Cover Factor (CF) for plain-knit fabric quality control [56].
therefore predictable by applying the simple equations [63]. Wolfaardt [64] modified these equations in order to apply for the 1×1 Rib structure
There are two common dimensional changes occurring after laundering; a phenomenon called “spirality”, and fabric shrinkage. Spirality is shown as wales that are not perpendicular to courses. Several workers [65-67] have done the research about spirality and demonstrated that the most prominent factor causing spirality in a single-jersey fabric was the relaxation of torsional stresses in the yarn. Tao et al. [61] revealed the yarn twist factor and the fabric tightness factor promoted fabric spirality.
3 RESEARCH OBJECTIVES
The main objectives of this study are as follows:
1. Observe the changes in cotton quality in terms of the tensile properties of individual cotton fibers during textile processes and examine the effects of these processes on the tensile properties
2. Investigate the effects of ginning and carding rates on the tensile properties of single cotton fibers as well as on the shrinkage of the washed garments after repeated washing and drying.
3. Establish a comprehensive model for explaining the tensile performance of single cotton fibers based on their cellular microstructure as bicomponent bundle.
4 EXPERIMENTS
In order to investigate the effects of textile processes on the tensile properties of cotton fibers from the harvesting to consuming of end-products, it was necessary to collect, process, and test considerable amount of fibers. Although HVI data or AFIS data have provided us varieties of properties of cotton, they have limited amount of usages. Furthermore, these data could be obtained beyond carding process. Therefore, it is not possible to study the changes by HVI or AFIS in a roving, yarn or fabric form. In addition, the HVI tests represent bundle properties in lieu of single fiber tensile properties.
Three varieties of cotton grown in the region of Stoneville and Deltapine, MS. were selected for the research. Cotton samples from Stoneville 747 (STV 747), Stoneville 4892 (STV 4892), and Deltapine 33B (DPL 33B) were provided by the USDA Ginning Laboratory in Stoneville, MS. The cotton samples were ginned by hand, and by machine with various ginning conditions at USDA Stoneville Ginning Laboratory. The ginned cottons were transferred to USDA-ARS Laboratory at Clemson for Carding, Spinning, and Knitting. Cotton fibers with various carding conditions were collected right after carding and tested by Mantis® single fiber.
As reference data, the AFIS and HVI data of the fiber samples were obtained in each processing stage at USDA-ARS Clemson Lab, and the official HVI data at USDA-AMS, in Memphis, TN.
Cotton Incorporated. Progressive shrinkages were measured in the length and width directions of the T-shirts. At the end of the 32 cycles, the cotton fibers were pulled out from the T-shirts and tested with Mantis® for measuring their tensile properties. The followings provide a detailed description of the experimental procedures.
4.1 Sing Fiber Tensile Test by Mantis®
Individual cotton fibers obtained from raw cotton, ginned cotton, card slivers, unwashed T-shirts and washed T-shirts were tested by Mantis® single fiber tensile tester. Initial gauge length of two grabbing jaws of the tester is 3.175mm. It is constant rate of extension (CRE) type tester and the jaw movement rate is 1.00 mm/sec. This tensile tester is much faster than conventional Instron® or other tensile tester. Due to large variations in the properties of natural cotton fiber, a great amount of time and labor should be required for the large number of tests.
4.2 Hand-picked and Hand-ginned Cotton
4.3 Spindle-harvested and Conventional Ginning Process
The tensile properties of these samples are to be compared with that of the spindle-harvested and machine-ginned samples.
Cotton samples were processed with two different ginning rates (75% and 125% of the capacity). The rates were obtained by adjusting the throughput of the cotton in the gin. During ginning, cotton was processed with lint cleaners. Although two lint cleaners are used in general, we processed cotton in tow ways; one sample run through one lint cleaner and the other through two lint cleaners. Moisture content was adjusted by controlling the temperature in the drier. A higher drying temperature leaves less moisture in cotton fiber. Drying temperatures were set roughly at 100ºF and 200ºF, and the ginning was replicated at each level to increase the precision of the estimated effects and enable us to estimate the interaction effects. The breaking elongation, breaking strength, and breaking energy were measured using a Mantis® for each combination.
4.4 Experimental Design for Ginning and Carding Effects – Based on Card Slivers
With the hand-processed cotton representing the base-line of the cotton quality, ginning was done at two ginning rates, 75% and 125% of the normal ginning rate by roler gin. It is obtained by adjusting the throughput of the cottons. At each ginning rate, the samples were processed with both one and two lint cleaners.
hoppers and then transferred to “AXI-FLO AFC,” a double-roll cleaner. Following these processes, cottons were blended and cleaned in “GBRA,” another blending machine. Through a coarse cleaner called “RN” with 18” roller with 3” spikes, cottons were cleaned. A further cleaning was done in “RST,” a fine cleaner. Dust was removed from cottons by DUSTEX™. Finally, the cotton samples were processed in a DK 740 card to produce 70 grain card slivers.
Carding rates applied in this experiment were 60 lbs./hour and 120 lbs./hour. These were relatively lower and higher rates than the commercial carding rate of 100 lbs./hour. The carding machine (Truetzchler DK740) used in this research had 1 licker-in roller. Wastes from this process were tested on a Shirley Analyzer. In addition, evenness tests and AFIS fiber length tests were performed on each card sliver.
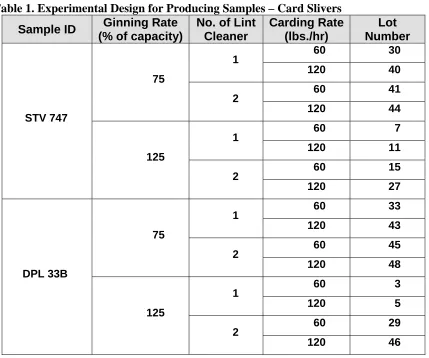
Table 1. Experimental Design for Producing Samples – Card Slivers
Sample ID Ginning Rate
(% of capacity)
No. of Lint Cleaner Carding Rate (lbs./hr) Lot Number 60 30 1 120 40 60 41 75 2 120 44 60 7 1 120 11 60 15 STV 747 125 2 120 27 60 33 1 120 43 60 45 75 2 120 48 60 3 1 120 5 60 29 DPL 33B 125 2 120 46
4.5 Drawing, Spinning and Knitting
Subsequently, the ring spun yarns were knitted into plain jersey fabrics by a Vanguard Supreme circular knitting machine. The fabrics were sent to Cotton Incorporated for scouring and finishing in two fabric rolls.
4.6 Garment Manufacturing
The knitted fabrics matching different treatment combinations were sent to [TC]2® for T-shirts production. The T-shirts were sewn with side seams in order to produce medium sizes. The T-shirts were with short sleeves with 1” serged hems at the sleeves and at the garment bottoms. In addition, a 1x 1 rib knit fabrics were used for producing necks.
4.7 Repeated Washing and Drying of T-shirts
Experiments were designed to observe the progressive shrinkages and other dimensional changes and to study their relationships with the single fiber tensile properties matching the ginning and carding conditions. The experimental scheme includes repeated washing/drying, measurement of dimensional changes, and testing of single fiber tensile properties.
The laundering and drying experiments were carried out by using AATCC Test Method 150-1995 [84]. This test method was for determining dimensional changes of garments by placing bench marks on designated areas of the garments [85].
4.7.1 Apparatus and Materials
4.7.2 Specimens
Each garment was considered as a specimen. Three specimens of each type were tested in order to increase the precision of the average. Prior to the tests, pre-conditioning was done as required by ASTM D 1776. T-shirt samples were placed separately under the standard condition (21 ± 1°C and 65 ± 2% RH) for at least 4 hours. For measuring dimensional changes, we placed bench marks on the surface of the garments. The locations of bench marks in T-shirt were in collars, collar bands, body lengths, sleeve lengths, and cuffs. Among these locations, we chose collar bands, body lengths, and sleeve lengths. The distance between bench marks was determined by the size of the T-shirt. The measurements were recorded to the nearest millimeter values or tenth of an inch, and the % change was computed based on the initial dimensions.
4.7.3 Test Procedure
dryer immediately after the final washing cycle. The washed garments were placed in the tumble dryer with the temperature settings for cotton garments as described in Table 2. For each group of T-shirts, a total of 32 cycles of washing/drying were completed. The 32 cycles of washing/drying were chosen because the progressing shrinkages became minimal at that point.
At the completion of washing and drying cycles, the specimens were conditioned under the standard atmosphere, namely, 21 ± 1°C (70 ± 2°F) and 65 ± 2% RH for 4 hours.
4.7.4 Measurements
Figure 2 shows the positions measured for dimensions of T-shirts. The distance between each pair of bench marks were measured and recorded to the nearest millimeter, or to the nearest tenth of an inch or smaller increment.
Figure 2. Measurements in a T-shirt
Length
4.7.5 Calculation and Interpretation
The dimensional changes in T-shirt samples were calculated as % changes of original dimensions following a pre-designated number of washing and drying cycles as follows:
A B A 100
DC ( )/
% = − (7)
where:
Table 2. Washing and Drying Conditions
Machine Cycle Washing Temperatures Dryer Procedures
(1) Normal/Cotton
Sturdy (II) 27 ± 3°C (80 ± 5°F)
Tumble:
i. Cotton Sturdy
ii. Delicate
iii. Permanent Press
(2) Delicate (III) 41 ± 3°C (105 ± 5°F) (B) Line
(3) Permanent Press (IV) 49 ± 3°C (120 ± 5°F) (C) Drip
(V) 60 ± 3°C (140 ± 5°F) (D) Screen
Table 3. Washing Machine Setting Conditions without Load
Normal Delicate Permanent Press
(A) Water Level 18 ± 1 gal 18 ± 1 gal 18 ± 1 gal
(B) Agitator
Speed 179 ± 2 spm 119 ± 2 spm 179 ± 2 spm
(C) Washing
Time 12 min. 8 min. 10 min.
(D) Spin Speed 645 ± 15 rpm 430 ± 15 rpm 430 ± 15 rpm
(E) Final Spin
Cycle 6 min. 4 min. 4 min.
Table 4. Dryer Setting Conditions
Cotton Sturdy Delicate Permanent Press
Exhaust
Temperatur
e
High
66 ± 5°C
(150 ± 10°F)
Low
< 60°C
(140°F)
High
66 ± 5°C
(150 ± 10°F)
Cool Down
4.8 Microscopic Observation
Surface properties of cotton play an important role in textile products and processes. In addition to contributing to yarn uniformity and mill efficiency, surface characteristics influence dye absorbency and reactivity rate as well as the fabric handle. In this study, efforts were made to examine the possible effects of ginning and carding conditions on the surface properties of cotton fibers through a scanning electron microscope at NCSU. Any degradation in tensile properties of cotton fibers could also be manifested by the optical properties of cotton fiber surfaces.
4.8.1 Apparatus
Hitachi S-3200 variable pressure scanning electron microscope (ESEM) was used for the optical experiment.
4.8.2 Materials
5 RESULTS AND DISCUSSIONS
5.1 Comparative Study on the Effects of Ginning Methods on Tensile Properties of Ginned Cotton: Hand Ginning vs. Machine Ginning
have been compared against that of the spindle-harvested and machine-ginned cottons.
5.1.1 Effects of Ginning Rates on Tensile Properties of Ginned Cotton Fibers
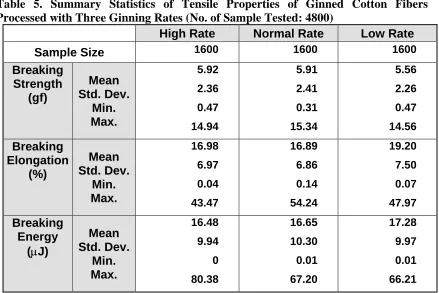
The results of Mantis® single fiber tensile tests are summarized in Table 5. The average breaking strength, breaking elongation, and work to break are shown along with their standard deviation and range.
Table 5. Summary Statistics of Tensile Properties of Ginned Cotton Fibers Processed with Three Ginning Rates (No. of Sample Tested: 4800)
High Rate Normal Rate Low Rate
Sample Size 1600 1600 1600
Breaking Strength (gf) Mean Std. Dev. Min. Max. 5.92 2.36 0.47 14.94 5.91 2.41 0.31 15.34 5.56 2.26 0.47 14.56 Breaking Elongation (%) Mean Std. Dev. Min. Max. 16.98 6.97 0.04 43.47 16.89 6.86 0.14 54.24 19.20 7.50 0.07 47.97 Breaking Energy
(µJ)
Mean Std. Dev. Min. Max. 16.48 9.94 0 80.38 16.65 10.30 0.01 67.20 17.28 9.97 0.01 66.21
0 50 100 150 200 250
2 4 6 8 10 12 14 16 18 20 22 24 26 28 30 32 34 36 38 40 42 44 46 48 50
Breaking Elongation (%)
Fr
eque
ncy
High ginned Med ginned Low ginned
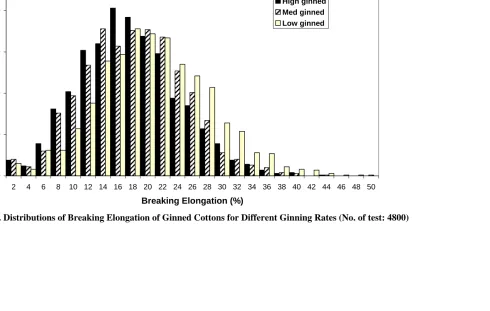
Figure 3. Distributions of Breaking Elongation of Ginned Cottons for Different Ginning Rates (No. of test: 4800)
0 20 40 60 80 100 120 140 160
0.5 1.5 2.5 3.5 4.5 5.5 6.5 7.5 8.5 9.5 10.5 11.5 12.5 13.5 14.5
Breaking Strength (gf)
Fr
eq
uen
c
y
high ginned Med ginned Low ginned
Figure 4. Distributions of Breaking Strength of Ginned Cottons for Different Ginning Rates (No. of test: 4800)
0 2 4 6 8 10 12 14 16
0 5 10 15 20 25 30 35 40 45 50
Breaking Elongation (%)
Brea
k
ing
St
re
ngt
h (
g
f)
High Ginning Rate Normal Ginning Rate
Figure 5. Scatter Plot of Breaking Strength vs. Breaking Elongation of Single Fibers: High Ginning Rate vs. Normal
Ginning Rate (No. of test: 3200)
0 2 4 6 8 10 12 14 16
0 5 10 15 20 25 30 35 40 45 50
Breaking Elongation (%)
Bre
a
k
ing St
re
ngth
(gf)
High Ginning Rate Low Ginning Rate
Figure 6. Scatter Plot of Breaking Strength vs. Breaking Elongation of Single Fibers: High Ginning Rate vs. Low
Ginning Rate (No. of test: 3200)
0 2 4 6 8 10 12 14 16
0 5 10 15 20 25 30 35 40 45 50
Breaking Elongation (%)
Bre
a
k
ing St
re
ngth
(gf)
Normal Ginning Rate Low Ginning Rate
Figure 7. Scatter Plot of Breaking Strength vs. Breaking Elongation of Single Fibers: Normal Ginning Rate vs. Low
Ginning Rate (No. of test: 3200)
5.1.2 Comparison of the Tensile Properties for Hand-ginned Cotton and Machine-ginned Cotton
Table 6. Summary Statistics for Single Fiber Tensile Properties - Obtained at Three Different Ginning Rates and from Hand-ginned Cotton
High Ginning Rates
Normal Ginning Rates
Low Ginning
Rates Hand-ginned
Sample Size 2399 1999 2400 800
Breaking Strength (gf) Mean Std. Dev. Min. Max. 5.92 2.36 0.47 14.94 5.91 2.41 0.31 15.34 5.56 2.26 0.47 14.56 6.36 2.13 0.76 15.04 Breaking Elongation (%) Mean Std. Dev. Min. Max. 16.98 6.97 0.04 43.47 16.89 6.86 0.14 54.24 19.20 7.50 0.07 47.97 21.11 7.24 0.33 49.41 Work done During Test
(µJ)
Mean Std. Dev. Min. Max. 16.48 9.94 0 80.38 16.65 10.30 0.01 67.20 17.28 9.97 0.01 66.21 20.29 9.85 0.06 62.66
5.1.3 Hand-picked and Hand-ginned Cottons
Table 7. Summary Statistics of Tensile Properties of DPL 33B Hand-ginned Cotton (No. of sample tested: 4400)
Breaking Strengths Breaking Elongations
Mean 5.63 16.95
Std Err 0.04 0.09
Median 5.41 16.49
Mode 3.52 15.49
Std. Dev. 2.40 5.79
Sample Variance 5.77 33.51
Kurtosis -0.36 0.45
Skewness 0.42 0.49
Range 13.59 47.49
Minimum 0.51 -0.20
Maximum 14.10 47.29
Count 4400.00 4400.00
Table 8. Summary Statistics of Tensile Properties of STV 747 Hand-ginned Cotton Fibers (No. of sample tested: 4400)
Breaking Strengths Breaking Elongations
Mean 6.90 20.65
Std Err 0.04 0.11
Median 6.92 20.18
Mode 7.17 21.45
Std. Dev. 2.41 7.25
Sample Variance 5.82 52.51
Kurtosis 0.13 0.32
Skewness 0.18 0.48
Range 19.36 47.50
Minimum 0.47 0.04
Maximum 19.83 47.54
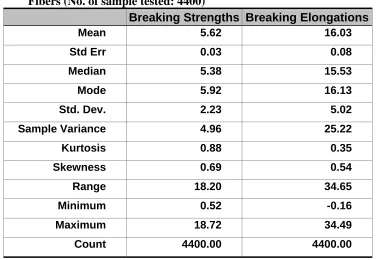
Table 9. Summary Statistics of Tensile Properties of STV 4892 Hand-ginned Cotton Fibers (No. of sample tested: 4400)
Breaking Strengths Breaking Elongations
Mean 5.62 16.03
Std Err 0.03 0.08
Median 5.38 15.53
Mode 5.92 16.13
Std. Dev. 2.23 5.02
Sample Variance 4.96 25.22
Kurtosis 0.88 0.35
Skewness 0.69 0.54
Range 18.20 34.65
Minimum 0.52 -0.16
Maximum 18.72 34.49
Count 4400.00 4400.00
STV 747 (4400 )
0 50 100 150 200 250 300 350 400 450
0 1 2 3 4 5 6 7 8 9 10 11 12 13 14 15 16 17 18 19 20 21 22 23 24 25
Breaking Strength (gf)
Fr
e
q
u
e
nc
y
Figure 8. Histogram of Single Fiber Strength for STV 747 (No. of test: 4400)
DPL33B3 (4800 )
0 50 100 150 200 250 300 350 400 450
0 1 2 3 4 5 6 7 8 9 10 11 12 13 14 15 16 17 18 19 20 21 22 23 24 25
Breaking Strength (gf)
Fr
e
q
u
e
nc
y
Figure 9. Histogram of Single Fiber Strength for DPL 33B (No. of test: 4800)
STV 4892 (4400 )
0 50 100 150 200 250 300 350 400 450 500
0 1 2 3 4 5 6 7 8 9 10 11 12 13 14 15 16 17 18 19 20 21 22 23 24 25
Breaking Strength (gf)
Fr
e
q
u
e
nc
y
Figure 10. Histogram of Single Fiber Strength for STV 4892 (No. of test: 4400)
STV 747 (4400)
0 50 100 150 200 250 300
0 2 4 6 8 10 12 14 16 18 20 22 24 26 28 30 32 34 36 38 40 42 44 46 48 50
Breaking Elongations (% )
Fr
e
q
u
e
nc
y
Figure 11. Histogram of Single Fiber Elongation for STV 747 (No. of test: 4400)
DPL33B3 (4800 )
0 50 100 150 200 250 300 350 400
0 2 4 6 8 10 12 14 16 18 20 22 24 26 28 30 32 34 36 38 40 42 44 46 48 50
Breaking Elongations (% )
Fr
e
q
u
e
nc
y
Figure 12. Histogram of Single Fiber Elongation for DPL 33B (No. of test: 4800)
STV 4892 (4400 )
0 50 100 150 200 250 300 350 400 450
0 2 4 6 8 10 12 14 16 18 20 22 24 26 28 30 32 34 36 38 40 42 44 46 48 50
Breaking Elongation (% )
Fr
e
q
u
e
nc
y
Figure 13. Histogram of Single Fiber Elongation for STV 4892 (No. of test: 4400)
5.2 Effects of Textile Processing on the Tensile Properties of Single Fibers: Sequential Property Changes from Card Slivers, Unwashed, and Washed T-shirts
We have tested cotton fibers with the Mantis® single fiber tester to obtain the tensile data at each stage of processing; raw stock, ginned cotton, card sliver, unwashed T-shirt, and washed T-shirt. The primary objective was to study how the cotton fibers are affected by the subsequent textile processing in terms of the tensile properties of cotton fibers. In order to simplify the experiment and clarify the study objectives, ginning rate, number of lint cleaners in the gin, and carding rate were selected as factors in the experimental design, as stated previously. We categorized the textile processes into two parts; dry processes from picking seed cottons up to knitting, and wet processes from finishing to laundering and drying of garments.
and knitting processes into the experimental design for more accurate investigation on the processing conditions, these processes were not examined in this study due to the limitation of time, and cost.
Figures 15 – 17 show the effects of ginning rates, number of lint cleaners, and carding rates on the breaking strength of fibers. Fibers from card slivers processed at the higher ginning rate showed a higher average breaking strength than that from the low ginning rate. However, the average fiber strengths unraveled from unwashed and washed T-shirts were shown to be higher for the fibers processed at the low ginning rate. In other words, the effects of ginning rate were reversed after carding. Since cottons were processed under exactly the same conditions except ginning and carding, we may conclude that the hidden effects of ginning and carding emerge perhaps only when the garments are washed and dried, or only when the fibers are fully relaxed. Throughout the entire processing stages, fibers processed with one lint cleaner showed higher breaking strengths than processed with two lint cleaners. Likewise, the lower carding rate produced higher average breaking strengths throughout the entire processing stages.
In addition, the decrease in the average breaking strength was shown to be progressive as the number of repeated washing/drying cycle increases. It suggests that the repeated washing/drying of garments resulted in significant damages in the tensile properties of the fibers.
4.5 5 5.5 6 6.5 7
Cardsliver Unwashed Washed
Process Stage
B
reaking S
tr
e
ngth
(gf)
Low Ginning Rate High Ginning Rate
4.5 5 5.5 6 6.5 7
Cardsliver Unwashed Washed
Process Stage
B
reaking S
tr
e
ngth
(gf)
1 Lint Cleaners 2 Lint Cleaners
4.5 5 5.5 6 6.5 7
Cardsliver Unwashed Washed
Process Stage
B
reaki
ng S
tr
e
ngth
(gf)
Low Carding Rate High Carding Rate
4.5 6.5 8.5 10.5 12.5 14.5 16.5 18.5 20.5 22.5
Cardsliver Unwashed Washed
Process Stage
B
reaking E
longation (%
)
Low Ginning Rate High Ginning Rate
4.5 6.5 8.5 10.5 12.5 14.5 16.5 18.5 20.5 22.5
Cardsliver Unwashed Washed
Process Stage
B
reaking E
longation (%
)
1 Lint Cleaner 2 Lint Cleaners
4.5 6.5 8.5 10.5 12.5 14.5 16.5 18.5 20.5 22.5
Cardsliver Unwashed Washed
Process Stage
B
reaking E
longation (%
)
Low Carding Rate High Carding Rate
5.3 Study on the Tensile Properties of Cotton Fibers at Each Processing Stages
5.3.1 After Carding
STV 747, STV 4892, and DPL 33B cotton varieties were spindle-harvested, and then processed at the gin with two ginning rates and two lint cleaning methods. The ginned cotton were transferred to the card and processed under two carding rates. Then single fibers were collected after carding, and tested by Mantis® single fiber tester. For the simplification of data analysis, STV 4892 was dropped out due to their similarity to STV 747 based on the tensile property data of hand-picked and hand-ginned cotton. Statistical analysis was made on the tensile data. The results are as follows.
For this analysis, the following equation is used for regression model.
ε
β
β
β
β
β
β
β
β
+ + + + + + + += i i i i i i i
i G L C GL GC LC GLC
Y 0 1 2 3 4 5 6 7 (8)
where:
Yi = Dependent variable (Breaking strength or breaking elongation),
β0 = Mean,
βi, , i=1~6 = Regression coefficients, Gi = Effect of ginning rates,
Li = Effect of the number of lint cleaners, Ci = Effect of carding rates,
GLCi = Threefactor Interaction,
ε = error, and
i = 1~16 (process conditions).
Although the interaction terms were included in the above model, we could the test the null hypothesis for the interaction effect due to the insufficient degrees of freedom. Therefore, while the above model represents the full model for the analysis, we used main effect model for the following analyses.
5.3.1.1Effects of Process Parameters on the Tensile Properties of STV 747 Cotton Fibers
All three process variables (ginning rate, number of lint cleaners, and carding rate) had significant effects on the breaking strength. Average breaking strength of fibers from the higher ginning rate was greater than that at lower ginning rate by 0.25 gf. Fibers ginned with one lint cleaner showed a higher breaking strength than with two lint cleaners by 0.11 gf. Fibers carded at lower rate showed higher breaking strength than that at higher rate by 0.13 gf.
6.35 6.4 6.45 6.5 6.55 6.6
Low High 1 2 Low High
Ginning Rate Lint Cleaners Carding Rate
Process Condition
B
reaki
ng S
treng
th (gf)
Figure 21. Fiber Strength of STV 747 Card Slivers vs. Ginning Rates, No. of Lint Cleaner, and Carding Rates (No. of test: 22798)
19.6 19.8 20 20.2 20.4 20.6 20.8
Low High 1 2 Low High
Ginning Rate Lint Cleaners Carding Rate
Process Condition
Brea
ki
ng E
longati
on (%
)
Figure 22. Fiber Elongation of STV 747 Card Slivers vs. Ginning Rates, No. of Lint Cleaner, and Carding Rates (No. of test: 22798)
5.3.1.2 Effects of Process Parameters on the Tensile Properties of DPL 33B Cotton Fibers
The ginning rates did not have a significant effect on the breaking strength. Fibers ginned with one lint cleaner showed greater breaking strengths than that with two lint cleaners by 0.29 gf, and the difference was significant at 5% error level. The carding rates also showed a significant effect on the breaking strength. Fibers carded at the lower rate showed a higher breaking strength than that at higher rate by 0.1 gf. The result was significant at 5% error level.
5.7 5.75 5.8 5.85 5.9 5.95
Low High 1 2 Low High
Ginning Rate Lint Cleaners Carding Rate
Process Condition
B
reaki
ng S
treng
th (gf)
Figure 23. Fiber Strength of DPL 33B Card Slivers vs. Ginning Rates, No. of Lint Cleaner, and Carding Rates (No. of test: 22396)
15.2 15.3 15.4 15.5 15.6 15.7 15.8 15.9
Low High 1 2 Low High
Ginning Rate Lint Cleaners Carding Rate
Process Condition
Breaki
n
g
E
lon
gati
o
n
(%
)
Figure 24. Fiber Elongation of DPL 33B Card Slivers vs. Ginning Rates, No. of Lint Cleaner, and Carding Rates (No. of test: 22396)
5.3.1.3Summary
Fibers collected after carding were individually tested and tensile property data were obtained by Mantis® single fiber tester. Statistical analyses showed that the ginning rates, number of lint cleaners, and the carding rates seemed to be significant for affecting tensile properties of STV cotton fibers, and DPL cotton fibers showed similar trend on the processing variables except ginning rate. The difference between two varieties of cotton is possibly originated from the intrinsic genetic properties of the fiber which are obtained by the differences in genes and growing environment. The increase in ginning rate in the range of the experimental design turned out to be favorable on the breaking strength, while decreased the breaking elongation. This phenomenon will be discussed in the sections of theoretical consideration. From the results about the effects of the carding rates and the number of lint cleaners, it could be considered that during opening and cleaning processes after ginning, the more and harsh actions would damage the cotton fiber more in terms of the tensile properties.
5.3.2 Before Repeated Washing and Drying of Garments
5.95 6 6.05 6.1 6.15 6.2 6.25 6.3 6.35
Low High 1 2 Low High
Ginning Rate Lint Cleaners Carding Rate
Process Condition
B
reaki
n
g
S
treng
th
(g
f)
Figure 25. Fiber Strength of STV 747 Unwashed T-shirts vs. Ginning Rates, No. of Lint Cleaner, and Carding Rates (No. of test: 34399)
12 12.5 13 13.5 14 14.5 15 15.5
Low High 1 2 Low High
Ginning Rate Lint Cleaners Carding Rate
Process Condition
Breaki
ng
E
lon
gati
on
(%
)
Figure 26. Fiber Elongation of STV 747 Unwashed T-shirts vs. Ginning Rates, No. of Lint Cleaner, and Carding Rates (No. of test: 34399)
Table 10. ANOVA for Processing Effects on Breaking Strength of Single Fibers from Various Unwashed T-shirts
GLM Procedure
Class Level Information
Class Levels Values
Gin 2 1 2
Lint 2 1 2
Card 2 1 2
Number of observation 34400
Dependent Variable: Breaking Strength (gf)
Source DF Sum of
Squares
Mean
Square F Value Pr > F
Model 3 283.7086 94.5695 22.43 <.0001
Error 34396 145003.6021 4.2157
Corrected
Total 34399 145287.3106
Root MSE 2.053220 R-square 0.0019
Dependen
t Mean 6.011048 Coeff. Var. 34.157
Source DF Type I SS Mean
Square F Value Pr > F
Gin 1 22.3876401 22.3876401 5.31 0.0212
Lint 1 107.5691590 107.5691590 25.52 <.0001