ABSTRACT
GONG,JIE. Relationship Lending and Lines of Credit for Small Business—Empirical Analysis of Relationship Lending under Lines of Credit for Small Business. (Under the direction of Douglas K. Pearce).
This thesis examines the influences of bank-borrower relationships on the terms for bank lines of credit for small business. I use the Surveys of Small Business Finances data to estimate two models: an OLS Regression explaining the premium over the prime rate and a Logistic Regression for the probability of collateral requirements. I focus on those firms with lines of credit with floating rates from commercial banks and use contract, financial, governance, industry and relationship characteristics as explanatory variables. Dun and Bradstreet (D&B) credit scores, minority status and gender are also added to previous models reported in the literature. My results are: (1) Small firms with longer market experiences will pay lower premium rates over the prime rate and firms with higher risk D&B credit scores will pay higher premiums. These results are both statistically and economically significant. However, the length of bank-borrower relationships does not have a statistically significant effect on the loan rate. Although lines of credit may provide more ‘soft-information’ on borrowers during bank-borrower relationships, banks still put more weight on credit scores and the firms’ age. (2) There is no statistically significant relationship between Relationship Characteristics and the probability of collateral requirements. Banks pay more attention to
Relationship Lending and Lines of Credit for Small Business
by Jie Gong
A thesis submitted to the Graduate Faculty of North Carolina State University
in partial fulfillment of the requirements for the degree of
Master of Arts
Economics
Raleigh, North Carolina 2010
APPROVED BY:
_______________________________ ______________________________ Karlyn Mitchell Howard D. Bondell
DEDICATION
BIOGRAPHY
ACKNOWLEDGMENTS
TABLE OF CONTENTS
LIST OF TABLES ... vi
I. INTRODUCTION ...1
II. THE RELATIONSHIP LENDING LITERATURE ...4
A. Theoretical Analysis of Relationship Lending ...4
B. Empirical Analysis of Credit Scoring and Relationship Lending ...6
a. Credit Scoring ...6
b. Empirical Analysis of Relationship Lending ...7
C. Replication of Berger and Udell (1995) ...9
a. Data Selection ...10
b. Variable Means ...10
c. Regression Results ...12
III. DATA AND VARIABLES DESCRIPTIONS ...15
IV. MODELS AND RESULTS ...23
A. Loan Rate Regression Model ...24
B. Estimates of Model of Collateral Requirements ...32
V. CONCLUSION ...37
REFERENCES ...40
LIST OF TABLES
Table 1: Variable Means (Replication) ...11
Table 2: OLS and Logistic Regression (Replication and Comparison) ...13
Table 3: Variable Description ...16
Table 4: Variable Means (weighted) ...21
Table 5: Premium over Prime Rate (Floating rate only) for loans issued under Lines of Credit from Commercial Banks—All Firms Sizes (weighted) ...25
Table 6: Premium over Prime Rate (Floating rate only) for loans issued under Lines of Credit from Commercial Banks—Total Assets over $500,000 (weighted) ...30
Table 7: Premium over Prime Rate (Floating rate only) for loans issued under Lines of Credit from Commercial Banks—Total Assets Below $500,00 (weighted) ...31
Table 8: Probability Tests on Collateral (All Types) for Loans Issued under Lines of Credit from Commercial Banks (weighted) ...33
Table 9: Probability Tests on Collateral (Accounts Receivables and/or Inventory) for Loans Issued under Lines of Credit from Commercial Banks (weighted) ...35
Table 10: Variable Means (unweighted) ...46
Table 11: Premium over Prime Rate (Floating rate only) for loans issued under Lines of Credit from Commercial Banks—All Firms Sizes (unweighted) ...47
Table 12: Premium over Prime Rate (Floating rate only) for loans issued under Lines of Credit from Commercial Banks—Total Assets over $500,000 (unweighted) ...48
Table 13: Premium over Prime Rate (Floating rate only) for loans issued under Lines of Credit from Commercial Banks—Total Assets Below $500,00 (unweighted) ...49
Table 14: Probability Tests on Collateral (All Types) for Loans Issued under Lines of Credit from Commercial Banks (unweighted) ...50
I. INTRODUCTION
Small business is an essential part of the US economy. In 2008 there were 29.6 million small businesses in the United States1. These businesses largely depend on commercial banks and other depository institutions for credit. Banks need to obtain hard and / or soft information on small firms to support their credit services. But this information may not be complete enough to eliminate the asymmetric information problems that face financial institutions. Banks solve these asymmetric information problems by collecting and analyzing data for setting loan contract elements such as interest rate premium, collateral or guarantees. It is reasonable that banks will get much information on the firms while providing financial services. However, in recent research (i.e. Berger and Udell 1989; Best and Zhang 1993; Frame, Srinivasan and Woosley 2001; Berger, Frame and Miller 2005), most financial institutions obtain ‘hard-information’, such as financial, owner, and governance characteristics of small businesses and construct credit scoring or rationing models. Most small businesses have less convincing ‘hard-information’ than big corporations. So small businesses face a difficult financial environment in which financial institutions, especially commercial banks, are reluctant to issue loans or lines of credit because of risk. On the other hand, banks may want to provide loans to those firms which have good credit records or long business relationships with one or more banks. This ‘soft-information’, such as the length of business relationships with banks may play an important role especially for those small firms seeking lines of credit.
1
As a result, the bank-borrower relationships should be included in our analysis to test whether bank-borrower relationships influence loan rates.
Banking has become a more concentrated industry over the last twenty years. At the end of 1987, the number of commercial banks in United States was 13,531, but by the end of Quarter 3 of 2009 this number had dropped to 6,815. The financial environment changed rapidly during these twenty years not only for financial institutions but also for small businesses. Nevertheless, many small businesses still have characteristics such as short market experience and questionable credit record worthiness. An important question is whether relationships with banks can overcome these handicaps to obtain credit.
Several theoretical and empirical papers focus on the bank-borrower relationship and loan interest rate, such as Diamond(1984, 1991), Sharp(1990), Berger and Udell(1992, 1995, 2002), Petersen and Rajan(1993, 1994, 1995), Boot and Thakor(1994) and Degryse and Cayseele(2000). However, results differ across studies. Diamond(1989), Petersen and Rajan(1993), Boot and Thakor(1994) and Berger and Udell(1995), conclude that the longer the relationship, the lower the interest rate firms pay, and the less likely are collateral requirements. Petersen and Rajan(1994) find no significant association between bank-borrower relationship and loan interest rate. On the other hand, Greenbaum, Kanatas and Venezia(1989), Sharp(1990), and Wilson(1993) conclude that interest rates rise with length of relationship. Degryse and Cayseele (2000) reported similar results using European data.
My analysis uses data from the 2003 Survey of Small Business Finances (SSBF) on loan interest rates and collateral requirements under lines of credits (L/Cs) issued or renewed by commercial banks to small businesses, and tests whether banks use information obtained from bank-borrower relationships to adjust the loan rate and the loan contract. The basic model comes from Berger and Udell (1995) which used the 1987 SSBF data to analyze the relationship impact on small businesses loan rates and collateral requirements.
II. THE RELATIONSHIP LENDING LITERATURE
A. Theoretical Analysis of Relationship Lending
Diamond (1984, 1991), Ramakrishnan and Thakor (1984) and Boyd and Prescott (1986) all suggest that financial intermediaries exist because they enjoy economics of scale and/or comparative advantages in the production of information about borrowers.2 More specifically, Diamond (1989) emphasizes reputation acquisition, which is an element of soft-information, and concludes that as a borrower achieves a good reputation, the interest rate falls, and the present value of rents in the future from a good reputation rises. Ramakrishnan and Thakor (1984) indicate that intermediation is shown to improve welfare if informational asymmetries are present and the information generated to rectify these asymmetries is potentially unreliable build up a theoretical model to analyze whether banks become more like capital market underwriters and offer passive transaction loans or return to their roots as relationship-lending experts. Their results indicate that as interbank competition increases, banks make more relationship loans but each has lower added value for borrowers. And capital market competition reduces relationship lending while each relationship loan has greater added value for borrowers.
From the above theoretical studies, asymmetric information does affect interest rates on loans or welfare of financial intermediates. There are several ways that banks acquire
2
information on borrowers from business relationships such as operation data and deposit accounts (Berlin and Mester 1999).
Some theoretical research has examined relationship lending and loan interest rates. Boot and Thakor (1994) demonstrated that even without learning or risk aversion the bank-borrower relationships are welfare enhancing. Another important result they found was that durable relationships made banks subsidize borrowers and, over time, collateral requirements were reduced in long-term contracting. Petersen and Rajan (1995) study the effect of credit market competition on lending relationships and conclude that young firms in concentrated markets receive more institutional finance than do similar firms in competitive markets. And financial institutions seem to smooth interest rates over the life cycle of firm in a concentrated market, charging a lower-than-competitive rate when the firm is young and higher-than-competitive rate when the firm is old.3 Boot (1999) reviewed the literature on relationship lending and discussed the concept, the way of adding value, the cost and the empirical evidence on relationship lending. This literature provided a brief picture of the essence and importance of relationship lending. And it also shows controversial effects of relationships on loan rates.
Boot and Thakor (1994), Petersen and Rajan (1995) and some others, mentioned in Boot (1999), all got positive results for bank-borrower relationships and the loan interest rate (lower loan rates). However, other research found that the relationships between banks and borrowers have zero effects (loan rates do not change) or even negative influences on loan interest rates (higher loan rates). Theoretically, Sharp (1990) demonstrated that lenders
3
subsidize borrowers in early periods and are reimbursed for this subsidy in later periods.4 More evidences for negative effects of bank-borrower relationship on loan rates are provided in empirical analyse. (i.e. Petersen and Rajan 1994; Hernández-Cánovas and Martí nez-Solano 2006; Ono and Uesugi 2009)
B. Empirical Analysis of Credit Scoring and Relationship Lending
a. Credit Scoring
Since the analysis of bank-borrower relationship and loan interest rate focuses on evaluating the credit worthiness of small businesses, credit analysis is another important resource and basis for establishing our models. According to the credit scoring research, finance, industry, governance characteristics etc. are used to compute a credit score. In our models we use those ‘hard-information’ variables to evaluate credit worthiness.
Orgler (1970) produced a credit scoring model for commercial loans using four financial measures: liquidity, profitability, leverage and activity5. Time series data on these variables and past loan performance in financial institutions allowed estimation of the model. This is the earliest credit scoring model for commercial loans and provides a good model for further research.
Based on Orgler’s (1970) general credit scoring model for commercial loans, Frame, Srinivasan, and Woosley (2001) used the data from a phone survey by the Federal Reserve
4
Berger, Allen N. and Gregory F. Udell. "Relationship Lending and Lines of Credit in Small Firm Finance." The Journal of Business, Vol. 68, No. 3 (Jul., 1995): pp. 351-381.
5
Bank of Atlanta and tested whether the use of credit scoring by large banking organizations influences the level of small-business lending and whether there are particular characteristics of the credit-scoring programs that predict their effectiveness in enhancing credit availability. Using an instrumental variables approach, they concluded that credit scoring lowers information costs between borrowers and lenders, thereby reducing the value of traditional, local bank of relationships. Further, Berger, Frame, and Miller (2005) examined the small business credit scoring model and concluded that Small Business Credit Scoring (SBCS) system significantly changed lending behavior, especially on loans for firms with total assets lower than $100,000. They found that SBCS have important effects on the small business lending behavior of banks that adopt the technology and is also associated with higher loan risk.
b. Empirical Analysis of Relationship Lending
Some studies have specifically modeled the association among the bank-borrower relationship, loan interest rate and collateral. However, the empirical results yield no consensus.
influence on the loan rate. They also tested the association between length of relationship and collateral and found that the length of relationship has significant effects on contract characteristics. That is, longer bank-borrower relationships reduce collateral requirements.
Lines of credit (L/C) are particularly important in relationship lending because they represent a forward commitment to provide working capital financing under prespecified terms.6 James (1987), Lummer and McConnel (1989), Wansley, Elayan and Collins (1992) all built models for L/Cs and found positive abnormal returns accompanying announcements of firms who got L/Cs from banks.
Empirical analysis of relationship lending has also been done using different countries’ data with different results. Elsas and Krahnen (1998) used credit-file data in Germany to test whether ‘house banks’ (have relationship with firms) have the same credit policy as ‘normal banks’ and found that, with respect to loan rates, there was no intra- or intertemporal difference. Hernández-Cánovas and Martínez-Solano (2006) estimated a regression model in which duration was the measure of bank-borrower relationships using Spanish data and they concluded that businesses with longer relationships with banks paid higher loan rates. Ono and Uesugi (2009) analyzed the collateral and personal guarantees in relationship lending for small businesses in Japan. They found that borrowers who have a long-term relationship with their main banks are more likely to pledge collateral but this result is not robust with respect to personal guarantees. Niskanen and Niskanen (2010) focused on the effect of managerial ownership on relationship lending for small businesses. They founded that agency costs involved with managerial ownership are taken into account by banks when issuing loans with
6
increases in managerial ownership initially increasing interest rates and collateral requirements. All of them use the same basic framework as Berger and Udell (1995).
Some studies focused on other ‘soft-information’, such as the distance between firms and institutions and owner characteristics. Degryse and Ongena (2005) found that loan rates decrease with the distance between the firm and the lending bank and increase with the distance between the firm and competing banks. Jimenez and Saurine (2008) analyzed the relationship between the distance and collateral. They concluded that collateral is higher for loans issued by local financial institutions and that the influence of distance is much greater for big corporations. Moreover, banks use different technologies for different distance.
Some papers add dummy variables for minority status and gender of owners. Cavalluzzo, Cavalluzzo and Wolken (1998) and Blanchflower, Levine and Zimmerman (2003) all found that racial minorities and females face higher loan rates and more collateral requirements in small business loans. Blanchard, Zhao, and Yinger (2008) reported that black-owned and Hispanic-owned firms face discrimination in interest rates when they apply for loans from financial institutions. However, none of them combine these owner characteristic with length of relationships.
C. Replication of Berger and Udell (1995)
a. Data Selection. 7
The model uses those small firms which have lines of credit from commercial banks and I get 874 observations where 434 of the firms have total assets over $500,000 and 440 less than $500,000. For the firms with floating rates that report the premium over the prime rate for their most recent loan, we finally have 370 observations, 214 and 156 firms with total assets above / below $500,000 respectively. The number of observations is not exactly the same as Berger and Udell (1995) who reported using 371 observations.
b. Variable Means.
The descriptive statistics for my sample are similar to those of Berger and Udell (1995). The definitions of variables are provided in Table 3. Two kinds of problems occurred, however. One is the method to calculate the current ratio, quick ratio, accounts receivable turnover in days, inventory turnover in days and accounts payable turnover in days. Another problem is the treatment of missing values for calculating those variables. I calculate those financial characteristic variables using the definitions from Ross (2009) which is the most common approach. For missing values the problem becomes complicated. When calculating the current ratio and quick ratio, we use current liabilities as the denominator and current assets as the numerator. There are firms where current assets are zero or missing which makes the current ratio or quick ratio zero or where current liabilities are zero or missing, which leads to more missing values for the current ratio and quick ratio. I can set the ratios to zero if the numerator is zero but cannot correct the problem of missing current assets or missing or zero on current liabilities. The basic problem seems to be that Berger and Udell (1995) keep
7
observations with zero or missing current liabilities. Table 1 shows my replication of variable means. The differences appear on CURRAT, QUICKRAT, ARTURN, INVTURN and APTURN.
* I set CURRAT and QUICKRAT as zero when missing or zero current assets or liabilities occur. Table 1. Variable Means(Replication)
Variables
All Firms Total Assets above $500,000 Total Assets below $500,000
Berger &
Udell (1995) Replication
Berger &
Udell (1995) Replication
Berger &
Udell (1995) Replication
PREM* 1.49 1.4653 1.32 1.3436 1.73 1.6322
COLLAT 0.53 0.6007 0.59 0.6429 0.47 0.5591
ARINV 0.36 0.4680 0.46 0.5530 0.25 0.3841
OTHERSEC 0.18 0.1327 0.14 0.1129 0.22 0.1750
GUAR 0.41 0.2494 0.46 0.2995 0.35 0.2000
COMPBAL 0.07 0.0584 0.09 0.0668 0.05 0.0500
LEV 0.60 0.5895 0.60 0.5948 0.59 0.5843
PROFMARG 0.12 0.0799 0.08 0.0548 0.16 0.1051
CURRAT 3.51 5.0798 2.90 3.5209 4.13 6.6126
QUICKRAT 2.52 2.8712 1.85 1.9760 3.20 3.7513
ARTURN 34.11 38.5877 42.14 49.4994 25.87 27.8249
INVTURN 103.30 83.3676 103.98 87.3327 102.62 78. 2372
APTURN 91.90 57.9694 95.53 83.3707 88.18 25.0060
TA 2331.66 2217.0900 4442.95 4292.0600 165.84 170.4259
CORP 0.55 0.5458 0.7 0.6935 0.38 0.4000
SUBS 0.16 0.1613 0.2 0.2120 0.13 0.1114
PART 0.07 0.0698 0.05 0.0553 0.08 0.0841
PROP 0.22 0.2231 0.04 0.0392 0.41 0.4045
OWNMG 0.89 0.8844 0.85 0.8548 0.92 0.9136
CONC50 0.80 0.7895 0.73 0.7304 0.86 0.8477
CONSTR 0.14 0.1418 0.13 0.1382 0.15 0.1455
SERVICES 0.16 0.2117 0.10 0.1336 0.22 0.2886
RETAIL 0.23 0.2265 0.19 0.1843 0.27 0.2682
OTHERIND 0.47 0.4199 0.57 0.5437 0.36 0.2977
AGE 14.10 13.6007 16.49 16.0806 11.66 11.1545
RELATE 11.39 11.5432 12.67 12.9437 10.08 10.2519
Number of
observations 863 874 437 434 426 440
Number of PREM available
c. Regression Results.
Table 2 shows the replication of the OLS and Logistic regression models for the premium over the prime rate and collateral respectively. The 2003 SSBF data is also used to refit the model for comparison.
Column 1 indicates the results of my replication of the OLS regression for the premium over the prime rate. There are several differences compared with Berger and Udell (1995). Both LNAGE and LNRELATE are not statistically significant although they have the same signs as Berger and Udell (1995) reports. OTHERSEC, GUAR, PTOFMARG, INVTURN and RETAIL have opposite signs compared with Berger and Udell (1995). Column 2 shows my replication of the Logistic model for the probability of collateral requirements. LNAGE and LNRELATE have negative signs and LNRELATE is significant. But PROFMARG, QUICKRAT, APTURN, CORP, SUBS, PART and CONSTR have different signs compared with Berger and Udell (1995).
Table 2. OLS and Logistic Regression (Replication and Comparison)
Variables
OLS Regression for PREM 1987
Coefficients
Logistic Regression for COLLAT 1987
Coefficients
OLS Regression for PREM
2003
Logistic Regression for COLLAT
2003 Berger and
Udell (1995) Replication
Berger and Udell
(1995) Replication Coefficient t-statistic Coefficient χ
2-statistic
INTERCEPT 2.5928* 2.0064* -2.6619* -0.8669 2.9320 5.73* -1.5887 3.8615
ARINV 0.1330 0.1399 -0.0936 -0.64
OTHERSEC -0.2440 0.2468 -0.2808 -1.44
GUAR 0.0449 -0.0236 0.0051 0.04
COMPBAL -0.0979 -0.0867 0.1439 0.65
LEV 0.1766 0.2682 1.0487* 1.9993* -0.0006 -0.45 -0.0044 2.8958
PROFMARG 0.3220 -0.4654 -0.0437 1.9348* -0.2534 -0.78 0.3421 0.4148
CURRAT 0.0057 0.0185 0.0840 0.0001 -0.0255 -5.17* -0.0301 2.5809
QUICKRAT -0.0504 -0.0339 -0.0826 0.0212 0.0379 5.35 0.0242 1.4968
ARTURN 0.0029 -0.0005 0.0032 0.0008 0.0012 0.73 -0.0035 1.6705
INVTURN 0.0005 0.0002 -0.0000 -0.0009 0.0024 2.49 0.0009 0.2760
APTURN -0.0003 -0.0003 -0.0009 0.0039 0.00003 0.03 0.0010 0.3916
LNTA -0.0457 -0.0943 0.2065* 0.1851* -0.2146 -5.30* 0.3480 27.4795*
CORP -0.6496* -0.4650 0.0648 -0.0684 0.1363 0.44 -0.2717 0.2963
SUBS -0.5389 -0.3732 0.0292 -0.3335 -0.1063 -0.36 -0.7520 2.3924
PART -0.2051 -0.4265 0.3661 0.3829 -0.0184 -0.05 -0.4791 0.6389
OWNMG 0.3218 0.4394 0.3426 0.5340 0.1848 0.40 0.4172 2.0093
CONC50 0.1972 0.0021 0.0015 0.0290 0.3086 2.07 -0.2159 0.8163
CONSTR 0.2799 0.2472 -0.2213 -0.2788 -0.0211 -0.10 0.1801 0.3000
SERVICES 0.2629 0.1774 0.1954 -1.1602 -0.1131 -0.68 0.0459 0.0296
RETAIL 0.1014 -0.2338 -0.0295 -0.4236 -0.0143 -0.07 -0.2171 0.4936
LNAGE -0.1280 -0.0121 -0.1942 -0.1733 -0.0912 -0.90 0.1091 0.4556
LNRELATE -0.1981* -0.0797 -0.2635* -0.3924* -0.1095 -1.49 -0.3047 6.5248*
R2 0.089 0.1059 0.1892
Number of Observation
371 370 863 874 597 896
Diagnostics:-2logL
My replication results indicate that LNAGE and LNRELATE do not have significant effects on the premium over the prime rate and LNRELATE has significantly negatively effects on the probability of collateral requirements when other variables are in the model.
III. DATA AND VARIABLES DESCRIPTIONS
In this part, my analysis uses data from the 2003 Survey of Small Business Finances (SSBF) sponsored by the Board of Governors of the Federal Reserve System. The 2003 SSBF contains information on 4,240 small businesses that had fewer than 500 employees and were in operation during the interview period. The data are collected by interviewing and are divided into several sections: Firm and Owner Characteristics, Financial Services Inventory, Most Recent Loans Characteristics, Institution Characteristics, Trade Credits, Capital Injections and Financial Statements. In part II I discussed several problems in replicating the Berger and Udell (1995) results. As I mentioned, the problems may come from the imputation method for missing values. The 2003 SSBF data have five implicates for missing values and I use the first type for simplification8. I restricted the model to firms where the most recent loan is a floating rate, line of credit (L/C) loan from a commercial bank9, following Berger and Udell (1995). The respondents represent a stratified random sample but the firms are not selected randomly in the survey. So we will provide both weighted and unweighted results.
Included firms satisfy these requirements: has L/C, most recent loan is a new L/C or L/C renewal, lender is a commercial bank and interest rate floats. After selection there are 896
8
The survey actually uses one method to construct the regression estimates for missing values by randomly choosing other observations. And this regression is run five times. So the missing values, which are a small part of observations, are slightly different each time. We also run the regression for other four imputations. And the results do not have significant
differences.
9
firms. Our analysis also splits the sample by total assets since the firms with total assets over $500,000 may have significant differences compared with smaller firms. There are 584 firms with total assets exceeding $500,000.
Table 3 gives the definitions of the variables I use. The variables are classified into five categories: Contract Characteristics for the most recent loan under L/C, Financial Characteristics, Governance Characteristics, Industry Characteristics and Relationship Characteristics.
Table 3. Variable Description
Variable names are from the 2003 SSBF
Variable Names Description
Contract characteristics
PREM Premium over the prime rate { PREM= MRL19}
COLLAT = 1 if loan is secured; = 0 otherwise { COLLAT=1 if MRL13=1; COLLAT = 0
otherwise }
ARINV = 1 if loan is secured by accounts receivable or inventory; = 0 otherwise { ARINV = 1 if MRL13_1T1 = 1; ARINV = 0 otherwise }
OTHERSEC = 1 if loan is secured by other than accounts receivable or inventory; = 0 otherwise { OTHERSEC = COLLAT - ARINV}
GUAR = 1 if the loan is guaranteed; = 0 otherwise { GUAR = 1 if MRL12 = 1; GUAR = 0 if
MRL12 = 2}
COMPBAL = 1 if loan requires compensating balance; = 0 otherwise { COMPBAL = 1 if MRL11
= 1; COMPBAL = 0 if MRL11 = 2}
Financial Characteristics
LEV Leverage = Total debt / Total assets { LEV = S8 / R12}
PROFMARG Profit Margin = Profit / Sales { PROFMARG = PROFIT / P2}
CURRAT Current ratio = Current assets / Current liabilities { CURRAT = ( R1+R2+R3+R4 ) /
( S2+S3 ) }
QUICKRAT Quick Ratio = ( Current assets – Inventory ) / Current liabilities { QUICKRAT = ( R1+R2+R4 ) / ( S2+S3 ) }
ARTURN Accounts receivable turnover in days = Accounts receivable / ( sales / 365 ) { ARTURN = R2 / ( P2 / 365 ) }
INVTURN Inventory receivable turnover in days = Inventory / ( cost of goods sold / 365) { INVTURN = R3 / ( P5 / 365 ) }
APTURN Accounts payable turnover in days = Accounts payable / ( cost of goods sold / 365) { APTURN = S2 / ( P5 / 365 ) }#
TA Total assets in thousands of dollars { TA = R12 / 1000 }
DBHIGH =1 if D&B credit score is in high risk level; =0 otherwise { DBHIGH=1 if A0_DB_CREDRK=1,2; =0 otherwise}
DBMED =1 if D&B credit score is in medium risk level; =0 otherwise { DBHIGH=1 if A0_DB_CREDRK=3,4; =0 otherwise}
Table 3. Variable Description (continued)
Variable Names Description
Governance characteristics
CORP = 1 if firm is a non-Subchapter S corporation; = 0 otherwise { CORP = 1 if B3 =
6,7,8,9; CORP = 0 otherwise }
SUBS = 1 if firm is a Subchapter S corporation; = 0 otherwise { SUBS = 1 if B3 = 5; SUBS
= 0 otherwise }
PART = 1 if firm is a partnership; = 0 otherwise { PART = 1 if B3 = 2,3,4; PART = 0
otherwise }
PROP = 1 if firm in a proprietorship; = 0 otherwise { PROP = 1 if B3 = 1; = 0 otherwise }
OWNMG = 1 if firm is owner managed; = 0 otherwise { OWNMG = 1 if CF_MANAGE = 1;
OWNMG = 1 otherwise }
CONC50 = 1 if at least 50% ownership is in one family; = 0 otherwise { CONC50 = 1 if CF_FAMILY = 1; CONC50 = 0 otherwise }
MINOR = 1 if at least 50% owners are in minority; = 0 otherwise { MINOR = 1 if
CF_MINOR 50; MINOR = 0 otherwise }
FEMALE = 1 if at least 50% owners are female; = 0 otherwise { MINOR = 1 if CF_FEMALE
50; MINOR = 0 otherwise }
Industry Characteristics
CONSTR = 1 if firm is in construction industry; = 0 otherwise { CONSTR = 1 if 15 A0_SIC2_FIN 19; CONSTR = 0 otherwise }
SERVICES = 1 if firm is in services industry; = 0 otherwise { SERVICES=1 if 70 A0_SIC2_FIN 89; SERVICES=0 otherwise }
RETAIL = 1 if firm is in retail industry; = 0 otherwise { RETAIL = 1 if 52 A0_SIC2_FIN 59; RETAIL = 0 otherwise }
OTHERIND = 1 if firm is in other industry; = 0 otherwise { OTHERING = 1 if CONSTR = 0 AND SERVICES = 0 AND RETAIL = 0; OTHERING = 0 otherwise }
Relationship characteristics
AGE* Number of years current owners have owned the firm { AGE = CF_FAGE }
RELATE* Length of relationship with current lender in years { RELATE = MRL8 / 12 }
# Purchase per day is replaced by cost of goods sold per day because of data availability. Same definition as
Berger and Udell (1995) and Chakravarty and Yilmazer (2009)
* A maximum limit of 30 years was applied on AGE and RELATE.
and/or inventory during financing services. So COLLAT and ARINV will be the dependent variables in our Logistic models. Our expectation is that longer bank-borrower relationships will reduce the loan rate and lessen the need of collateral.
GUAR indicates whether the loan requires a personal guarantee, cosigner or other guarantor and COMPBAL indicates a required compensating balance in a checking or saving account.
Secondly Financial Characteristics are financial ‘hard-information’, including the leverage ratio (LEV), current ratio (CURRAT), quick ratio (QUICKRAT), accounts receivable turnover in days (ARTURN), inventory turnover in days (INVTURN), accounts payable turnover in days (APTURN) and total assets (TA). Financial ratios are measures of the overall financial condition of a firm. These measures are observable and can be used to evaluate debt paying ability. Therefore, in my models, these variables will be helpful to determine the loan rate and whether collateral is pledged.
Since those financial variables do not contain all the credit information relevant to small business, D&B credit scores are added to the model in three levels. DBHIGH stands for the firms which have highest risk level while DBLOW represents the firms which have lowest risk level. And DBMED reports the rest firms which have medium level of credit risk. These variables may capture firms’ credit status in a more complete way. Moreover, since more banks use credit scoring systems to evaluate a firm’s credit abilities, I want to test whether bank-borrower relationship matters when these scores are included.
CORP stands for non-Subchapter S corporation, SUBS stands for Subchapter Corporation, PART stands for partnership and PROP stands for sole proprietorship. For owner characteristics, OWNMG indicates whether the firm is managed by the owner. CONC50 describes whether a single family owns at least 50% of the firm. MINOR indicates whether the owner belongs to a racial minority and FEMALE tells whether the owner is a female. These variables are included since different ownership characteristics may contain information about risk worthiness level, credit ability and debt paying ability. For MINOR and FEMALE, the discriminatory elements, as Cavalluzzo, Cavalluzzo and Wolken (1998) and Blanchflower, Levine and Zimmerman (2003) reported, these owner characteristics may influence loan rates and collateral requirements.
The Industry Characteristics are included as category variables which describe whether the firm is in construction (CONSTR), services (SERVICES), retail (RETAIL) or other (OTHERIND) industries. The OTHERIND includes mining, manufacturing, transportation/public utilities, wholesale trade, FIRE (finance, insurance and real estate), public administration and other unclassified industries. Different industries may have different credit cycles and debt paying abilities.
because AGE represents the public prestige in the finance market or even in the debt market but RELATE represents the private bank-borrower relationship. And this ‘soft-information’ may contain personal reputation and social relationships. So our test of the bank-borrower relationship will focus on AGE and RELATE. Further, we want to know whether the bank-borrower relationship still affects loans when the D&B credit scores have been included. Including only RELATE is not enough. The correlation between AGE and RELATE is high as expected. As Berger and Udell (1995) mentioned, both of them need to be in the model since AGE is a control variable to avoid bias. Instead of using AGE and RELATE directly, I follow Berger and Udell (1995) and use natural logarithms of 1 + AGE (LNAGE) and 1 + RELATE (LNRELATE) because the marginal effect of the fifth year of AGE or RELATE is likely to be more important than the fifteenth or twenty-fifth. For robustness tests, we will run the regression with AGE and RELATE in levels and squared.
Table 4 provides the mean of each variable for the entire sample which has the most recent loan under lines of credit from commercial banks. (Column 1) And we also split the observations by TA above or below $500,000. (Column 2 and 3)
are minorities. Female owners are only 13.88%. The model firm is a Subchapter S corporation (42.98%).
# Unweighted means will be provided in appendix.
We use two-sample proportion T-test to check whether variable means in from groups in column 2 and column 3 have statistically significant differences. PREM, LEV, APTURN, TA, AGE and RELATE do have significant differences in means.
* PREM (needs additional requirements as floating rate and under prime rate index) is available for 597, 383 and
214 observations.
Table 4. Variable Means# (Weighted)
Variables All Firms Total Assets above
$500,000
Total Assets below $500,000
PREM* 1.5029 1.2366 1.6666
COLLAT 0.4750 0.5412 0.4329
ARINV 0.2134 0.3116 0.1507
OTHERSEC 0.2617 0.2296 0.2821
GUAR 0.6088 0.6772 0.5651
COMPBAL 0.0657 0.0681 0.0642
LEV 9.9269 18.5894 3.4554
PROFMARG 0.1178 0.1352 0.1066
CURRAT 28.5419 27.2498 29.5830
QUICKRAT 24.0509 20.8654 26.6179
ARTURN 32.2906 47.9678 22.2903
INVTURN 44.7815 66.9105 30.6773
APTURN 25.4127 41.4033 15.2208
TA 1643.3600 3969.4700 160.7730
DBHIGH 0.2053 0.1847 0.2185
DBMED 0.4484 0.4421 0.4525
DMLOW 0.3385 0.3666 0.3206
CORP 0.2422 0.3569 0.1691
SUBS 0.4298 0.4230 0.4341
PART 0.0799 0.0612 0.0919
PROP 0.2480 0.1589 0.3049
OWNMG 0.9120 0.8424 0.9564
CONC50 0.8288 0.7869 0.8555
MINOR 0.0443 0.0353 0.0501
FEMALE 0.1262 0.1064 0.1388
CONSTR 0.1322 0.1699 0.1082
SERVICES 0.3532 0.2146 0.4415
RETAIL 0.1728 0.1714 0.1737
OTHERIND 0.3418 0.4442 0.2765
AGE 15.4300 16.7624 14.5807
RELATE 9.5367 11.0675 8.5610
IV. MODELS AND RESULTS
I estimate two types of models: OLS regressions for PREM and logistic regressions for the probability of COLLAT and ARINV. I then test:
i. Whether banks obtain information on a borrower during the bank-borrower relationship that affects the loan rate and collateral requirements when a credit scoring system is used.
ii. Whether banks discriminate with respect to the loan rate and collateral requirements against the firms whose owners are females or minorities.
A. Loan Rate Regression Model
My empirical analysis will first examine PREM. In this model PREM, the premium over the prime rate, is regressed on contract, finance, governance, industry and relationship characteristics. This model will provide an opportunity to test whether the length of bank-borrower relationships influence the PREM for commercial bank L/Cs.
My sample comes from the 2003 SSBF data which have both borrowers’ and lenders’ information on the most recent loan. I choose those firms that have the most recent loans under L/Cs at a floating rate tied to banks’ prime rate. All of these loans are approved by commercial banks.
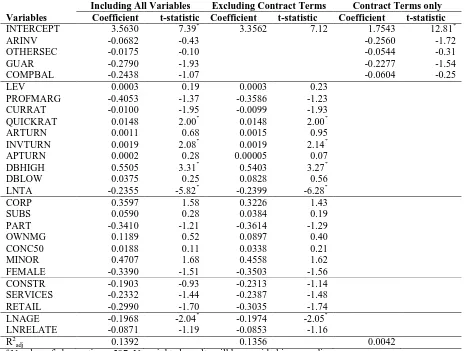
Table 5 gives the regression results of PREM for the entire sample. Column 1 indicates the whole model with all variables. Column 2 includes all the variables in column 1 except for
Contract Characteristics while Column 3 only includes Contract Characteristics. Several variables are statistically significant at the two-tailed 5% level. The interpretation of the borrower and relationship characteristics reflect their effects on PREM except for their effects on the Contract Characteristics.10 I also check whether the regression results have significant differences between two kinds of firms. An additional OLS regression is designed on PREM with original 26 variables (X), a dummy variable for firm size categories (D) and
10
interactions of original variables and the dummy (XD). My test shows that the results for two kinds of firms are significantly different.11
Table 5. Premium over Prime Rate (Floating rate only) for loans issued underLines of
Credit from Commercial Banks—All Firms Sizes#
OLS Regression for PREM--Weighted
Variables
Including All Variables Excluding Contract Terms Contract Terms only
Coefficient t-statistic Coefficient t-statistic Coefficient t-statistic
INTERCEPT 3.5630 7.39* 3.3562 7.12 1.7543 12.81*
ARINV -0.0682 -0.43 -0.2560 -1.72
OTHERSEC -0.0175 -0.10 -0.0544 -0.31
GUAR -0.2790 -1.93 -0.2277 -1.54
COMPBAL -0.2438 -1.07 -0.0604 -0.25
LEV 0.0003 0.19 0.0003 0.23
PROFMARG -0.4053 -1.37 -0.3586 -1.23
CURRAT -0.0100 -1.95 -0.0099 -1.93
QUICKRAT 0.0148 2.00* 0.0148 2.00*
ARTURN 0.0011 0.68 0.0015 0.95
INVTURN 0.0019 2.08* 0.0019 2.14*
APTURN 0.0002 0.28 0.00005 0.07
DBHIGH 0.5505 3.31* 0.5403 3.27*
DBLOW 0.0375 0.25 0.0828 0.56
LNTA -0.2355 -5.82* -0.2399 -6.28*
CORP 0.3597 1.58 0.3226 1.43
SUBS 0.0590 0.28 0.0384 0.19
PART -0.3410 -1.21 -0.3614 -1.29
OWNMG 0.1189 0.52 0.0897 0.40
CONC50 0.0188 0.11 0.0338 0.21
MINOR 0.4707 1.68 0.4558 1.62
FEMALE -0.3390 -1.51 -0.3503 -1.56
CONSTR -0.1903 -0.93 -0.2313 -1.14
SERVICES -0.2332 -1.44 -0.2387 -1.48
RETAIL -0.2990 -1.70 -0.3035 -1.74
LNAGE -0.1968 -2.04* -0.1974 -2.05*
LNRELATE -0.0871 -1.19 -0.0853 -1.16
R2adj 0.1392 0.1356 0.0042
# Number of observations=597. Unweighted results will be provided in appendix. *
Statistically significant at the 5% level two-tailed.
I estimated the three models in table 3 because I want to compare my results to those of Berger and Udell (1995) who report these three regressions for the 1987 data. The other
11
reason is that variable means of firms that have total assets above or below $500,000 have statistically significant differences. Then the effects of relationships may differ.
The primary variables of interest are DBHIGH, MINOR, FEMALE, LNAGE and LNRELATE. From column 1 of table 3, DBHIGH, the D&B credit category for high risk firms, has a positive and significant coefficient. But DBLOW does not. This means that banks use the D&B credit scoring system, at least for high risk levels, as important information to decide loan rates. The most important results are for LNAGE and LNRELATE. LNAGE is statistically significant in columns 1 and 2 with negative signs but LNRELATE is not significant given other variables in the model. Combined with D&B credit scores, this result means that banks not only used credit scores but also a firm’s age while setting loan rates. But the bank-borrower relationship does not affect PREM. As mentioned before, AGE can be considered as a representative of public market reputation. These results are different with Berger and Udell (1995) who found that AGE and RELATE significantly lowered PREM.
We also want to know whether the magnitude of DBHIGH, AGE and RELATE have economically significant influences on PREM. The coefficient of DBHIGH is 0.5505 which means that PREM will be higher by 55 basis points for firms in the high risk category compared to firms in the medium risk category. The coefficient of LNAGE is -0.1968 so that, all else equal, a small firm with additional 10 years of experience, that is 11 years versus 1 year, pays 47 basis points12 less on its L/C loan. If a firm has a high risk D&B credit scoring and has 11 years public market experience, it can expect to pay 8 basis points less for its L/C loan. Since RELATE is not statistically significant, we cannot add it into our analysis.
In order to determine whether these changes in PREM are economically important, we draw lessons from Berger and Udell (1995). The sample distribution of PREM shows that it is divisible by 25 basis points (i.e. 1.00%, 1.25%, 1.5%, etc.) and 25.46% of loan rates are on 100 basis points (2.00%). This indicates that banks group their borrowers into pricing pools on the basis of ‘hard’ and ‘soft’ information by 25-basis-point intervals. So either DBHIGH or AGE will cause big and important changes in PREM economically.
To check robustness, we use quadratic functional forms for AGE and RELATE and their natural logarithm. In second order we use AGE2, RELATE2 and AGE RELAGE13 for levels and 1/2 (LNAGE) 2, 1/2 (LNRELATE) 2 and LNAGE LNRELATE for logs. However, we do not find any statistically significant results for AGE and RELATE. In summary, there are only a few robust results on AGE and banks appear to put more weight on the credit information. The change of financial environment and concentration of banks
12
47 basis points 100 0.1968 (ln11-ln1)
13
appears to have pushed borrowers towards credit scoring systems, which has lower costs than gaining information from bank-borrower relationships, and length of public market experience.
Both MINOR and FEMALE are not significant in the weighted model. However, in the unweighted estimates14, MINOR is statistically significant with a positive sign. Unlike prior research, our result is not robust since our sample is selected non-randomly and we cannot reject the hypothesis of no association when accounting for sample weights.
There is a puzzle with respect to CURRAT and QUICKRAT. It is obvious that they are highly correlated but they have opposite signs when both of them are in the model and are statistically significant. If I remove either of them the remaining variable has a positive sign but is not significant. This problem needs to be studied further. 15
Now, let’s talk about column 3 of table 5. In this column, we test the relationship between collateral and loan risk. The results in column 3 show negative coefficients on both types of collateral which illustrate lower loan rates for secured loans. However, none of the coefficients are statistically significant either individually or jointly. So the regression results suggest that secured loans may be less risky than unsecured loans but the relationship is not that robust and strong and we do not have enough statistical power to reject the hypothesis of no association. This conclusion is opposite to that of Berger and Udell (1995) although they also had non-significant tests. On the other hand, banks may ask for collateral for riskier loans. Because of asymmetric information, banks cannot obtain complete information from
14
See table 11 in appendix.
15
financial services, credit scoring systems and bank-borrower relationships. In this situation, collateral may be a representation of a high risk borrower. That is the higher risk the borrower is the more collateral requirements maybe asked for.
The low R2s and the insignificance of many of them dependent variables indicate that the Berger and Udell (1995) model captures little of the variation in loan rates. One possible reason is that the firm characteristics are mainly used to decide whether the firm gets the loan and that only a fewer factors influence the loan rate.
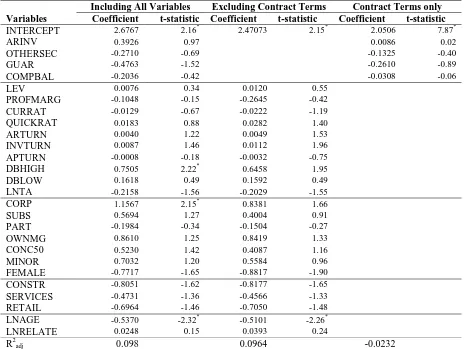
Table 6 and table 7 report OLS regressions for firms with total assets above and below $500,000 respectively. Table 6 shows the results of OLS regression on PREM for the firms with total assets above $500,000. Other than the models in table 5, AGE does not have significant results in these models. But the DBHIGH is still as significant as before. Another important result is that for the firms with total assets over $500,000, MINOR is important in setting the loan rate and minority owners pay higher loan rates by about 94 basis points. As we mentioned about the distribution of PREM before, this magnitude is economically significant. Contract Characteristics have similar coefficients as for the entire sample (in table 5), with secured loans have lower loan rates for the full model.
In addition to this, CORP is significant for the smaller firms for the full model indicates that a firm with total assets below $500,000 as a non-Subchapter S corporation will pay a higher PREM by about 116 basis points. For small firms, the limited liability may make them riskier.
Table 6. Premium over Prime Rate (Floating rate only) for loans issued underLines of
Credit from Commercial Banks—Total Assets over $500,000#
OLS Regression for PREM—Weighted
Variables
Including All Variables Excluding Contract Terms Contract Terms only
Coefficient t-statistic Coefficient t-statistic Coefficient t-statistic
INTERCEPT 2.5510 4.46* 2.3704 4.36* 1.1735 8.19*
ARINV -0.3358 -2. 45* -0.0738 -0.57
OTHERSEC -0.0314 -0.15 -0.0273 -0.14
GUAR -0.0259 -0.18 -0.0786 -0.55
COMPBAL -0.0741 -0.30 -0.1317 -0.58
LEV -0.00002 -0.02 0.0002 0.24
PROFMARG -0.2467 -0.80 -0.2961 -0.97
CURRAT -0.0204 -3.35* -0.0186 -3.08*
QUICKRAT 0.0299 3.33* 0.0273 3.07*
ARTURN -0.0033 -1.86 -0.0031 -1.81
INVTURN 0.0021 3.13* 0.0021 3.10*
APTURN 0.0019 2.48* 0.0019 2.56*
DBHIGH 0.5397 2.92* 0.4785 2.65*
DBLOW -0.0861 -0.58 -0.0080 -0.06
LNTA -0.1644 -2.83* -0.1769 -3.10*
CORP 0.0580 0.22 0.1680 0.69
SUBS -0.1970 -0.74 -0.0566 -0.23
PART -0.1229 -0.33 0.0029 0.01
OWNMG 0.0840 0.46 0.0070 0.04
CONC50 -0.2423 -1.46 -0.1737 -1.08
MINOR 0.9375 2.92* 0.9291 2.94*
FEMALE 0.1810 0.66 0.1316 0.49
CONSTR 0.5399 2.97* 0.4946 2.77*
SERVICES 0.0566 0.30 0.0996 0.54
RETAIL -0.1761 -1.02 -0.1505 -0.88
LNAGE 0.0413 0.45 0.0445 0.48
LNRELATE -0.0897 -1.18 -0.1034 -1.36
R2adj 0.1245 0.1160 -0.0090
# Number of observations = 383. Unweighted results will be provided in appendix. *
Statistically significant at 5% level, two-tailed.
Udell’s (1995) results for the 1987 SSBF data. More banks appear to use credit scoring systems to evaluate firms and make loan decisions. As the concentration of banking and increases credit scoring systems, more banks will move to these lower cost methods. As we mentioned, we only include L/C loans in our model since L/C may depend much more on ‘soft-information’ than ‘transaction-driven’ loans. But according to our results, L/C loan rates are still based much more on credit scoring systems than on the length of relationship with the lending bank.
Table 7. Premium over Prime Rate (Floating rate only) for loans issued underLines of
Credit from Commercial Banks—Total Assets Below $500,00#
OLS Regression for PREM--Weighted
Variables
Including All Variables Excluding Contract Terms Contract Terms only
Coefficient t-statistic Coefficient t-statistic Coefficient t-statistic
INTERCEPT 2.6767 2.16* 2.47073 2.15* 2.0506 7.87*
ARINV 0.3926 0.97 0.0086 0.02
OTHERSEC -0.2710 -0.69 -0.1325 -0.40
GUAR -0.4763 -1.52 -0.2610 -0.89
COMPBAL -0.2036 -0.42 -0.0308 -0.06
LEV 0.0076 0.34 0.0120 0.55
PROFMARG -0.1048 -0.15 -0.2645 -0.42
CURRAT -0.0129 -0.67 -0.0222 -1.19
QUICKRAT 0.0183 0.88 0.0282 1.40
ARTURN 0.0040 1.22 0.0049 1.53
INVTURN 0.0087 1.46 0.0112 1.96
APTURN -0.0008 -0.18 -0.0032 -0.75
DBHIGH 0.7505 2.22* 0.6458 1.95
DBLOW 0.1618 0.49 0.1592 0.49
LNTA -0.2158 -1.56 -0.2029 -1.55
CORP 1.1567 2.15* 0.8381 1.66
SUBS 0.5694 1.27 0.4004 0.91
PART -0.1984 -0.34 -0.1504 -0.27
OWNMG 0.8610 1.25 0.8419 1.33
CONC50 0.5230 1.42 0.4087 1.16
MINOR 0.7032 1.20 0.5584 0.96
FEMALE -0.7717 -1.65 -0.8817 -1.90
CONSTR -0.8051 -1.62 -0.8177 -1.65
SERVICES -0.4731 -1.36 -0.4566 -1.33
RETAIL -0.6964 -1.46 -0.7050 -1.48
LNAGE -0.5370 -2.32* -0.5101 -2.26*
LNRELATE 0.0248 0.15 0.0393 0.24
R2adj 0.098 0.0964 -0.0232
B. Estimates of Model of Collateral Requirements
In this section I test whether collateral requirements will be lower for borrowers with longer banking relationships. I use Logistic Regression to estimate the probability of a L/C being secured. Berger and Udell (1995) concluded that Relationship Characteristics have significant and negative associations with the probability of collateral being required.
There are 896 observations with L/Cs from commercial banks. COLLAT will be used as the dependent variable with financial, governance, industry and relationship characteristics as explanatory variables. I also estimate the probability of ARINV using the same procedure.
Table 8 summarizes the Logistic Regression results for all firms (column 1), firms with total assets above $500,000 (column 2) and firms with total assets below $500,000 (column 3). In column 1, the coefficients on DBHIGH and DBLOW are statistically significant. And DBHIGH is also significantly positive in the other two models. However LNAGE and LNRELATE are never significant, even when AGE and RELATE are in levels and second-order forms. These results clearly illustrate that the D&B credit scores play a more important role than age and bank-borrower relationship when banks decide whether the loans need to be secured or not. Thus, according to the Logistic models in Berger and Udell (1995) and my replications, we find different results on the probability of collateral requirements.
about 71.85%16, that is about 19.57% higher, from a mean probability of 58.28%17 to 71.85%. As we expected DBLOW has a negative sign to be significant. That is, for firms with credit scores indicating lower risk have a lower probability of pledging collaterals by 12.67%18.
Table 8. Probability Tests on Collateral (All Types)for Loans Issued under Lines of
Credit from Commercial Banks#
Logistic Regression for the Probability of COLLAT—Weighted
Variables
All Firms Total Assets above
$500,000
Total Assets below $500,000 Coefficient χ2-statistic Coefficient χ2-statistic Coefficient χ2-statistic
INTERCEPT -2.9557 18.9147* -2.2393 2.9291 -8.2876 20.3660*
LEV -0.0152 8.3143* -0.0141 7.7751* -0.0561 2.3891
PROFMARG -0.2662 0.6605 -0.3936 0.6024 0.5345 0.8422
CURRAT -0.00779 1.1737 -0.00393 0.3347 -0.0201 0.8122
QUICKRAT 0.00800 1.2300 0.00380 0.2885 0.0308 1.8147
ARTURN -0.00166 0.7661 0.000724 0.0551 -0.0106 4.3589*
INVTURN 0.00205 2.9074 0.00191 2.4952 -0.00103 0.0886
APTURN -0.00081 0.4468 -0.00226 1.6702 0.00567 1.8104
DBHIGH 0.6029 6.5212* 0.7136 3.1433* 0.8144 5.8328*
DBLOW -0.5105 5.9126* -0.7800 5.8439* -0.1526 0.2228
LNTA 0.3847 38.3476* 0.3940 7.9512* 0.7053 23.1896*
CORP -0.5371 3.1059 -1.2421 5.4952* -0.2313 0.2447
SUBS -0.9840 13.4526* -1.7791 11.9281* -0.5489 2.0833
PART -0.1707 0.1950 -1.6588 3.9877 0.5706 1.0594
OWNMG 1.4665 20.9883* 1.0082 6.5112* 4.5282 9.9275*
CONC50 -0.3574 1.9777 -0.3500 0.8528 -0.0432 0.0122
MINOR 0.2560 0.3490 -0.00439 0.0000 0.5194 0.6714
FEMALE 0.2328 0.7246 0.3753 0.7079 -0.2010 0.2314
CONSTR 0.4739 2.8641 0.4698 1.3980 0.4391 1.0215
SERVICES -0.1874 0.6712 -0.1710 0.1936 -0.00378 0.0001
RETAIL -0.3789 2.0493 -0.2054 0.2502 -0.0713 0.0284
LNAGE 0.1058 0.5369 0.1607 0.5270 0.1103 0.2576
LNRELATE 0.0697 0.4618 0.0797 0.2094 0.1231 0.7308
Number of
Observation 896 584 312
Diagnostics:-2logL 768.956 337.808 385.602
DF 22 22 22
# Unweighted results will be provided in appendix. * Statistically significant at 5% level, tow tailed.
16
The model can be transferred into a simple way that Y = α0 + α1 * DBHIGH + α2 * DBLOW + Xβ. I plug in sample means for numerical variables and use majority type of dummy variables. That is CORP=1, CONC50=1, OWNMG=1, MINOR=0, FEMALE=0 and SERVICES=1. Then prob (COLLAT|DBHIGH) = exp (-2.96+YDBHIGH) / [1+exp (-2.96+YDBHIGH)]
= 0.7185
17
Neither AGE nor RELATE are statistically significant. Leverage has significantly negative effects in both columns 1 and 2 which means that higher leverage would have lower probability of collateral requirements.19 Total assets (TA) have consistent and significant results. The coefficient of TA is positive which means larger firms will have a higher probability of pledging collateral. In Governance Characteristics, SUBS and OWNMG have consistently significant effects. This means that a Subchapter S corporation with owner managed would have a higher probability of pledging collateral. But MINOR and FEMALE do not have statistically significant coefficients.
Recall the results in column 4 of table 2. The results show that LNRELATE has significant negative effects of the probability of COLLATE when D&B credit scores categories, MINOR, FEMALES are not included. The same results come out from the weighted model (not shown). If I only drop MINOR or FEMALE, other variables do not change significantly.
Columns 2 and 3 provide the regression results for firms with total assets above or below $500,000 respectively. The outcomes are not as strong as column 1 but almost the same variables are significant as in column 1. LNAGE and LNRELATE still have positive signs and DBHIGH and DBLOW still have the expected signs. For very small businesses, collateral requirements depend mostly on credit scores, ownership and total assets.
Table 9 provides the same Logistic Regression results except that the dependent variable is the probability that the loan is secured by accounts receivable and/or inventory (ARINV). LNAGE and LNRELATE still have insignificant coefficients and the signs are not consistent.
19
Lower risk firms, as measured by DBLOW, face a lower probability of pledging collateral but the coefficient is only significant for the entire sample and this effect is not as strong as in previous models. MINOR and FEMALE also do not have significant and consistent results. OWNMG remains significant, raising the probability of collateral requirements.
Table 9. Probability Tests on Collateral (Accounts Receivables and/or Inventory)for
Loans Issued under Lines of Credit from Commercial Banks#
Logistic Regression for the Probability of ARINV—Weighted
Variables
All Firms Total Assets above
$500,000
Total Assets below $500,000 Coefficient χ2-statistic Coefficient χ2-statistic Coefficient χ2-statistic
INTERCEPT -3.0276 10.4002* -1.0666 0.4371 -11.1953 14.7302*
LEV -0.0008 0.0837 -0.0012 0.1970 -0.0895 2.5325
PROFMARG 0.5151 1.6596 0.5023 0.6824 1.8619 4.8360*
CURRAT -0.0227 1.3007 -0.0244 0.6217 -0.0008 0.0004
QUICKRAT 0.0220 1.1700 -0.0150 0.0937 0.0003 0.0000
ARTURN -0.0127 6.9337* -0.0098 2.4645 -0.0232 5.4160*
INVTURN 0.0014 0.6042 0.0021 1.1550 -0.0073 1.4496
APTURN 0.0025 1.0356 -0.0002 0.0030 0.0101 2.3711
DBHIGH 0.1245 0.1728 -1.0802 3.7170 1.3184 7.2969*
DBLOW -0.6086 4.1106* -0.3716 0.8385 -0.7908 2.1103
LNTA 0.1288 2.6493 0.1092 0.3883 0.8358 11.0799*
CORP 0.1844 0.2327 0.0552 0.0089 -0.3699 0.2915
SUBS -0.7244 3.9768* -0.7347 1.4245 -0.9614 2.9462
PART 0.6048 1.5330 -0.6959 0.3007 0.7155 1.0073
OWNMG 0.9808 4.2242* 0.7026 1.6523 5.1211 5.4756*
CONC50 -0.4659 2.0265 -0.1431 0.0820 -0.8958 2.7041
MINOR -0.9870 1.2909 0.3271 0.1104 -16.1989 0.0001
FEMALE 0.4461 1.5589 0.9121 3.3436 -0.5273 0.5053
CONSTR 0.6934 4.4334* 0.9657 4.4450* 0.5591 0.9021
SERVICES -0.8014 5.3261* -0.6260 0.9393 -0.4540 0.6506
RETAIL -0.7217 3.4653 -0.0934 0.0266 -1.2592 3.1680
LNAGE 0.2315 1.4381 -0.1512 0.2706 0.3648 1.0945
LNRELATE 0.0664 0.2097 -0.2948 1.7643 0.4812 3.8084
Number of
Observation 896 584 312
Diagnostics:-2logL 483.170 231.172 200.779
DF 22 22 22
# Unweighted results will be provided in appendix. *
Relationship Characteristics do not have statistically significant influences on collateral pledging requirements. In contrast, D&B credit scores have more effect on banks’ behavior. For Governance Characteristics, banks pay more attention to whether the firm is managed by the owner and whether the firm is a Subchapter S corporation. MINOR and FEMALE are not significant. These results differ from Berger and Udell (1995) who concluded that
V. CONCLUSION
In our empirical analysis, we examine the influences of Relationship Characteristics: firms’ age (AGE) and length of bank-borrower relationship (RELATE) on commercial loans under lines of credit. We use the 2003 SSBF data and focus on those firms with approved L/Cs at floating rates from commercial banks. The models include contract, financial, governance, industry and relationship characteristics. We also add D&B credit scores to enhance the description of borrower risk. MINOR and FEMALE are also added to describe owners.
Our results are as follows. (1) Small firms with longer market experiences will have lower premium rates over the prime rate and firms with high risk D&B credit scores will pay a higher premium. These results are both statistically and economically significant. However, length of bank-borrower relationship does not have a statistically significant association with the premium. Although L/Cs may contain more ‘soft-information’ of borrowers during bank-borrower relationships, banks still put more weight on credit scoring systems and firms’ age. (2) We do not find statistically significant relationships between Relationship Characteristics
and the probability of collateral requirements. Banks pay more attention to Financial Characteristics and ownership status. D&B credit scores play a more important role than bank-borrower relationships. (3) Minority status and gender do not have impacts on either loan rates or the probability of pledging collateral.
issued under L/Cs and the Logistic model for collateral and collateral of accounts receivable or inventories. However, my approach differs from that of the Berger and Udell (1995) in three important ways.
First, I use the 2003 SSBF data to estimate the model. The financial environment has changed rapidly over the past twenty years: more small firms entered into the market20, more financial instruments appeared and bank concentration increased. Using new data to analyze relationship lending is necessary. For the 2003 data, missing values are imputed. Different imputed values, done by regressions, result in five samples but these differ only slightly so I use the first sample.
Second, I add the variables of minority status and gender to test the impact on loan rate and collateral. As the above literature suggests, minority status and gender of owners may have significant influences on loan rates.
Third, I add Dun and Bradstreet (D&B) credit scores to Financial Characteristics. Based on the results of Frame, Srinivasan, and Woosley (2001), credit scoring could reduce the cost of information and may decrease the effects of traditional bank-borrower relationships. And more banks use credit scoring systems as their main tool, which is less costly and more convenient, to evaluate firms’ risk levels. This may be the reason that D&B credit score categories are statistically significant in both OLS and Logistic models, especially for high risk firms, but relationship length is not. These results are the same as those of Frame, Srinivasan, and Woosley (2001). Moreover, when I add variables, to the model to see whether minority status and gender affect loan rates and collateral requirements under L/Cs, I
20
find that neither have significant influences. These results are different from Cavalluzzo, Cavalluzzo and Wolken (1998), Blanchflower, Levine and Zimmerman (2003) and Blanchard, Zhao, and Yinger (2008).
Some problems and puzzles exist in my models. The sample size is small especially for the firms with total assets below $500,000. The results for CURRAT and QUICKRAT are unexplained. Although our variables are all defined reasonably and traditionally, I had trouble replicating the models of Berger and Udell (1995).
REFERENCES
Benmelech, Efraim and Nittai K. Bergman. "Collateral pricing." Journal of Financial Economics, Vol. 91 (2009): pp. 339–360.
Berger, Allen N. and Gregory F. Udell. "Collateral, Loan Quality and Bank Relationship." Journal of Monetary Economics, Vol. 25 (1990): pp. 21-42.
Berger, Allen N. and Gregory F. Udell. "Some Evidence on the Empirical Significance of Credit Rationing." The Journal of Political Economy Vol. 100, No. 5 (Oct., 1992): pp. 1047-1077.
Berger, Allen N. and Gregory F. Udell. "Relationship Lending and Lines of Credit in Small Firm Finance." The Journal of Business, Vol. 68, No. 3 (Jul., 1995): pp. 351-381.
Berger, Allen N. and Grefory F. Udell. "Small Business Credit Availability and Relationship Lending: The Importance of Bank Organizational Structure." The Economic Journal, Vol. 112, No. 477 (Feb., 2002): pp. F32-F53.
Berger, Allen N., Marco A. Espinosa-Vega, W. Scott Frame, and Nathan H. Miller. "Why Do Borrowers Pledge Collateral? New Empirical Evidence on the Role of Asymmetric Information." Federal Reserve Bank of Atlanta, Working Paper (Jul., 2007).
Berger, Allen N., W. Scott Frame and Nathan H. Miller. "Credit Scoring and the Availability, Price, and Risk of Small Business Credit." Journal of Money, Credit, and Banking, Vol. 37, No. 2 (Apr., 2005): pp. 191-222.
Berlin, Mitchell and Loretta J. Mester. "Deposits and Relationship Lending." The Review of Financial Studies, Vol. 12, No. 3 (1999): pp. 579-607.
Bester, Helmut. "Screening vs. Rationing in Credit Markets with Imperfect Information." The American Economic Review, Vol. 75, No. 4 (Sep., 1985): pp. 850-855.
Billett, Matthew T., Mark J. Flannery and Jon A. Garfinkel. "The Effect of Lender Identity on a Borrowing Firm's Equity Return." The Journal of Finance, Vol. 50, No. 2 (Jun., 1995): pp. 699-718.
Blanchard, Lloyd, Bo Zhao and John Yinger. "Do lenders discriminate against minority and woman entrepreneurs?" Journal of Urban Economics, 63 (Mar., 2008): pp: 467–497.
Blanchflower, David G., Phillip B. Levine and David J. Zimmerman. "Discrimination in the Small-Business Credit Market." The Review of Economics and Statistics Vol. 85, No. 4 (Nov., 2003): pp. 930-943.
Bolt, Wilko and Alexander F. Tieman. "Banking Competition, Risk and Regulation." The Scandinavian Journal of Economics, Vol. 106, No. 4 (Dec., 2004): pp. 783-804.
Boot, Arnoud W. and Anjan V. Thakor. "Can Relationship Banking Survive Competition." The Journal of Finance, Vol. 55, No. 2 (Apr., 2000): pp. 679-713.
Boot, Arnoud W. "Relationship Banking: What Do We Know?" Journal of Financial Intermediation, Vol. 9 (20001): pp. 7-25.
Boot, Arnoud W., Anjan V. Thakor, and Gregory F. Udell. "Secured Lending and Default Risk: Equilibrium Analysis, Policy Implications and Empirical." The Economic Journal, Vol. 101, No. 406 (May., 1991): pp. 458-472.
Carey, Mark, Mirch Post and Steven Sharp. "Does Corporate Lending by Banks and Finance Companies Differ? Evidence on Specialization in Private Debt Contracting." The Journal of Finance, Vol. 53, No. 3 (Jun., 1998): pp. 845-878.