The Quantitative Genetic Consequences
of Pleiotropy Under Stabilizing and
Directional Selection
Montgomery Slatkin* and Steven A. Frank?
“Department of Integrative Biology, University of Calijornia, Berkeley, Calijornia 94720, and tDepartment of Ecology and Evolutionary Biology, University of Calqornia, Imine, Calijornia 9271 7
Manuscript received September 1 1, 1989 Accepted for publication January 8, 1990
ABSTRACT
The independence of two phenotypic characters affected by both pleiotropic and nonpleiotropic mutations is investigated using a generalization of M. Slatkin’s stepwise mutation model of 1987. The model is used to determine whether predictions of either the multivariate normal model introduced in 1980 by R. Lande or the house-of-cards model introduced in 1985 by M . Turelli can be regarded as typical of models that are intermediate between them. We found that, under stabilizing selection, the variance of one character at equilibrium may depend on the strength of stabilizing selection on
the other character (as in the house-of-cards model) or not (as in the multivariate normal model) depending on the types of mutations that can occur. Similarly, under directional selection, the genetic covariance between two characters may increase substantially (as in the house-of-cards model) or not
(as in the multivariate normal model) depending on the kinds of mutations that are assumed to occur. Hence, even for the simple model we consider, neither the house-of-cards nor the multivariate normal model can be used to make predictions, making it unlikely that either could be used to draw general
conclusions about more complex and realistic models.
E will be concerned here with the extent to which two quantitative characters can be re- garded as evolutionarily independent. Interactions be- tween characters can arise from linkage disequili- brium of loci affecting each character, from pleiotropy
of loci affecting both characters or from selection
acting on both characters together. Linkage disequi-
librium is thought often to be unimportant for main- taining genetic correlations in populations in approx-
imate equilibrium (TURELLI 1985), a conclusion that
is supported by the recent theoretical work of HAS-
TINGS (1989) and BURGER (1989). In this paper, we
will ignore linkage disequilibrium and focus attention on the role of pleiotropic alleles.
T h e question of importance to evolutionary discus- sions is whether characters that are apparently inde- pendent, both because they are genetically uncorre- lated and because they are affected by different selec- tion pressures, can indeed be treated as independent in evolutionary models. If they can be treated inde- pendently, then it is reasonable to model the evolution
of one or a few characters separately and without
regard to the evolution of most other characters. If they cannot be treated as independent, then consid- ering some characters in isolation may yield mislead- ing conclusions.
Models of maintenance of genetic variation and
covariation in quantitative characters show that the
C;ene[ic\ 125: 207-2119 ( M a y , 1990)
extent of independence of quantitative characters de-
pends on genetic details that are not currently known.
T h e model analyzed by LANDE (1975, 1980), which
assumes a multivariate normal distribution of allelic
effects at each locus, predicts that the genetic corre- lation coefficient between two characters is sufficient
to determine their evolutionary independence. Under
these assumptions, if there is zero correlation between
two characters, the equilibrium variance of one char- acter does not depend on the intensity of stabilizing selection on the other. Further, directional selection applied to one or both characters will not change the genetic correlation between them.
In contrast, the model introduced by TURELLI
(1984, 1985), the “house-of-cards” model, reaches a
different conclusion. TURELLI (1985) showed that,
under his assumptions, if two characters are affected
by pleiotropic loci the equilibrium variance of one
character will depend on the strength of stabilizing
selection on the other even if the two characters are genetically uncorrelated at equilibrium. In each indi- vidual, both characters may be affected by pleiotropic alleles but the net effect in the population may still be
no genetic correlation between the characters. If the
house-of-cards model is a better description of the
maintenance of genetic variation, then even geneti-
cally uncorrelated characters cannot be regarded as
evolutionarily independent.
mal model of LANDE (1980) and the house-of-cards model of TURELLI (1985), represent extremes in a continuum of possible models in which genetic varia- tion is maintained by mutation-selection balance. Roughly speaking, the multivariate normal model is valid if selection affecting each allele at each locus is much weaker than mutation, and the house-of-cards model is valid when selection is much stronger than mutation (TURELLI 1984). Under the multivariate normal model there are numerous alleles in roughly equal frequencies at each locus, and under the house- of-cards model one allele at each locus is in high frequency and the others are in very low frequency. T h e important question is whether either of these extreme models makes predictions that are typical of models intermediate between them. We will show that neither model can be regarded as being typical, at least for predicting the evolutionary independence of uncorrelated characters. We reach this conclusion by considering a simple model that is intermediate be- tween the two extreme models and show that the predictions of this model are in some ways similar to those of the house-of-cards model and in some ways similar to those of the multivariate normal model. Our results represent a counterexample to claims of generality for either extreme model.
STEPWISE MUTATION MODEL OF A
PLEIOTROPIC LOCUS
We will introduce a model of pleiotropic alleles that will allow us to consider a wide range of selection intensities affecting individual alleles. This model is a generalization of SLATKIN'S (1 987) stepwise mutation model of a single quantitative character. We will con- sider a haploid locus in an infinite population and two characters with measurements x and y affected by alleles at this locus. We assume that each allele is characterized by a pair of indices i and j that indicate the contribution to each of the two characters (i, j =
0, +1, f 2 ,
. .
.). An individual carrying allele (i, j ) will have x = c,i and y = c j . For simplicity, we will ignore the environmental component. I t is easy to account for diploidy in a randomly mating population and for the presence of other loci under the assumption of linkage equilibrium.We assume that mutation can change an allele into only one of the eight adjacent allelic classes. We will consider two kinds of mutation, those that change only i or j , which we will call nonpleiotropic mutations, and those that change both i and j , which we will call
pleiotropic mutations. We assume that nonpleiotropic mutations occur at rate pl and that pleiotropic muta-
tions occur at rate p p . It will be convenient to denote the net mutation rate by p = pl
+
pLp and the fractionof nonpleiotropic mutations by v = p ] / ( p l
+
112). Ifpl,lis the frequency of the (i, j ) allele, then our assump- tions imply that after mutation
pz*,
= ('-
p)fii,J+
(p1/4)@t+1,J + p 7 - 1 . J+pl.J+I
+ p t , J - l ) (1)+
( P L ~ / ~ ) @ Z + I J + I + p z - l . l + l + p n + I , ~ - l + p i - I . l - l )where the asterisk indicates the value after mutation. This model of mutations differs from that assumed by WAGNER (1989) and allows for more flexibility in the mutation process. WAGNER assumed that each locus coded for single product that could be charac- terized by an underlying variable, y, and that pheno- typic characters were all linear functions of y. In his model, mutations affected only the value of y, and the pleiotropic effects of mutations are constrained by the functional relationship between y and the phenotypic characters as specified by the "B matrix." In terms of our model, WAGNER'S assumption is equivalent to assuming that only a subset of mutational states con- fined to a single line are possible. For example, only the mutational states identified by (i, i) for i = 0, f l , k 2 ,
. . .
are possible, which in our model is equivalent to assuming that v = 0, i.e., all mutations are pleio- tropic.We assume that stabilizing selection acts independ- ently on each character. The fitness of an individual with phenotype (x, y) is w(x, y) = exp[-x'/(2Vs,)
-
f /
(2V,)], which implies that the fitness of an individual carrying the
ij
allele iswij = exp(-s,i' - s i ' ) ( 2 )
where s, =
2 / ( 2 V s X )
and sv = c,2/(2Vsy). After selection, at the beginning of the next generation, the frequency of the (i, j ) allele iswhere ZZ, = c ( p , , , w q ) is the mean fitness.
T h e numerical results presented later were ob- tained by iterating this set of equations. In the pro- gram that carries out these iterations, we assumed a sufficiently large range, n , of allelic classes, i and j ,
that the frequencies of the outer allelic classes were all less than at equilibrium. We then iterated these equations for p,,j(-n 5 i, j 5 n ) by assuming that frequencies outside this range were zero. In the cal- culations for each set of parameter values, we used two initial conditions, in one $10," = 1 and all other
Quantitative Genetics and Pleiotropy 209
initial conditions was less than thus indicating
that the final frequencies in the iterations were close to the true equilibrium frequencies of the system of equations. We also found that increasing the bounds on the allelic classes, n , from the ones we chose had no effect on the equilibrium frequencies we found.
Nine-allele approximation: Equations 1 and 3 al-
low the prediction of allele frequencies given the mutation rates and the selection intensities. It is pos- sible to obtain approximate results by assuming that selection is sufficiently strong relative to mutation that only the nine central alleles, -1 5 i, j 5 +1, are contributing significantly to the genetic variance. As-
suming all other frequencies are zero leads to a set of three coupled quadratic equations. Our approxima- tion is a generalization of TURELLI'S (1 985) five-allele model but differs in two ways. TURELLI considered only the pleiotropic alleles (1, l ) , (1,
-
l ) , (-1, 1) and (-1, - l ) , in addition to the central allele, (0, 0), which in our notation is equivalent to assuming that = v = 0. Also, TURELLI assumed that the alleles other than the central allele are all in low frequency. We will not assume those alleles are in low frequency, making our model a generalization of SLATKIN'S (1987) model for a single character, but we will assume that the fre- quencies of alleles other than the nine central alleles are zero. Using SLATKIN'S approach here, it would be possible to include the effects of the alleles for whichi or j is k 2 , but the small increase in accuracy does not justify the extra algebra needed.
T h e assumption that only nine alleles are needed to approximate the equilibrium for the stepwise muta- tion model leads to a closed set of equations for their equilibrium frequencies. Because we have assumed that both mutation and selection are symmetric in i
and j it is reasonable to use the symmetry of the model to reduce the number of unknown allele frequencies. Therefore, we can assume that at equilibrium = p - l , o , po.1 = ~ o , - I a n d p l , ,
=PI,-,
= p-1.1 =p-I,-]
givingthree independent allele frequencies. T o simplify no- tation, we will let q1 =
PI,,,
q 2 = p0.1 and q3 =p,,,,
andnote that
p,,,,,
+
291+
2q2+
4q3 = 1. If we assume that both selection and mutation are weak forces, then we can combine Equations 1 and 3 into a single set of equations for the q's:-41
+
v( 1-
291-
2q2-
2q3)/4 -k (1-
.)(SI+
qz)/4+
q d t x ( 2 q 1-
1)+
2tyq2+
4(tx+
t y ) q 3 ] = 0+ q2[2txql
+
ty(2q2-
1)+
4 ( t x+
t y ) q 3 ] = 0-q2
+
~ ( 1 - 2ql-
2q2-
2q3)/4+
(1-
4(q1+
q2)/4 (4)- 4 3
+
"(41+
q2)/4+
(1-
.)( 1-
2q1-
2q2-
4q3)/4+
qdtx(2q1-
1)+
t y ( 2 q 2-
1)+
4(tx+
t y ) q 3 ] = 0where
tx
= s x / p and = s y / p indicate the relative strengths of selection and mutation.These three coupled quadratic equations do not have a general solution in closed form but can be solved for particular parameter values using programs such as Mathematica or Macsyma. Some results ob- tained using Mathematica are presented in Figure 1.
EQUILIBRIUM UNDER STABILIZING SELECTION
T h e first question is how the variance of one char- acter depends on the intensity of stabilizing selection on the other character. TURELLI (1985, 1988) showed that, if the assumptions of the multivariate normal model are not satisfied, there will be some dependence of equilibrium variance of one character on the other. He did not show how strong the effect is for models intermediate between the house-of-cards and multi- variate normal models and for mixtures of pleiotropic and nonpleiotropic mutations.
We have assumed complete symmetry of the muta- tion model and independence of selection on the two characters, so the genetic correlation between the characters is zero at equilibrium for any parameter values. In our numerical analysis, we assumed that the additive effects of the two loci are equal, c, = cy = c,
and fixed the values of p , the net mutation rate, and
V,, the intensity of stabilizing selection on x. We then determined how the equilibrium variance of x, var(x) depends on V,, the intensity of stabilizing selection on
J , and v, the fraction of mutations that are non- pleiotropic.
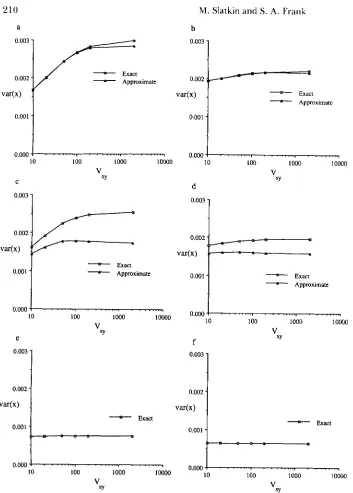
Figure 1 shows results for both the exact numerical analysis and the nine-allele approximation that illus- trate our main point. There are three pairs of results that are distinguished by different values of c. Parts a and b, c = 1, which implies that s, = 2.0 X lo-' and 5
X lo-* 2 sr 2 2.5 X so the selection intensities are both greater than p , which is in all the examples. For these parameter values, alleles other than the central allele are in very low frequency, and the results are consistent with TURELLI'S (1985) results for his five-allele model. If there are any pleiotropic mutations (v
<
l), then the var(x) does depend on V,.Figure 1 , a and b, shows that, as expected, the larger the value of v, the weaker the effect is. Surprisingly, the same pattern is found in parts c and d which were obtained when c = 0.1, for which alleles adjacent to the central allele are in higher frequency at equilib- rium. For c = 0.1, s, = 2.5 X and 5 x 2 sy 2 2.5 X In this case, the nine-allele approxima- tion described above is reasonably accurate. In parts e and f which were obtained for c = 0.02, only the exact numerical results are presented. T h e nine-allele approximation is not at all accurate for that range of parameter values.
a b
0.003
1
P
0.002 .
-
-
ExactApproximate 0.002 -
V a W . v a w
-
-
ExactApproximate
0.001 - 0.001
-
0.000-, ' ' " " . I ' ' " " " I ' ' " ' " ' 1 0.000. ' ' " " " I . , , . . . I . . ...I
10 100 1000 10000 10 100 1000
V
10000
SY
v
C
0.003
d
SY
-
0.003
-
0.002
-
0.002
-
Ya
W X ) :' .
-
A0.001
-
-
" Approximate Exact0.001
-
-
Exact" Approximate
o.ooo* ' ' . " ' I . . . ... I . . . . ..
10 100 1000 l&O o.oOOi ' ' """' ' ' ' " " " ' ' """'
V 10 100 1000 10000
SY
e
f
0.003
I
0.002
1
0.003
1
0.0024
-
Exact0.000 10
L
100 1000 10000,,I_____
10 100 1000 !0000parable to those obtained using a normal approxima- tion. In those cases, the equilibrium value of var(x) depends only slightly on V,. Therefore, we conclude that the house-of-cards approximation leads to predic- tions that are also valid if selection affecting each allele is comparable to mutation and if a substantial fraction of the mutations are pleiotropic. In contrast, predictions obtained using the normal approximation apply only when the effect of selection affecting each locus is weaker than mutation or if most mutations are nonpleiotropic.
DIRECTIONAL SELECTION
The other question of interest here is whether directional selection tends to cause a change in the
FIGURE 1 .-'The equilibriun1 vari- ance of one character, var(x), plotted as a function of the strength of stabili7,-
ing selection on the other character,
V,. I n all cases, p = 0.0001 and Vyr =
20. T h e exact results were obtained by numerically iterating Equations 1 and
3 until the maxirnum change in allele
frequency was less than IO-" per gen-
eration. The approxinlate results in
parts a-d were obtained by using the
FindKoot function in Mathematics
(WOLFRAM 1988) on a NeXT con]-
puter. Part a: c = I , u = 0.5, part b: c
= 1 , u = 0.9, part c: c = 0.1, u = 0.5,
part d: c = 0.1, u = 0.9, part e: c =
0.02, v = 0.5, and part f: c = 0.02, v =
0.9. c is the additive effect of each
allelic step and u is the fraction of non-
pleiotropic mutations.
genetic correlation between two characters. T o an- swer this question, we assumed that an equilibrium was reached between mutation and selection. Then both mutation and stabilizing selection ceased acting and directional selection in favor of larger values of x
+
y acted for 20 generations. The directional selection imposed was sufficiently strong that the previously acting forces can be ignored in the short term. To be specific, we assumed that the relative fitness of an (x,y) individual was w(x, y) = 1
+
a(x+
y), where a is the measure of the intensity of directional selection.Quantitative Genetics and Pleiotropy 21 1
a
1.0
1
0.6
r
X Y 0.4
0.2
0.0
0 10 20
generations of directional selection
r
XY
b
0.04
-
v = 0.0-
v = o sv = 0.9
0.03 =
0.02
0.01
0.00
0 10 20
generations of directional selection
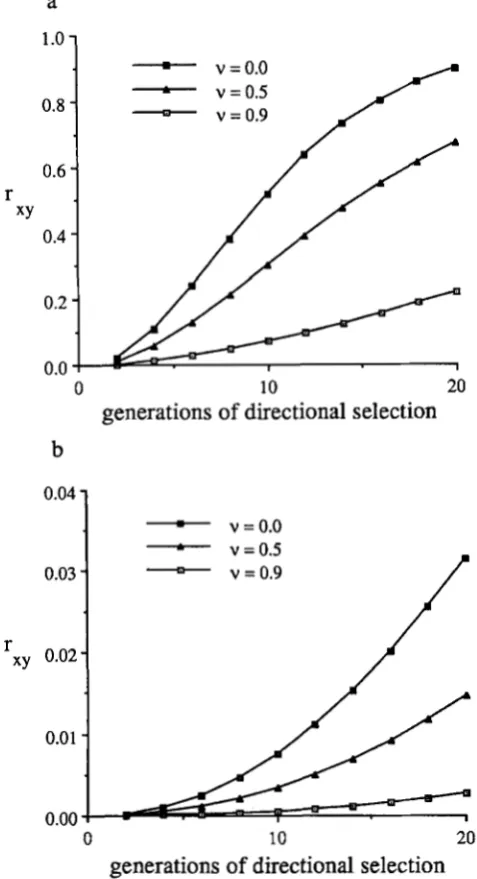
FIGURE 2.-The change in genetic correlation, Try, between two
characters during 20 generations of directional selection. In both parts, V,, = V,, = 20 and = Part a corresponds to Figure 1,
a ;md b (c = I ) , and part b corresponds to Figure 1, c and d (c =
0 . I ) . In lmth parts the equilibrium was obtained as described in the caption to Figure 1 and then directional selection of the form w(x,
y) = 1
+
n(x+
y) with n = 0.1 wds imposed.generations. As shown in Figure 2, there is a dramatic increase in rxy, the genetic correlation between the
t w o characters, when the house-of-cards approxima-
tion is valid. T h e reason is that the response to direc- tional selection is attributable primarily to the increase in frequency of the (1, 1) allele which also causes the increase in the correlation. T h e increase in r.. is much less pronounced if variation is maintained by higher frequency alleles, as shown in Figure 2b. When alleles are present in higher frequency, the response to di- rectional selection is absorbed by several of the allelic classes, making the increase in genetic correlation
much smaller. (Note the difference in vertical scales in Figure 2, a and b.)
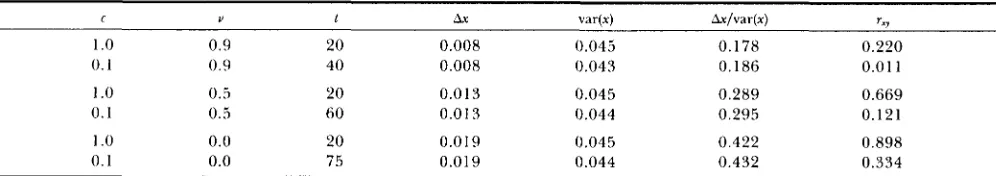
Another way to look at our numerical results is to consider the change in rxy under directional selection when changes in the mean are the same. Because the dynamics of the variances and covariances are differ- ent for different values of c and v , changes in the means after 20 generations of directional selection vary. For each case with c = 1 (the house-of-cards limit), we applied 20 generations of directional selec- tion. We then computed the change in the mean of either character relative to its standard deviation at equilibrium. T h e symmetry of our model ensures that the results for both characters are the same. Then, with c = 0.1, we applied directional selection until the relative change in the mean was approximately the same as for 20 generations under c = 1 . The results in Table 1 confirm the conclusions from Figure 2 that the increase in Try caused by directional selection is
much smaller for our intermediate model than it is in the house-of-cards limit. For some levels of pleiotropic mutations, Y, significant changes do occur, contradict-
ing the prediction of the multivariate normal model. We conclude that, for the consequences of direc- tional selection, neither the house-of-cards nor the normal approximation can predict all of the results for the intermediate model we have considered. T h e actual results for that model depend on both the strength of selection relative to mutation and the fraction of mutations that are pleiotropic.
EMPIRICAL STUDIES
Our results suggest two kinds of empirical studies that might indicate whether genetic variation is attrib- utable primarily to alleles in relatively high or rela- tively low frequencies: stabilizing selection of differing intensities and directional selection on two traits si- multaneously. We know of no studies of the effects of stabilizing selection of different strengths applied to two characters, but there have been several studies of the effect of directional selection on the genetic cor- relation between two characters. DEMPSTER, LERNER and LOWERY (1952) selected for increased egg pro- duction and found that the genetic correlation be- tween two components of egg production, egg-taying rate and survival to the end of the first laying year, increased from 0.20 in years 1-3 to 0.49 in years 8-
10. FRIARS, BOHREN and MCKEAN (1962) selected chickens for increased meat production and found a slight decrease in the genetic correlations in four pairs of component traits. SEN and ROBERTSON (1964)
found a slight increase in genetic correlation in lines selected for both increased sternopleural and abdom- inal bristles in Drosophila melanogaster. BELL (1972)
TABLE 1
A comparison o f the numerical results for directional selection in the house-of-cards limit (c = 1) and for our intermediate case ( e = 0.1) when the change in the mean relative to the equilibrium standard deviation is fixed
C Y 1 Ax var(x) Ax/var(x) r=r
1 .0 0.9 20 0.008 0.045 0.178 0.220
0 . 1 0.9 40 0.008 0.043 0.186 0.0 1 1
1 .0 0.5 20 0.013 0.045 0.289 0.669
0.1 0.5 60 0.01 3 0.044 0.295 0.121
1 .0 0.0 20 0.0 19 0.045 0.422 0.898
0.1 0.0 75 0.019 0.044 0.432 0.334
T h e model is the same as used to produce the results shown in Figure 2: c is the additive effect of each mutation; u is the fraction of mutations that are nonpleiotropic; t is the number of generations of directional selection after the equilibrium was reached; Ax is the change
i n the 111e;~n of x after t generations of directional selection; var(x) is the equilibrium standard deviation; and r, is the genetic correlation coefficient hetween the two traits. T h e value o f t for c = 0.1 was chosen so that Ax/var(x) is approximately the same for both values of c.
and pupal weights in Tribolium casteneum and found no trends in the genetic correlations.
In the most thorough study of the effects of direc- tional selection on two characters, SHERIDAN and BAR-
KER (1974) selected for four combinations of high (U)
and low (D) numbers of coxal and sternopleural bris- tles in
D.
melanogaster. They selected four replicate lines in each of four treatments, making a total of 16 experimental lines. At the end of 10 and 22 genera- tions, they computed the realized genetic correlations by performing an additional generation of selection on samples of individuals from each line. The initial average realized genetic correlation (ARGC) was 0.24k 0.08. After 10 generations, in one of the treatments (UU) the ARGC decreased to 0.15 f 0.06 and in the other three it increased to between 0.37 to 0.45. After 22 generations, one of the treatments (UD) had almost the starting ARGC while the others increased to be- tween 0.40 and 0.54.
The available evidence suggests that genetic corre- lations are affected by directional selection on two characters simultaneously, although that is not always true. A feature of the results that is difficult to explain is that directional selection on two characters simul- taneously often increases the genetic correlation be- tween them regardless of the direction of selection applied. In the SHERIDAN and BARKER (1 974) study, the genetic correlation increased in lines selected up- wards for one character and downwards for the other. If the genetic correlation increases in one treatment because of changes in the frequencies of pleiotropic alleles, then it should decrease in the opposite treat- ment. That was not found. SHERIDAN and BARKER (1 974) discuss possible developmental causes for their results.
Available studies do not provide a direct test of the theory we have developed here. Our model is of two characters that are initially uncorrelated genetically and then subject to simultaneous directional selection. If the two characters are affected by pleiotropic alleles in low frequencies, as in the house-of-cards model,
then small changes in the frequencies of those alleles will result in large changes in genetic correlations. If the two characters are affected by numerous pleio- tropic alleles in comparable frequencies, as in the multivariate normal model, then little or no change in genetic correlation would be expected.
DISCUSSION AND CONCLUSIONS
We have found that neither the house-of-cards nor the normal approximations leads to robust predictions about the evolutionary relationships of genetically uncorrelated characters affected by pleiotropic loci. A model intermediate between the two extremes makes predictions that are sometimes consistent with the those of the house-of-cards model and sometimes with those of the multivariate normal model. There- fore, neither extreme can in any sense be regarded as typical of intermediate cases.
Our results are consistent with those of WAGNER (1989) when the assumptions are comparable. WAG-
NER assumed that mutation rates are low enough that TURELLI’S (1 985) one-locus house-of-cards results could be used. Wagner found that under his assump- tions the equilibrium variance of one character is decreased by stabilizing selection on other characters and that the effect could be substantial if there are numerous characters affected by pleiotropic loci. For the case of selection much stronger than mutation, we reach the same conclusion for our model of mutation. At the present time, the forces maintaining quanti- tative genetic variation are unknown. TURELLI ( 1 988),
Quantitative Genetics and Pleiotropy 213
allele frequencies. But they are also somewhat inde- pendent.
The results described in this paper combined with the results of TURELLI (1 985) lead to testable predic- tions that could restrict the possible answers to both of these questions. If genetic variability is maintained in part by alleles that are pleiotropic, then our results suggest that imposing stabilizing selection on one char- acter may affect the variances of other characters. Only if allelic effects at different loci all have an approximately multivariate normal distribution would the variances of other characters be independent of the strength of stabilizing selection on related char- acters. This prediction does not depend on the mech- anism maintaining pleiotropic alleles in the popula- tion. Even if pleiotropic alleles are maintained in the population by forces other than mutation and stabiliz- ing selection, additional stabilizing selection on one character will alter their frequencies and hence alter the variance of the other character.
If genetic variation is maintained by pleiotropic alleles in very low frequencies as in the house-of-cards model, then directional selection would tend to in- crease the variances of characters and the genetic correlations between them. TURELLI (1988) has re- viewed the experimental literature and concluded that large increases in genetic variance are not found in the first few generations of directional selection, an observation that argues against the general applicabil- ity of the house-of-cards model. KEICHTLEY and HILL
(1988), however, show that in relatively small popu- lations, such an increase in variance might be difficult to detect. Our results lead to another prediction. If directional selection on two characters together is imposed, then pleiotropic alleles in low frequency would be expected to increase substantially the genetic correlation between those characters.
This research was supported in part by U.S. NIH Research
Grant GM40282 to M . S. and by the Miller Foundation for Basic
Research. We thank M . TURELLI and M. KIRKPATRICK for helpful
discussions of this topic.
L I T E R A T U R E C I T E D
BARTON, N. H., 1990 Pleiotropic models of quantitative variation.
Genetics 124: 773-782.
BARTON, N . H., and M. TURELLI, 1987 Adaptive landscapes,
genetic distance and the evolution of quantitative characters.
Genet. Res. 49: 157-173.
BARTON, N. H., and M. TURELLI, 1989 Evolutionary quantitative
genetics: how little d o we know? Annu. Rev. Genet. 23: 337-
370.
BELL, A. E., 1972 Divergent two-trait selection in Tribolium. Proc.
21st Ann. Natl. Breeders’ Roundtable, pp. 106-1 34.
BURGER, R., 1989 Linkage and the maintenance of heritable
variation by mutation-selection balance. Genetics 121: 175-
184.
DEMPSTER, E. R., I. M. LERNER and D. C. LOWERY, 1952
Continuous selection for egg production in poultry. Genetics
37: 693-708.
FRIARS, G. W., B. B. BOHREN and H. E. MCKEAN, 1962 Time
trends in estimates of genetic parameters in a population of
chickens subjected to multiple objective selection. Poult. Sci.
41: 1773-1784.
HASTINGS, A,, 1989 Linkage disequilibrium and genetic variances
under mutation-selection balance. Genetics 121: 857-860.
KEIGHTLEY, P. B., and W. G. HILL, 1988 Quantitative genetic
variability maintained by mutation-selection balance in finite
populations. Genet. Res. 52: 33-43.
LANDE, R., 1975 T h e maintenance of genetic variability by mu-
tation in a polygenic character with linked loci. Genet. Res. 26:
221-235.
LANDE, R., 1980 T h e genetic covariance between characters
maintained by pleiotropic mutations. Genetics 94: 203-21 5 .
SHERIDAN, A. K., and J. S. F. BARKER, 1974 Two-trait selection
and the genetic correlation. 11. Changes in the correlation
during two-trait selection. Aust. J. Biol. Sci. 27: 89-101.
SLATKIN, M., 1987 Heritable variation and heterozygosity under
a balance between mutations and stabilizing selection. Genet.
Res. 50: 53-62.
TURELLI, M., 1984 Heritable genetic variation via mutation-selec-
tion balance: Lerch’s zeta meets the abdominal bristle. Theor.
Popul. Biol. 25: 138-193.
TURELLI, M., 1985 Effects of pleiotropy on predictions concern-
ing mutation-selection balance for polygenic traits. Genetic
111: 165-195.
TURELLI, M., 1988 Population genetic models for polygenic var-
iation and evolution, pp. 60 1-6 18 in Proceedings of the Second
International Conference on Quantitative Genetics, edited by B. S.
WEIR, E. J. EISEN, M. GOODMAN, and G. NAMKOONG. Sinauer
Associates, Sunderland, Mass.
WAGNER, G. P., 1989 Multivariate mutation-selection balance
with constrained pleiotropic effects. Genetics 122: 223-234.
WOLFRAM, S., 1988 Mathemataca. Addison-Wesley, Reading, Mass.