ABSTRACT
SPRUFERA, JOHN. Task-Feedback Modal Interaction in a Visual and Auditory Task/Feedback Setting (Under the direction of Anne C. McLaughlin)
Task-Feedback Modal Interaction in a Visual and Auditory Task/Feedback Setting
by
John Fitzgerald Sprufera Jr.
A thesis submitted to the Graduate Faculty of North Carolina State University
In partial fulfillment of the Requirements for the degree of
Master of Arts
Human Factors and Applied Cognition
Raleigh, North Carolina 2016
APPROVED BY:
_________________________ ____________________________
Dr. Jason Allaire Dr. Chris Mayhorn
_________________________________ Dr. Anne C. McLaughlin
ii BIOGRAPHY
iii
TABLE OF CONTENTS
Contents
LIST OF TABLES... IV LIST OF FIGURES ... V
INTRODUCTION ...1
SPECIFIC AIMS... 1
THE PROBLEM ... 1
SENSORY MODALITIES AND MULTIPLE RESO URCE THEORY ... 2
MULTIPLE RESOURCE THEORY APPLIED TO FEEDBACK MODALITIES ... 3
WHEN IS OVERLOAD LIKELY TO OCCUR? ... 3
PREVIOUS RESEARCH: FEEDBACK-TASK INTERACTION ... 4
PREVIOUS RESEARCH: CONFLICT VS. NON-CO NFLICT ... 5
OVERVIEW OF EXPERIMENT ... 6
METHOD ...6
PARTICIPANTS ... 6
MATERIALS ... 7
SENSORY MEASURES. ... 8
WORKLOAD MEASURES... 8
COGNITIVE MEASURES. ... 9
EXPERIMENTAL TASK. ... 10
DESIGN AND PROCEDURE ... 17
RESULTS ... 19
OBJECTIVE MEASURES... 19
SUBJECTIVE MEASURES. ... 21
DISCUSSION... 22
CONCLUSIONS ... 22
LIMITATIONS AND FUTURE DIRECTIONS ... 24
REFERENCES ... 27
APPENDIX ... 29
ABILITY TESTS ... 30
iv LIST OF TABLES
v
LIST OF FIGURES
Figure 1. Screenshot of in-game stimulus……… 12
Figure 2. Overview of the grid-system when zoomed out……… 13
Figure 3. Histogram representing the frequency of average scores per participant…………. 20
Figure 4. Participant’s average performance score across trials………. 21
Figure 5. Self-rated performance of the subjects using the NASA-TLX……… 22
Figure 6. Example of the Digit Symbol Substitution Task……….. 30
Figure 7. Example of the paper folding test………. 31
Figure 8. Example of the Reverse Digit Span answer sheet……….. 32
Figure 9. Example of the Snellen Eye Chart………. 33
Figure 10. Example of a Psuedolsochromatic plate………... 34
Figure 11. Example of the NASA-TLX subjective measure of workload……….. 35
Figure 12. Example of the Video Game Questionnaire self-reported gameplay……….. 36
Figure 13. Example of “Slender” Stimulus……….. 38
Figure 14. Example of “Flyer” Stimulus………. 38
1 Introduction
Researchers have examined the use of feedback using different sensory modalities, such as sight, sound, and touch. A trend has been observed where some modes of feedback tend to outperform others, typically with auditory or tactile feedback outperforming visual (Vitense, et al., 2003, Jacko, et al., 2004, Emery, et al., 2003), though this pattern is not consistent and researchers only suggest explanations why this pattern may occur. Multiple Resource Theory (MRT) (Lu, et al., 2013, Navon & Gopher, 1979) may offer explanation as to why a user may benefit from certain feedback modes if the task and feedback are in separate modalities. In applying MRT to feedback modalities, use of feedback may be thought of as a task in itself. However, while studies have examined visual and auditory feedback, most studies used visual tasks, limiting the examination of potential resource conflict. Even within the primarily visual tasks, results show conflicting information regarding best choice in feedback. While some studies show superior performance in non-conflicting task-modality interactions, other show no such difference. Therefore, the study investigated the theory that use of feedback may be considered a secondary task, and thus best chosen using principles derived from MRT.
Specific Aims
● To investigate the application of Multiple Resource Theory to feedback design, we manipulated
the conflict between task (two levels: visual and auditory) and feedback (two levels: visual and auditory) modalities and measure performance and workload.
The Problem
2
giving a user more visual information through feedback the best choice? Or would auditory feedback offer better performance and less cognitive stress on a user?
Sensory Modalities and Multiple Resource Theory
Multiple Resource Theory (Wickens, 1984, Navon & Gopher, 1979) proposes that information processing resources is not a single pool, but several sensory resources that can be individually tapped. For instance, as a person is presented with increasingly larger degrees of visual information, it consumes more visual resources; a person attempting to monitor a radar display will have a much easier time than if they monitored four radar screens, than if they monitored sixteen radar screens, and so forth. This will negatively impact performance including accuracy or reaction time (Lu, et al., 2013, Navon & Gopher, 1979). However, as the auditory resource remains separate, an auditory task may be added with little or no impact on performance. For example, a study of pilot performance with audio feedback compared to visual feedback found that using auditory displays resulted in superior performance for flight-path tracking when compared to visual displays (Wickens et al., 2003). The flight path tracking task is a highly visually taxing task, and having a second auditory task does not impact performance nearly as much as a second visual task. Were a similar experiment conducted with an auditory task, a second visual task would prove the least detrimental to performance, while a second auditory task would create a resource conflict and lead to performance degradation.
In sum, human information processing is limited and divided into separate resources. These resources can be overloaded, especially when several modalities of information are ongoing
3
feedback interact similarly to a dual-task scenario could drive the design of feedback systems when accounting for task modality.
Multiple Resource Theory Applied to Feedback Modalities
Use of feedback could be interpreted as a separate task that requires its own set of resources during an ongoing primary task instead of information within the task itself. The concept that feedback can be viewed as a competing informational channel is touched upon in several studies where modalities of feedback were manipulated (Vitense, et al., 2003, Jacko, et al., 2004, Emery, et al., 2003). All tasks in these studies were visual and when participants were provided visual feedback their performance suffered compared to auditory or haptic conditions. Emery and colleagues surmised that this effect may have been due to the conflict between the visual nature of the task and the visual-only feedback. Feedback, therefore, can be viewed as a separate, competing information channel, and could potentially create overload and negatively impact performance when it demands the same resources as the
primary task.
When is Overload Likely to Occur?
4
the feedback effectively, even in a conflicting modality, and the conflict may appear to have no negative impact on the user.
In a meta-analysis performed by Lu and colleagues examining Multiple Resource Theory, they examined tasks that varied in complexity. They also argued that “operations in complex, data-rich domains experience visual data overload and an increased need for effective interruption management” (Lu, et al. 2013, pg. 716). Thus, complex tasks are likely to cause overload and can be used to examine resource conflicts. Providing feedback during an ongoing task can also cause overload, as task
information and feedback overlap in time. In summation, two ways to produce sensory overload for the purpose of examining resource conflicts are to utilize complex, ongoing tasks. In sum, in a scenario where a task is not cognitively challenging to a user, the task-feedback modal interaction would never impact performance. To see this impact, a task must be challenging enough to the user that resources become limited. Any task with insufficient cognitive load may not reveal any difference in task-feedback modal interaction.
Previous Research: Feedback-Task Interaction
A number of studies examined different combinations of feedback and the impact on task
5
information, the user can use modalities not required by the task, such auditory information when the task is visual. However, in many studies trimodal (auditory, visual, and haptic/tactile) feedback led to the best performance (Jacko, et al., 2004, Sun, et al., 2010, Lee et al. 2009, Lee & Spence, 2008). This does beg the question as to why, in some tasks, additional visual information provides no additional benefit to performance, but in other tasks increases it.
Previous Research: Conflict vs. Non-conflict
Despite results in favor of non-conflicting task and feedback modalities (Jacko, et al., 2004, Sun, et al., 2010, Lee, et al. 2009, Lee & Spence, 2008), performance in some visual tasks showed the best performance when participants were given visual feedback (Vitense, et al., 2002, Vitense, et al, 2003, Cockburn & Bewster, 2005). There may be types of information that are best transmitted visually. The tracking task used by Cockburn and Bewster (2005) was spatial, a trait it shared in common with Vitense’s (2003) sorting task. Additionally, Cockburn and Brewster’s visual feedback show mixed results for bimodal feedback benefits; only affected the miss rate slightly, something they note other
researchers have encountered, whereas other bimodal forms of feedback such as tactile + audio reduced the time-over-target. When Vitenese’s sorting task was used in other studies, combined auditory, tactile, and haptic information led to the best performance in one study, and combined auditory and haptic information led to the best performance in another (Jacko, et al., 2004, Emery, et al., 2003). These mixed results indicate a need to test the importance of feedback modality for various task modalities.
In the situation that one modality of feedback outperforms another regardless of conflict with task modality, matching-to-sample may serve as a reason for this observed effect. Matching-to-sample means that some stimuli are more powerful than others (Konorski, 1948). For example, if visual
6
visual, regardless of the task modality. In one study involving pigeons, symbolic successive matching-to-sample performance improved performance, performing above chance in both differential and
nondifferential conditions (Delong, Wasserman, 1981). This supports the idea that some stimulus are simply better for the task, and does not depend on resources available to the user.
In sum, while MRT may be a possible explanation for some of these results, other findings suggested that conflict between task and feedback was better. These mixed results are difficult to interpret, partially because the tasks used were almost always visual. It is difficult to conclude if a particular type of feedback was superior in certain situations, or if it was the relationship between the task and feedback modes.
Overview of Experiment
In the experiment, participants performed a complex, ongoing task while receiving feedback. The task itself was either presented visually or aurally, with both visual and aural versions of the task being equal in objectives, duration of stimuli, intensity of stimuli, and response method. The feedback was presented in either a conflicting modality with the task, a non-conflicting modality. One hypothesis is that when task and feedback are of the same modality, performance will lower, and when they are in different modalities performance will be higher, following Multiple Resource Theory. Alternatively, the best performance will be seen when task-feedback modality is matched, contradictory to Multiple Resource Theory.
Method
Participants
7
Average age was 20.28 (SD = 2.39). 21 women and 22 men participated. No participants reported color blindness.
Table 1 - Demographic information for participants. No participants reported color blindness.
Participants generally reported above average computer proficiency.
Materials1
Demographics. Participants took a demographic survey asking for their age, gender, and education
level. They were asked if they were familiar with Starcraft I or II, or any materials related to the series such as the novelization.
8
Video Game Questionnaire. Participants were asked how often they play video games, and which
video games they played. They were asked to list six video games they played most the in the past year, and give the name, number of hours played per session, the number of sessions played per month, and on which console they played the game. The survey was only concerned with the games the participant had played in the past year. Games on this questionnaire were classified by the experimenter after the experiment in terms of genre of game. This questionnaire took up to five minutes to complete,
depending on the number of games the participant played (Dye et al., 2009).
Sensory measures.
Snellen eye chart. The Snellen Eye Chart was used to measure near-visual acuity. Participants must
have normal or corrected-to-normal near vision. Participants are positioned 18 inches away from the eye chart and made to read lines of letters until they can no longer read the next line or until there are no more lines to read. This took up to two minutes to complete (Snellen, 1864).
Psuedolsochromatic plate Ishihara compatible color vision test. The Ishihara (PIP) was used to test
for color blindness. Participants were asked to look at colored plates and read numbers made from colored spots. The test was meant to detect red-green color blindness. The Ishihara took approximately two minutes to complete (Ishihara, 1990).
Workload Measures.
NASA-TLX. The NASA-TLX is a user-reported, subjective measure of six constructs of workload:
9
1986). The NASA-TLX can be taken multiple times during a single task, or through multiple sessions. Workload is comparable both within and between participants. During a validity study (Hart &
Staveland, 1988), within-participant weightings did not change significantly throughout the same task, indicating little need for reacquiring the weightings several times throughout a task.
Cognitive Measures.
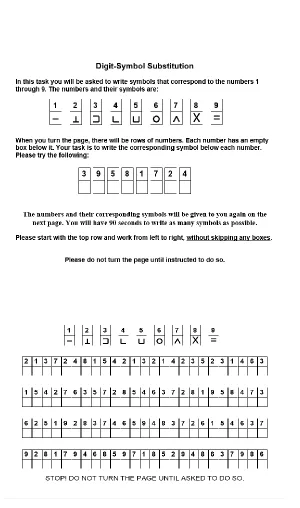
Digit symbol substitution (perceptual speed). The Digit Symbol Substitution Test (DSST) measured
perceptual speed (Royer et al., 1981). The test took approximately four minutes to fully complete including instructions. Participants were told to study symbols matched with numbers for a minute, and then asked to fill in a list of 100 items where the digit is displayed but not the symbol. An answer key remained displayed during the task. Score was calculated by the number of items correctly completed within 90 seconds.
Reverse digit span (primary memory). The Reverse Digit Span (RDS) measured primary memory
(Monaco et al., 2013). The test took approximately ten minutes to complete. During this test,
participants were told to listen to the experimenter as they said a string of numbers ranging from 3 to 7 digits in length. Participants were to wait for the instructor to finish the string before they were allowed to write down any answers. Once the instructor is finished, the participant wrote down the series of digits they heard in reverse order.
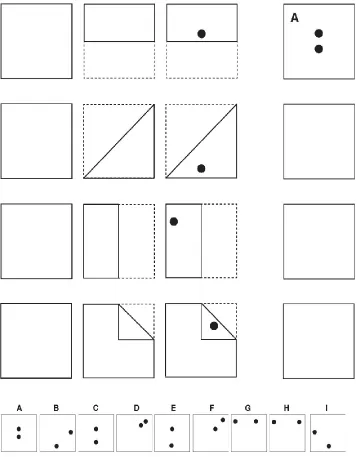
Paper Folding Test (spatial ability). The Paper Folding Test measured visual spatial ability (Ekstrom
10
Exit Interview. The exit-interview included questions about how often participants would use
feedback and how they felt their prior experience with video games impacted their performance.
Equipment. The experimental task was performed on windows laptops (1.80 GHz Pentium
Dual-Core, 1.96 GM RAM). Screen size is 19” with a resolution of 1280 x 1024 pixels and a refresh rate of 60 Hz, along with a Logitech headset.
Experimental Task.
Game Overview. During the game, the participant controlled a vehicle and receive information on
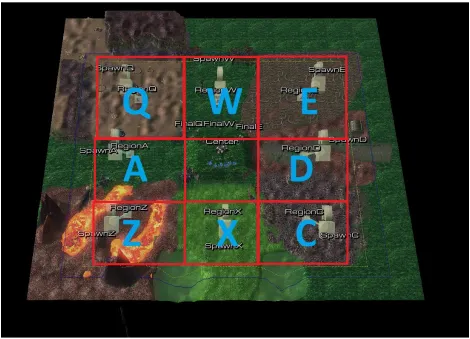
incoming stimuli that headed towards the participant’s base. The map was laid out in a 3x3 grid, with the perimeter grids each being possible locations for the stimuli to appear, and the center being the base. The participant can move instantly from one part of the grid to another by using the numpad on the keyboard, with 1-9 referring to the section of the grid they can move to. Generally, the physical position of the number on the numpad was directly mapped to which button they need press to go to that quadrant. For instance, 7 refers to the bottom-left and 6 refers to the middle-right.
The participant was given information as to which stimulus will appear. The participant needed to respond to each stimulus in a unique way. Stimulus A requires the participant to press Q, Stimulus B with W, and Stimulus C with E. During any version of the game, the stimulus will be invisible and make no sound while headed towards the base.
11
upper-left quadrant and incorrectly clicked “W” for stimulus A, they could change that response to a “Q” without it being counted against them, so long as they did not click the spacebar until then.
Visual Condition. In the visual condition, participants performed a visual task. This task had limited
12
Figure 1 – Screenshot of the in-game stimulus. In center – player-character’s vehicle. Below the
vehicle is the visual stimulus-type instruction. In the center of the glowing circle is the type of stimulus
that must be responded to. The location of the appearance corresponds to the grid where the stimulus
appears.
Stimulus instruction; stimulus position is relative to player-character, and indicates stimulus-type
13
Figure 2 – Overview of the grid-system when zoomed out. Participants will only view one part of the
grid at the time. All grids will look unique, similar to the differences between grids Q and X. The letters
14
Table 2 – Stimulus-stimulus key responses in the experimental task; see Appendix G for the visual or
auditory form of the stimulus
STIMULUS STIMULUS RESPONSE
“SLENDER” Q
“FLYER” W
“MAMMOTH” E
Auditory Condition. In the auditory condition, participants performed an auditory task. This task had
limited spatial and verbal components. The participants responded the same way in the auditory condition as they did the visual. Similar to the visual condition, in the auditory condition, participants will performed an auditory task. In the auditory game condition, participants were given control over an avatar which they can move across a grid. Every ten seconds, an auditory sound played indicating the type of stimulus, and the location. The type of stimulus was indicated by a unique sound corresponding to the visual stimulus, where a feminine voice stated the location and type of target verbally. The location was indicated verbally by the voice stating the location. For instance, top-left or center-right. The voice then stated which enemy the player was to respond to (“Mammoth” for Q, “Flyer” for W, and “Slender” for E). The participant then pressed a button on the keyboard (1-9) corresponding to the grid where the stimulus appeared. For instance, if the stimulus appears on the top right, the player pressed 1. They then responded to the type of stimulus that appears using Q/W/E (see table 1). There were a total of three stimulus that could be verbally announced, just as in the visual condition. The game lasted two minutes long.
Visual Instruction. During the visual version of the game, participants would see a radar signal to
15
example, top left radar signal indicates the stimulus would appear on the top left. At the same time, there was a visual display of which stimulus to respond to that will appear in the center of the radar signal. There was a three to four second window of opportunity to respond to the stimulus, after which it would be counted as a miss. In the visual condition, participants were always able to see the vehicle, and also be able to see the terrain the vehicle sits within. Each section on the grid had unique terrain features, such as cliffs, forests, or swamps.
Auditory Instruction. During the auditory version of the game to indicate the position of the
stimulus, a voice announced the location and name of the target. The participant was then expected to move to the proper location and make a response. While in the auditory condition, participants would always be able to hear the player-character’s vehicle. Similar to unique terrain features in the visual condition, the auditory condition will also have background music that played during the game.
Visual Feedback. When receiving visual feedback, participants would observe the vehicle make a
firing motion. If the response was successful, the vehicle fired on the target successfully, showing a missile launched at the stimulus. The invisible stimulus would appear momentarily when struck before being eliminated so the participant was aware of the creature’s elimination.
If the participant selected the wrong command to respond to the stimulus, upon hitting the spacebar, the vehicle would make a firing motion, followed by a red flash on the screen. If the
participant selected the wrong location to respond to the stimulus, the vehicle will make a firing motion, but no missile will appear and a question mark appeared over the vehicle’s head.
16
correct button which corresponded to the stimulus. Red indicated they had moved to a location where a target was not present, or that they had not pressed the correct button that corresponds to the stimulus within that region.
Auditory Feedback. When receiving auditory feedback, participants would hear the vehicle make a
firing noise. If the response was successful, the vehicle would play a series of sounds indicative of the vehicle firing, a missile being launched, and the stimulus emitting a noise when destroyed. Similar to the visual condition, the sounds were unique to each stimulus.
If the participant selected the wrong command to respond to the stimulus, the vehicle made a firing sound, followed by the start of a series of sounds, but never any sound of impact, followed by a buzzer. If the participant selected the wrong location to respond to the stimulus, the vehicle made a firing noise, no additional sound played, and a klaxon played.
Additionally, every time the participant moved location using the numpad or pressed Q/W/E, the participant would see hear one of two chimes to indicate success or unsuccess. Successful chimes indicated they had either moved to a location where a target was present, or pressed the correct button which corresponded to the stimulus. Unsuccessful chimes indicated they had moved to a location where a target was not present, or that they had not pressed the correct button that corresponds to the stimulus within that region.
Visual N-Back. The participant was also expected to additionally pay attention to numbers that
17
they should have, “fail” appeared in red text instead. The visual n-back appeared only when the game’s Visual Task condition was active. Unlike the game proper, the visual n-back’s feedback was always visual. The purpose for the visual n-back was to ensure visual overload in the visual instruction condition.
Auditory N-Back. Similar to the visual n-back, the auditory n-back had a voice (different than the
auditory voice), announce the numbers 1 through 4 at the same interval as the visual n-back’s number display. Every time the same number was announced twice in a row, the player was expected to hit shift. If the participant hit shift correctly, they heard the message “success”. If they did not, or they failed to press shift when they should have, they heard “fail” instead. The auditory n-back appeared only when the game’s Auditory Task condition was active. Unlike the game proper, the auditory n-back’s feedback was always auditory. The purpose for the auditory n-back was to ensure auditory overload in the auditory instruction condition.
Design and Procedure
Design. The design was within-participant. Independent variables include task modality (Visual,
Auditory), and feedback modality (Visual, Auditory). Another way of examining the variables is through a Task Conflict independent variable (Conflict versus Non-conflict). In the conflict condition, participants would go through a task where the task and feedback are in the same modality. In the non-conflict condition, the task and feedback modality will not be the same (for instance, visual task and auditory feedback). The dependent variables included performance and workload. Performance was measured through accuracy and response time. Workload was measured through the NASA-TLX.
Procedure. After completing an informed consent, participants completed the ability and vision
18
visual task + auditory feedback, auditory task + visual feedback, and auditory task + auditory feedback). The order was counterbalanced amongst participants. They performed each part of the task twice for a total of four minutes per condition. After completing each condition, participants were given the NASA-TLX. Finally after completing the experiment, they were given a demographics and an exit-interview and the video game questionnaire.
Dependent Measures. Multiple dependent measures were recorded by the program. These
dependent measures allowed for examination of details of individuals’ performance. Although not all the dependent measures were used for analyses, many were used to ensure no cheating occurred, such as obvious guessing or pressing too many buttons, although many cheating methods were pre-emptively designed out of the game.
Hits. Hits were the amount of times players could successfully move to, target, and eliminate a
stimuli. Having high hits indicated success at the task, however high hits does not necessarily mean high performance, as two people with equal number of hits may differ in errors made to achieve those hits. Misses are an inverse of hits and indicates that a stimulus was not correctly completed within the time frame of 3 to 4 seconds.
Incorrect Movement/Weapon. Every time a player moves to an incorrect location (1-9 keys) or
selects the wrong target (Q/W/E keys), this counter increases. If players had high incorrect weapons but low incorrect movements, we could extrapolate players had difficulty with selecting the correct weapon but not with movement selection. High incorrect movements or weapons indicated poorer
19 Results
Objective Measures
Performance Task x Feedback. To create a single performance variable, a variable was created
that factored in hits and the rate of incorrect weapons and movements compared to hits. The formula used was [The formula is Hits - ( ((40/Hits)Incorweapon.33)+((40/Hits)IncorMove.11))] for each of the four conditions. The highest possible value was 40 points, though there is no minimum possible score.
This was done to ensure those who performed well at the task but made few errors during gameplay are given a better score than those who performed similarly at the task but made far more errors.
20
Figure 3 - Histogram representing the frequency of average scores per participant. Total
performance was calculated by averaging the four conditions’ performance scores together. Results
indicate negatively skewed data.
21
Figure 4 - Participant’s average performance scores across trials. Higher indicates better with a
maximum of 40 points possible. Note that this data represents the pre-log10 transformation to give a
better indication of raw scores. There is no significant difference between performance scores.
Subjective Measures.
Workload Task x Feedback. To examine the interaction between task and feedback on the
self-22
reported performance. Notably there was a perceived difference in performance from the VV condition to VA condition where on average the VV conditioned scored higher than the VA condition.
Figure 5 - Self-rated performance of the subjects using the NASA-TLX. Lower indicates a better
self-rated performance score. On average, conflict conditions were rated the worst performance whereas
the nonconflict conditions were rated best.
Discussion
Conclusions
23
results from Jacko and colleagues (2004) found that visual feedback tended to be the poorest performer with auditory and haptic showing superior performance. It should be noted that Jacko and colleagues split participants by levels of experience (no experience, limited experience, and experienced) and found a main effect in experience level. They also indicated experienced users reacted to feedback differently than inexperienced users. This is echoed by Emery and colleagues (2003), in which the study found that unimodal feedback led to better performance for experienced users but not inexperienced users, which benefited from bimodal feedback more. It is possible that this study also may have had similar main effects in user experience or video game competency, with experienced users not benefiting from the task-feedback non-conflict due to a surplus of resources, whereas inexperienced users may have seen benefit from non-conflict.
Mental overload is one of the factors for why conflicting task modalities in a dual-task results in poorer performance. One of the principal design factors for the task used in this experiment was to induce mental overload in the participant. Without mental overload, there would be no reason to expect conflicting task-feedback modalities to impact performance over non-conflicting modalities (Navon and Gopher, 1979). Unlike dual-tasks, task-feedback interactions may not as readily affected, if at all, by overload. Dual-tasks may see the benefit of non-conflicting modal interactions without requiring an extremely mentally demanding task. The relationship between task-feedback is therefore not equivalent to a dual-task. Task-feedback may be seen as more robust to modal conflict, according to the results of this study.
24
performance was worse, whereas the VA condition’s feedback was more salient, so participants had a better understanding of their own performance. This is supported by a bivariate correlation between subjective performance and performance scores (Pearson’s Correlation = -.353, p < .001). The better an individual performed at the task, the better (smaller = higher performance) they rated their NASA-TLX performance score. As the performance variable did not show a difference within participants, we can conclude that this only affected the participants’ perceived performance.
To summarize, there is no evidence that task-feedback modal interaction occurs, at least in medium to medium-high degrees of mentally demanding tasks. On average, subjective mental demand scores were approximately 15 out of a possible 21 (M = 15.0, SD = 3.90), indicating the experimental task was typically felt to be moderately difficult at most by the majority of participants, so the effects of modal conflict in an extremely challenging task cannot be determined from this study alone. That said, those designing systems with feedback may not need pay attention to whether the task and feedback conflict, but instead should focus on other parameters to drive their design. The workload performance measure may suggest that the user may feel they perform better in non-conflict condition, so systems driven by user experience design principles may desire a non-conflict in task-feedback interaction. However, the experiment also may not have achieved the desired overload, and feedback may not have aided participants in this task.
Limitations and Future Directions
25
presented in the same verbal or spatial modalities, but overall task performance may differ between conditions.
The feedback in these scenarios may or may not have assisted their performance, but without a no feedback condition it can only be speculated. A no feedback condition in future studies could help clarify how important the feedback is for performance in this particular task. Adding an auditory task/no feedback and a visual task/no feedback condition will allow examination of important the feedback is to the participant. If the feedback does not affect performance in the current study, there would be no reason to suspect a task-feedback interaction. Another possibility is re-design the task to make feedback more important to success. For instance, the participant may need to use feedback to locate the target and is not given enough information by the task itself. This may more closely simulate devices such as GPSs, where the user may be relying heavily on the GPS to indicate future turns or distance to the destination.
A ceiling effect might have been reached in some participants, with the participant scoring nearly perfect scores with few, if any, errors. This can be further seen in the mental demand required by the task. The average mental demand was high across tasks, but not at the upper limit where we might otherwise see overload. Many participants also scored very poorly on the task and may not have understood the instructed. A task redesign making it the task more intuitive while increasing the difficulty may correct or mitigate this issue.
26
27 REFERENCES
Altinsoy, E., & Merchel, S. (2009). Audiotactile feedback design for touch screens. Haptic and Audio
Interaction Design, 136-144.
Cockburn, A., & Brewster, S. (2005). Multimodal feedback for the acquisition of small targets.
Ergonomics, 48(9), 1129-1150.
DeLong, R.E., & Wasserman, E.A. (1981). Effects of differential reinforcement expectancies on successive matching-to-sample performance in pigeons. Journal of Experimental Psychology, 7(4), 394-412.
Dye, M.W.G., Green, C.S., & Bavelier, D. (2002). The development of attention skills in action video game players. Neuropsychologia, 47(8-9), 1780-1789.
Ekstrom, R.B., French, J.W., Harman, H.H., & Derman, D. (1976). Manual for Kit of Factor-Referenced
Cognitive Tests. Princeton, NJ: Educational Testing Services.
Emery, V.K., Edwards, P.J., Jacko, J.A., Moloney, K.P., Barnard, T.K., Sainfort, F., & Scott, I.U. (2003). Toward achieving universal usability for older adults through multimodal feedback. Proceedings of the
2003 Conference on Universal Usability, 46-53.
Gao, Q., Wang, Y., Song, F., Li., Z., & Dong, X. (2013). Mental workload measurement for emergency operating procedures in digital nuclear power plants. Ergonomics, 56(7), 1070-1085.
Hart, S., & Staveland, L. (1988). Development of NASA-TLX (Task Load Index): Results of empirical and theoretical research. Human Mental Workload, 139-183.
Ishihara, S. (1998). Ishihara’s test for colour deficiencies. 38 Plates Edition. Tokyo: Kanehara and Co. Jacko, J.V., Emery, K., Edwards, P.J., Ashok, M., Barnard, L., Kongnakorn, T., Moloney, K.P., & Sainfort, F. (2004). The effects of multimodal feedback on older adults’ task performance given varying levels of computer experience. Behavior & Information Technology, 23(4), 247-264.
Konorski, J. (1959). A new method of psychological investigation of recent memory in animals. Bulletin
de l’Academic Polonaise des Sciences: Sierre des Sciences Biologiques, 7, 115-119.
Lee, J., Poliakoff, E., & Spence, C. (2009). The effect of multimodal feedback presented via a touch screen on the performance of older adults. Haptic and Audio Interaction Design, 128-135.
Lee, J., & Spence, C. (2008). Assessing the benefits of multimodal feedback on dual-task performance under demanding conditions. People and Computers: Culture, Creativity, Interaction, 1, 185-192.
28
Monaco, M.C., Caltagirone, A., Carlesimo, C., & Augusto, G. (2013). Forward and backward digit span for verbal and visuo-spatial data: Standardization and normative data from an Italian adult population.
Neurological Sciences, 34(5), 749-754.
NASA (1986). NasaTask Load Index (TLX) v. 1.0 Manual
Navon, D., & Gopher, D. (1979). On the economy of the human-processing system. Psychological
Review, 86(3), 214-255.
Oviatt, S., & Coulston, R., Lunsford, R. (2004). When do we interact multi-modally? Cognitive load and multimodal communication patterns. International Conference on Multimodal Interaction, 1, 129-136. Royer, F.L., Gilmore, G.C., & Gruhn, J.J. (1981). Normative data for the symbol digit substitution task.
Journal of Clinical Psychology, 37(3), 608-614.
Snellen, H. (1862). Probebuchstaben zur Bestimmung der Sehschärfe (P.W. van de Weijer, Utrecht). Sun, M., Ren, X., & Cao, X. (2010). Effects of multimodal error feedback on human performance on steering tasks. Journal of Information Processing, 18, 284-292.
Vitense, H.S., Jacko, J.A., & Emery, V.K. (2002). Foundation for improving interaction by individuals with visual impairments through multimodal feedback.
Vitense, H.S., Jacko, J.A., & Emery, V.K. (2003). Multimodal feedback: an assessment of performance and mental workload. Ergonomics, 46(1-3), 68-87.
30 Ability tests
Digit Symbol Substitution
31
Paper Folding Task
32
Reverse Digit Span
33
Near Vision Snellen Eye Chart
34
Psuedolsochromatic plate Ishihara compatible color vision test
35 NASA-TLX
36
Video Game Questionnaire
37
“Sonic Scourge” Stimulus and Materials
Visual Task/Visual Feedback: https://www.youtube.com/watch?v=lOlHpQnFkxo
Visual Task/Auditory Feedback: https://www.youtube.com/watch?v=mDMrBBXyhKs
Auditory Task/Auditory Feedback: https://www.youtube.com/watch?v=tFyj1J-Fons
Auditory Task/Visual Feedback: https://www.youtube.com/watch?v=AmstMV7GDPI
38
Figure 13 – Example of “Slender” Stimulus
39