ABSTRACT
KARSHENAS, AFSHIN. Tack Coat Bond Strength Evaluation Methods and Mechanistic Design of the Interface for Multilayer Asphalt Pavement. (Under the direction of Dr. Akhtarhusein A. Tayebali and Dr. Y. Richard Kim).
Asphalt pavements are layered structures with layers bonded together using tack coat materials. Several distresses including slippage and delamination are due to the failure of the interface between asphalt layers. To prevent the distresses associated with the debonding of the pavement layers, tack coat should be selected based on the state of stresses at the
interface between pavement layers. Currently, tack coats are chosen based on the
manufactures recommendation or empirical methods and there are no mechanistic methods for selection of tack coat materials and design of the interface.
In this study, the mechanisms of the development of the crescent shape slippage cracks and delamination distress in the asphalt pavement structure were investigated by viscoelastic finite element models. Besides, a mechanistic design methodology for the design of the interface between layers in the multilayer hot mix asphalt (HMA) pavement structure is presented. The presented mechanistic design methodology incorporates proper materials testing and structural analysis considering complex hot mix asphalt behavior.
During last decades, several test methods were developed by various researchers to evaluate the shear bond strength of the tack-coated interface between asphalt pavement layers. Some devices, evaluate the shear bond strength in direct shear with normal confinement and other devices, test the interface shear bond strength in direct shear without normal confining pressure or use passive confinement to evaluate the interlayer bond strength. It was found that for the design of the interface direct shear tests with normal confining pressure should be used. A methodology is presented for selecting the appropriate level of normal confinement for testing the shear bond strength of the interface between asphalt pavement layers.
The effects of the debonded pavement surface layer on the behavior of the pavement structure were illustrated and the mechanism of the slippage and delamination of the
interface, it was shown that the horizontal tensile stress in the surface layer could cause crescent tensile cracks in the surface layer. Therefore, designing of the pavement structure for tensile stress due to the braking force at the critical condition of high friction coefficient, high temperature and low speed of the braking wheel should be incorporated into the
pavement design procedure.
Despite the importance of the tack coat application on the bond strength of the asphalt interface and the long-term behavior of the pavement structure, there is no standard quality control method to ensure the proper application of tack coat in situ. In this research, two existing instruments for testing tack coats performance in the field, i.e. ATacker TM and TACKY were evaluated. The tests results of the instruments were scattered and with the current performance, the instruments were not recommended for the standard field tack coat material quality control and further improvement of the instrument are needed. It was
Tack Coat Bond Strength Evaluation Methods and Mechanistic Design of the Interface for Multilayer Asphalt Pavement
by
Afshin Karshenas
A dissertation submitted to the Graduate Faculty of North Carolina State University
in partial fulfillment of the requirements for the Degree of
Doctor of Philosophy
Civil Engineering
Raleigh, North Carolina 2015
APPROVED BY:
Dr. Akhtarhusein A. Tayebali Dr. Y. Richard Kim
Co-Chair of Advisory Committee Co-Chair of Advisory Committee
BIOGRAPHY
ACKNOWLEDGMENTS
I would like to express my deepest gratitude to my advisors Dr. Akhtarhusein A. Tayebali and Dr. Y. Richard Kim for all of their support and guidance during my doctoral studies at North Carolina State University. My sincere appreciation is extended to my committee members Dr. Murthy M. Guddati and Dr. Min Liu for valuable discussions and their great help. I also would like to extend my thanks to all graduate students and friends at the department of Civil, Construction, and Environmental Engineering for all of their help and support during my study.
I would like to acknowledge North Carolina Department of Transportation for providing financial support for this research. Without their support, this research could not have been possible.
TABLE OF CONTENTS
LIST OF TABLES ... vi
LIST OF FIGURES ... vii
Chapter 1 Introduction ...1
1.1 Background ...1
1.2 Research needs ...1
1.3 Research Objectives ...5
Chapter 2 Literature review ...6
2.1 In-situ tack coat interface bond strength evaluation method ...6
2.1.1 Louisiana Tack Coat Quality Tester (LTCQT) ...6
2.1.2 University of Texas at El Paso Pull-off Test ...11
2.2 Laboratory shear bond strength evaluation methods ...13
2.2.1 Florida DOT Shear Test ...13
2.2.2 The Ancona shear testing research and analysis (ASTRA) device...15
2.3 Factors affecting the bond strength between asphalt layers ...17
2.3.1 Surface condition: Milled versus nonmilled ...19
2.3.2 Modified emulsion versus ordinary emulsion ...19
2.3.3 Base and subgrade strength ...20
2.3.4 Surface roughness ...20
2.3.5 Tack coat Application rate ...21
Chapter 3 Mechanistic design of asphalt layers interface ...25
3.1 Predicting the shear failure of the interface and defining the failure criteria ...25
3.1.1 Shear strength prediction of asphalt layers interface ...30
3.1.2 Critical shear ratio and interface shear failure criterion ...32
3.2 Mechanistic approach for predicting tensile crack ...38
3.2.1 Tensile stress analysis in the surface layer of a pavement section ...38
3.2.2 Predicting the tensile strength of asphalt surface layer ...40
3.2.3 Tensile failure prediction due to a braking wheel...43
3.2.4 Effect of vehicle speed on the tensile failure ...44
3.2.6 Effect of friction coefficient on the tensile failure ...50
3.3 Debonded pavement analysis ...54
3.3.1 Stress distribution in the debonded pavement due to a rolling wheel ...55
3.3.2 Stress in the debonded pavement with a wheel in the braking state ...60
Chapter 4 Field tack coat bond strength evaluation ...64
4.1 Tack coat application rate test ...65
4.2 ATackerTM test ...66
4.2.1 ATackerTM tension bond strength test ...67
4.2.2 ATackerTM torsion bond strength test ...70
4.2.3 ATackerTM shear bond strength test ...72
4.2.4 Summary of ATacker TM device evaluation ...75
4.3 TACKY test ...76
4.3.1 Summary of TACKY device evaluation ...77
4.4 PATTI Test ...78
4.4.1 PATTI Test Procedure ...79
4.4.2 PATTI Test Results...81
4.4.3 Prediction of the interface shear strength between asphalt layers ...86
4.4.4 Summary of the interface shear strength perdition method ...96
Chapter 5 Conclusions and suggestions ...97
5.1 Conclusions ...98
5.2 Suggestions for Future Studies ...99
REFERENCES ...100
APPENDIX ...103
LIST OF TABLES
Table 2.1 RILEM shear tests results (original program) – Number of laboratories (p), mean
shear stress (
) and mean displacement (Δu) at maximum shear load ... 17Table 2.2 Tack coat application rates ... 22
Table 2.3 Recommended tack coat application rates ... 24
Table 3.1 Layer thicknesses and materials properties ... 26
Table 3.2 Asphalt concrete material properties ... 27
Table 3.3 Coefficients a and b for three different asphalt layers interface conditions for shear test without normal stress... 31
Table 3.4 Results of the verification test ... 41
Table 3.5 Comparison of peak tensile stress and tensile strength for 60C (140F) and 20C (68F) with the coefficient of friction of 0.55 ... 48
Table 3.6 Comparison of the peak tensile stress and tensile strength for 8 km/h (5 mph) and coefficient of friction of 0.55 at different temperatures ... 50
Table 3.7 Comparison of peak tensile stress and tensile strength at 60C with different speeds and friction coefficient ... 53
Table 3.8 Layer thicknesses and materials properties for pavement structure ... 54
Table 4.1 Measured tack coat application rates ... 66
Table 4.2 ATacker TM tension test results ... 74
Table 4.3 ATacker TM torsion test results ... 74
Table 4.4 ATacker TM shear test results ... 74
Table 4.5 Tensile bond strengths (PATTI) and stress rates of for CRS-1h ... 84
Table 4.6 Bond strengths and stress rates of tensile bond strength (PATTI) tests for CRS-2 84 Table 4.7 Stress rates for MAST shear strength tests at normal confinement of 482.6 kPa (70 psi) for CRS-2 based on tests by ... 88
Table 4.8 Stress rates for MAST shear strength tests at normal confinement of 482.6 kPa (70 psi) for CRS-1h based on tests by ... 89
Table 4.9 PATTI tensile bond strengths versus the corresponding interface shear strengths calculated for CRS-2 emulsion ... 92
LIST OF FIGURES
Figure 1.1 Distress modes at pavement interface under service conditions ... 2
Figure 1.2 Typical slippage failure ... 3
Figure 1.3 Crescent-shaped slippage crack ... 4
Figure 1.4 Delamination distress in an asphalt pavement ... 4
Figure 2.1 ATackerTM test device ... 7
Figure 2.2 Second generation LTCQT device with 14.5 cm diameter contact plate ... 8
Figure 2.3 LTCQT test procedure ... 10
Figure 2.4 Variation of mean tensile strength versus temperature for tack coats tested by LTCQT ... 11
Figure 2.5 UTEP pull-off test set-up... 12
Figure 2.6 UTEP laboratory test results for PG 64-22 asphalt binder ... 12
Figure 2.7 Florida DOT shear bond strength evaluation test device ... 14
Figure 2.8 Effect of surface condition on the shear bond strength measured by FDOT shear test device... 14
Figure 2.9 ASTRA direct shear device with normal load ... 15
Figure 2.10 RILEM trial pavement ... 15
Figure 2.11 RILEM trial section construction ... 16
Figure 2.12 Factors influencing a durable bond between layers ... 18
Figure 2.13 Effect of residual rate (CSS-1, L/m2) nested within curing time for milled and nonmilled surface with FDOT shear strength test ... 19
Figure 2.14 peak shear strength versus temperature for laboratory samples, short curing time and 0.4 MPa confining normal force ... 20
Figure 2.15 Graphical results for different interface surface condition a) surface with no treatment, b) Chipping 5/10, c) De-bitumening ... 21
Figure 2.16 Effects of residual application rates and tack coat types on interface shear strength for old HMA surface ... 23
Figure 2.17 Effects of residual application rates and tack coat types on interface shear strength for new HMA surface ... 23
Figure 2.18 Effects of residual application rates and tack coat types on interface shear strength for milled HMA surface ... 24
Figure 3.1 Cross-section of pavement structure ... 26
Figure 3.2 Typical interface layer shear strain history ... 28
Figure 3.3 Single tire normal stress distribution at the layer interface; half of the tire imprint is shown due to symmetry... 29
Figure 3.4 Single tire shear stress distribution at the layer interface; half of the tire imprint is shown due to symmetry ... 29
Figure 3.5 Single tire footprint used in LVECD program and location of maximum shear stress, normal stress, and critical shear ratio ... 30
Figure 3.7 (a) Shear ratio profile, (b) shear ratio contour under the tire at layer interface; half of the tire imprint is shown due to symmetry ... 35 Figure 3.8 Shear ratio, shear and normal stresses in longitudinal direction under central axis
of the tire at layer interface ... 35 Figure 3.9 Stresses at the surface of pavement due to a braking wheel, v=8 km/h (5 mph),
0.55 friction coefficient and 60C (140F), (Tensile stress is negative). ... 39 Figure 3.10 Schematic failure modes at the interface and in the surface layer. ... 40 Figure 3.11 Results of the tensile strength verification tests and the model tensile strength
prediction ... 41 Figure 3.12 Tensile strength mastercurve as a function of the reduced strain rate (crosshead
and LVDT) at 25C (77F) ... 42 Figure 3.13 Tensile strength of asphalt concrete mixture at 25C (77F) versus strain rate,
based on Li et al (2012) calculated by Equation (6). ... 42 Figure 3.14 Typical tensile strain history at the surface of the pavement in the central
longitudinal axis of the tire imprint and bilinear calculation of the strain rate. ... 43 Figure 3.15 Horizontal stress (σyy) on the surface of the pavement due to braking wheel. .... 45
Figure 3.16 Tensile strength and maximum tensile stress with respect to speed at (a) 60C (140F)and (b) 20C (68F). ... 46 Figure 3.17 Location of the maximum tensile and maximum compression stresses at the
surface of the pavement in the central longitudinal axis of the tire imprint. ... 47 Figure 3.18 Horizontal stress (σyy) on surface of the pavement due to a braking wheel. ... 49
Figure 3.19 Tensile strength and tensile stress versus temperature. ... 49 Figure 3.20 Horizontal stress (σyy) in the surface of a pavement due to the shear force of a
braking wheel. ... 51 Figure 3.21 Tensile strength and tensile stress with respect to the friction coefficient. ... 51 Figure 3.22 Horizontal stress (σyy) on surface of the pavement due to braking tire at 60C
with different friction coefficient and speed. ... 52 Figure 3.23 Principal horizontal stress on the surface of the pavement with a bonded interface
due to a braking wheel at 60°C (140°F), 8 km/hr (5 mph) and friction coefficient of 0.55, half of the tire imprint is shown due to symmetry. ... 53 Figure 3.24 Cross-section of the pavement structure with a debonded surface layer... 54 Figure 3.25 Stresses on the surface of the debonded pavement in the central longitudinal axis
of the wheel imprint due to the rolling wheel, 8 km/h (5 mph) and 60°C (140°F). ... 55 Figure 3.26 Principal horizontal stress on the surface of the pavement with the debonded
interface due to a rolling wheel at 8 km/hr (5 mph) and at 60°C (140°F), half of the tire imprint is shown due to symmetry. ... 56 Figure 3.27 Stress distribution at the interface of debonded pavement layers due to a rolling
wheel in the central longitudinal axis of tire, 8 km/h (5 mph) and 60°C (140°F). ... 57 Figure 3.28 Horizontal stresses (σyy) at the top (surface) and bottom (interface) of the
Figure 3.30 Stresses at the surface of the pavement due to a rolling wheel on the bonded pavement at the central longitudinal axis of the wheel, 60°C (140°F).speed of 8 km/h
(5 mph). ... 59
Figure 3.31 Stresses at interface due to a rolling wheel on bonded pavement at the central longitudinal axis of the tire imprint, 60°C (140°F) and 8 km/h (5 mph). ... 60
Figure 3.32 Stresses on the surface of the debonded pavement due to a braking wheel at the central longitudinal axis of the tire, 60°C (140°F), 8 km/h (5 mph) and 0.55 friction coefficient. ... 61
Figure 3.33 Principal horizontal stress on the surface of the pavement with the debonded interface due to a braking wheel at 60°C (140°F), 8 km/hr (5 mph) and friction coefficient of 0.55, half of the tire imprint is shown due to symmetry. ... 62
Figure 3.34 Stresses at the interface of the debonded pavement due to a braking wheel at the central longitudinal axis of the wheel, 60°C (140°F), 8 km/h (5 mph) and 0.55 friction coefficient ... 63
Figure 3.35 Premature slippage failure with crescent-shaped cracks after one day of traffic 63 Figure 4.1 Test location: (a) photograph and (b) bird’s eye view. ... 64
Figure 4.2 Steel plates placed on the surface of asphalt pavement for measurement of tack coat application rate; (a) before tack coat application and (b) after tack coat application. ... 65
Figure 4.3 Distributed tack coat on the existing asphalt surface. ... 66
Figure 4.4 Procedure of ATackerTM device tensile bond strength test. ... 69
Figure 4.5 ATackerTM torsion test setup. ... 71
Figure 4.6 ATacker TM shear bond strength setup. ... 73
Figure 4.7 ATacker TM In situ tack coat bond strength test results. ... 75
Figure 4.8 TACKY test device. ... 76
Figure 4.9 (a) Type IV self-alignment adhesion tester (PATTI instrument) and (b) schematic of PATTI test instrument piston ... 79
Figure 4.10 Tack coat emulsion applied on aluminum plate with pullout stubs in the environmental chamber. ... 81
Figure 4.11 Failure mode of the PATTI test samples (i.e., cohesion failure of the emulsion). ... 82
Figure 4.12 PATTI tensile bond strength results for CRS-2 and CRS-1h emulsions versus temperature with emulsion application rate of 0.18 L/m2 (0.04 gal/yd2) on an aluminum plate... 82
Figure 4.13 Tensile stress versus time at four temperatures of 5C, 19C, 35C, and 53C with emulsion application rate of 0.18 L/m2 (0.04 gal/yd2 ) CRS-1h. ... 83
Figure 4.14 PATTI tests prediction Equations. ... 85
Figure 4.16 Typical stress rate calculation by chord method for CRS-2 emulsion at overhead strain rate of 5.08 mm/min (0.2 in/min), confinement pressure of 482.6 kPa (70 psi)
Based on tests by ... 88
Figure 4.17 Stress rate and Strain rate relationship at different temperatures for CRS-2 emulsion at normal confinement pressure of 482.6 kPa (70 psi). ... 89
Figure 4.18 Stress rate and Strain rate relationship at different temperatures for CRS-1h emulsion at normal confinement pressure of 482.6 kPa (70 psi). ... 90
Figure 4.19 Interface shear strength versus tensile bond strength. ... 94
Figure 4.20 Interface shear strength versus tensile bond strength for CRS-2 emulsion. ... 95
Chapter 1
Introduction
1.1
Background
Asphalt pavements are layered structures with layers bonded together using a tack coat. A strong interlayer bond and the resulting shear transfer due to wheel loads are critical to the distribution of the stresses throughout the pavement structure. In contrast, the lack of interface bonding may lead to several types of premature distress, such as slippage cracking, top-down cracking, premature fatigue cracking, and delamination, which can prevent the pavement from serving as a monolithic structure.
Good understanding of the stress distribution along the bonded interface and the parameters that affect the interface behavior are critical for designing a durable pavement structure. Therefore, a study of the interface bond strength and failure mechanism is needed to extend the service life of the pavements structures and will be beneficial to states highway agency.
1.2
Research needs
Current pavement design methods lack a systematic and mechanistic approach to the design of pavement layer interfaces. The selection of a tack coat as the bonding material is based on empirical methods and the manufacturers’ recommendations. To develop an acceptable design method, a reliable analysis procedure and an associated test method(s) are needed to determine the interface shear strength between the pavement layers.
The need for a standard test method to evaluate the interface shear strength has led to extensive research over the last decade throughout the world. Various researchers have shown that parameters such as normal stress, temperature, load application rate, tack coat type and application rate, aggregate gradation and compaction of asphalt layers, binder type and surface roughness, to name a few, affect the interlayer bond strength ( Mohammad et al. 2012, Canestrari et al. 2013 and Raab et al. 2009). Among these parameters, the effect of temperature on interface strength is well known, but the extent of the effect of normal stress is under debate (Raab et al. 2009).
Figure 1.1 Distress modes at pavement interface under service conditions (Mohammad et al. 2012 and Raab et al. 2004).
The poor performance of different tack coat materials as the bonding agent between asphalt layers is an important parameter that can cause premature distresses in a pavement structure such as slippage and delamination. Therefore, it is necessary to develop a proper construction quality control and quality assurance procedure for existing HMA surface preparation before overlay construction, (Chen, 2010).
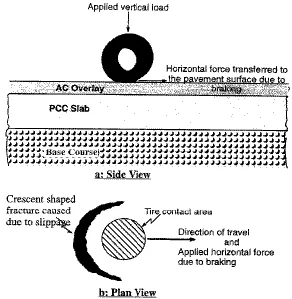
(Tayebali et al., 2004). According to Chen (2010), slippage cracks are possibly due to improper tack coat application.
Figure 1.2 Typical slippage failure (Tayebali et al., 2004 and Mukhtar et al., 1996).
Figure 1.3 shows a slippage crack in a pavement section. To predict the slippage failure in the surface layer for a multilayer pavement structure, calculation of the stress
Figure 1.3 Crescent-shaped slippage crack (National Association of Australian State Road Authorities, 1987).
Figure 1.4 shows delamination distress in an asphalt concrete pavement section. According to the National Association of Australian State Road Authorities (1987), delamination is the loss of a discrete area of the surface layer of the asphalt pavement that shows clear delineation of the surface layer from the layer below. Generally, delamination distress happens in the wheel path as shown in Figure 1.4.
1.3
Research Objectives
A primary objective of this study is to develop a mechanistic approach for designing the pavement interface and predicting the failure and slippage of the overlay in multilayer pavement structures. To predict the interface failure in multilayer pavement structures, the strength of the interface should be measured and proper tests methods should be
implemented to characterize the parameters for bonding between two asphalt concrete layers. Parameters obtained using the proposed test methods will provide the necessary inputs for the design model.
A better understanding of the strength of the bond between the top surface layer and the underlying asphalt layer, along with a better understanding of the stresses that act along the interface and in the pavement layers will help to develop the mechanistic interface design.
Chapter 2
Literature review
In this section, some of the laboratory and field tests methods for tack coat bond strength evaluation and interface shear strength measurement are summarized, and factors that affect the asphalt layers interface behavior and shear strength are presented.
2.1
In-situ tack coat interface bond strength evaluation method
Due to the need for a proper quality control and tack coat material selection method, several in-situ tack coat evaluation test methods and instruments have been proposed. In this section, some of the current field tests methods for evaluation of the tack coat bond strength are presented.
2.1.1 Louisiana Tack Coat Quality Tester (LTCQT)
Figure 2.1 ATackerTM test device (Mohammad et al. 2012).
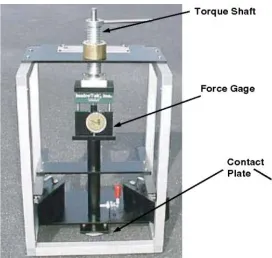
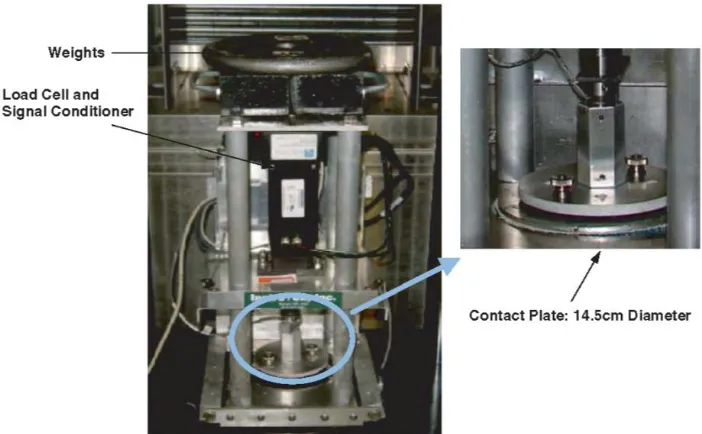
Figure 2.2 Second generation LTCQT device with 14.5 cm diameter contact plate (Mohammad et al. 2009).
The LTCQT has the following components and specifications.
LTCQT – The device is equipped with a closed-loop servo-motor actuator for
precision control of the rate of displacement during testing. It is capable of measuring loads up to 446 N (100 lb.) with an accuracy of ±1 percent. The displacement of the actuator is measured using a position transducer that has a total travel distance of 100 mm.
Computer and software – The software is designed such that it displays the time, normal load, and displacement of the actuator continuously during testing while graphically illustrating the relationship of the normal load and time. It allows the user to input the required compressive load, the time to hold the compressive load, and the displacement rate required. The actual holding time of the compressive load is
Heating source (infrared reflective heating lamp, IRH) – This device is equipped with a 250 watt, 120 volt bulb. It is designed such that it can be positioned six inches from the surface so that heating can be conducted without the device making contact with the tacked surface.
Weights – The weights used are equal to or greater than the expected maximum normal load. Note that the normal load applied by the machine cannot exceed 446 N (100 lb.).
Temperature control devices and Thermometer– The mechanism of the temperature control device can adjust the surface temperature to the required test temperature. It is recommended that a fan be used to cool the tacked surface and a heat gun be used to heat the tacked surface. An infrared thermometer should be utilized for measuring the temperature of a tacked surface without directly contacting the test area.
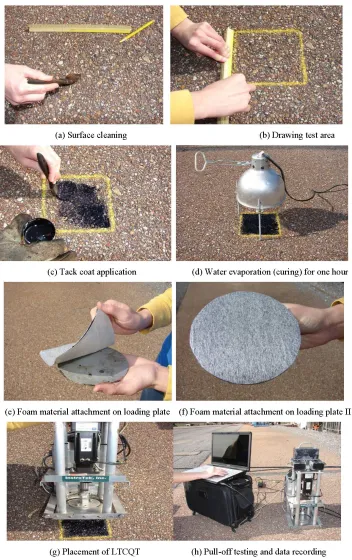
The LTCQT tack coat bond strength test procedure is shown in Figure 2.3. In the first step, an infrared reflective heating (IRH) lamp is used to accelerate breaking and curing of tack coats. Surface temperature is allowed to cool down to the testing temperature and The LTCQT is placed on the cured tacked surface.
A compressive normal stress of 10.8 kPa (1.57 psi) is applied to the surface by the LTCQT loading plate for 3 min. Then, a tensile force is applied at a displacement rate of 0.2 mm/s (0.00787 in/s) until failure. The tests results for a series of LTCQT tests for
temperature range from 30°C to 80°C (86°F to 176°F) and four tack coat materials at a residual application rate of 0.23 L/m2 (0.05 gal/yd2 ) are shown in the Figure 2.4. The
Figure 2.4 Variation of mean tensile strength versus temperature for tack coats tested by LTCQT (Mohammad et al., 2009).
2.1.2 University of Texas at El Paso Pull-off Test
The pull-off test was developed at the University of Texas, El Paso (UTEP),
Figure 2.5 UTEP pull-off test set-up (Tashman et al., 2008).
The test result for PG64-22 is shown in Figure 2.6. The tests were performed at three different set times and at three different temperatures in laboratory.
Tashman et al. (2006) reported that The UTEP pull-off contact plate did not adhere properly to the milled surface as well as it did to the nonmilled surface. Hence, the UTEP pull-off test results indicated that the nonmilled sections had higher tensile strength than the milled ones, which is not the case and is mainly due to the lack of proper adherent of the contact plate and the tack coat surface.
2.2
Laboratory shear bond strength evaluation methods
The bond strength between asphalt layers in an existing pavement is an important parameter that affects the service life of the pavement structure (Kruntcheva et al. 2005). Several researchers have developed direct shear measurement devices to evaluate shear bond strength with and without confinement. In the United States, the Florida Department of Transportation has adopted a procedure without application of normal confinement force with the resulting specification designated as FM 5-599, (Florida Department of
Transportation, 2012).
The Ancona Shear Testing Research and Analysis (ASTRA) test device developed at the Universita` Politecnica delle Marche, Italy,(Canestrari et al. 2013), allows the application of a normal confining load while conducting a direct shear test, that is used as standardized tests in Italy (Standard UNI/TS 11214) to measure asphalt interface bond strength,
(Canestrari et al. 2013).
2.2.1 Florida DOT Shear Test
Figure 2.7 Florida DOT shear bond strength evaluation test device (Tashman et al., 2006).
Figure 2.8 shows the tests results for milled and nonmilled field cores tested by FDOT shear strength test device.
2.2.2 The Ancona shear testing research and analysis (ASTRA) device
The ASTRA device, which is designed at the Università Politecnica delle Marche, by Canestrari et al. (2013), is a direct shear test method. The ASTRA test device allows the application of a normal confining load while conducting a direct shear test. Figure 2.9 shows the ASTRA device.
Figure 2.9 ASTRA direct shear device with normal load (Canestrari et al., 2013).
In the RILEM inter-laboratory studies by Canestrari et al.( 2013) the shear strength of the interface was measured by ASTRA test device for number of the samples that were cored from a newly laid asphalt pavement near Ancona (Italy). The trial section was 3.5 m (11.48 ft) wide and about 20 m (65.62 ft) long as shown in Figure 2.10, and composed of two layers. The lower layer was 70 mm (2.75 in.) thick, and the upper layer was 30 mm (1.18 in.) thick.
Three different interface conditions were chosen in the study by Canestrari et al. (2013).
Pavement 1: without treatment (no tack coat)
Pavement 2: pre-coated with a polymer-modified emulsion
Pavement 3: pre-coated with a conventional cationic emulsion
In the first step of the trial section construction, the unbound material was compacted to provide both a regular and flat base surface for placing the two uppermost courses. The same day, the binder course was laid and compacted, obtaining a layer thickness of about 70 mm (2.75 in). Two weeks later, the polymer-modified emulsion and conventional cationic emulsion were applied manually with a brush on the binder course of Pavement 2 and Pavement 3, respectively. The application rate for the tack coat material was about 150 g/m2 (0.034 gal/yd2) of residual bitumen for both pavement sections. After 6 hours of curing time for the emulsions, the wearing courses were laid and compacted. Figure 2.11 shows the trial section construction.
The RILEM tests results for original program are shown in Table 2.1.
Table 2.1 RILEM shear tests results (original program) – Number of laboratories (p), mean shear stress (
) and mean displacement (Δu) at maximum shear load (Canestrari et al.2013)2.3
Factors affecting the bond strength between asphalt layers
shown in Figure 2.12, (Raab et al. 2009). Some of the parameters effects are presented in this section.
Figure 2.12 Factors influencing a durable bond between layers (Raab et al., 2009).
divergent results regarding the influence of normal stress, tack coat type and surface roughness has been reported by different research report, (Raab et al. 2009)
2.3.1 Surface condition: Milled versus nonmilled
According to the study by Tashman et al. (2006), the milled sections had higher shear strength than the nonmilled sections. Figure 2.13 show the effects of milling on shear bond strength with different tack coat application rates and curing times, which were measured by FDOT testing instrument.
Figure 2.13 Effect of residual rate (CSS-1, L/m2) nested within curing time for milled and nonmilled surface with FDOT shear strength test (Tashman et al. , 2006).
2.3.2 Modified emulsion versus ordinary emulsion
Figure 2.14 peak shear strength versus temperature for laboratory samples, short curing time and 0.4 MPa confining normal force (Canestrari et al., 2005).
2.3.3 Base and subgrade strength
According to Chen (2010) based on dynamic cone penetrometer (DCP) tests performed at the site of the distressed pavement due to the slippage failure, the slippage distress was not associated with the base or subgrade stiffness.
2.3.4 Surface roughness
Figure 2.15 Graphical results for different interface surface condition a) surface with no treatment, b) Chipping 5/10, c) De-bitumening (D’Andrea et al. 2013).
2.3.5 Tack coat Application rate
Some international recommendations suggestions about the optimum tack-coat amount are as follows (Canestrari et al. 2013):
In India, tack-coat amount is chosen as a function of existing pavement surface conditions in terms of bitumen content;
The Federal Aviation Administration confirmed that the amount of tack-coat must be chosen carefully, taking into account the condition of the existing pavement surface, both for airport pavements and road constructions;
Table 2.2 shows the tack coat’s application rate base on the manual of the Flexible Pavements of Ohio (Flexible Pavements of Ohio, 2012).
Table 2.2 Tack coat application rates (Flexible Pavements of Ohio, 2012.)
Existing Pavement Condition Residual L/m
2
(gal/yd2)
Undiluted L/m2
(gal/yd2)
Diluted(1:1) L/m2
(gal/yd2)
New Asphalt 0.135 to 0.18
(0.03 to 0.04)
0.225 to 0.27 (0.05 to 0.06)
0.45 to 0.54 (0.10 to 0.12)
Oxidized Asphalt 0.225 to 0.27 (0.05 to 0.06)
0.36 to 0.405 (0.08 to 0.09)
0.675 to 0.81 (0.15 to 0.18)
Milled Surface (asphalt) 0.225 to 0.27 (0.05 to0.06)
0.36 to 0.405 (0.08 to 0.09)
0.675 to 0.81 (0.15 to 0.18)
Milled Surface (PCC) 0.18 to 0.225 (0.04 to 0.05)
0.27 to 0.36 (0.06 to 0.08)
0.54 to 0.675 (0.12 to 0.15)
Portland Cement Concrete 0.18 to 0.225 (0.04 to 0.05)
0.27 to 0.36 (0.06 to 0.08)
0.54 to 0.675 (0.12 to 0.15)
Direct shear tests conducted on different tack coats during NCHRP Project 9-40 (Mohammad et al., 2012) indicate that all tack coat materials showed the highest interface shear strength at the highest application rate of 0.697 L/m2 (0.155 gal/yd2). Therefore, within the tested application rate range, it was difficult to determine the optimum residual
Figure 2.16 Effects of residual application rates and tack coat types on interface shear strength for old HMA surface (Mohammad et al., 2012).
Figure 2.18 Effects of residual application rates and tack coat types on interface shear strength for milled HMA surface (Mohammad et al., 2012).
Table 2.3 presents the recommended tack coat residual application rates for different surface types based on NCHRP 9-40 (Mohammad et al. 2012).
Table 2.3 Recommended tack coat application rates (Mohammad et al. 2012)
Surface Type Residual Application Rate
L/m2 (gal/yd2)
New Asphalt Mixture 0.1575 (0.035)
Old Asphalt Mixture 0.2475 (0.055)
Milled Asphalt Mixture 0.2475 (0.055)
Chapter 3
Mechanistic design of asphalt layers
interface
To design the pavement layers interface correctly, the stresses at the pavement interface and in asphalt layers should be predicted accurately and the relationships among shear strength, shear strain rate, and the normal stress at the interface of a layered pavement structure should be understood and included in the design of the interface.
When the shear bond strength of a tacking material is to be determined in a shear test, it is important to use the normal confining pressure, that is calculated at the interface of interest in a given pavement section using a pavement analysis that represents the in-situ environmental and traffic loading conditions as realistic as possible.
In this study, the pavement responses were determined using the Layered Visco-Elastic pavement analysis for Critical Distresses (LVECD) computer program, which was developed at North Carolina State University. The pavement structure, loading conditions, climatic conditions, and asphalt layers, base, sub-base and sub-grade material properties were the LVECD input parameters.
3.1
Predicting the shear failure of the interface and defining the failure
criteria
For the purposes of this study, the pavement section that is shown in Figure 3.1 was analyzed under an 80-kN (18 kips) axle load, moving at a speed of 8 km/hour (5 mph). The load was applied using a super single tire configuration with 827.4 kPa (120 psi) tire pressure, and the pavement temperature used was 60°C (140°F). The wheel was assumed to be in the braking state with the coefficient of friction between the wheel and pavement surface assumed to be 0.66 (AASHTO 1976).
The aggregate base course was 20.32 cm (8 in.) thick and the sub-grade layer was considered an infinite layer of soil (A6). The aggregate base and the sub-grade were assumed of linearly elastic materials. The materials properties and the layers thickness of the pavement structure are presented in Table 3.1. The Dynamic modulus tests results for the asphalt layers are shown in Table 3.2.
Figure 3.1 Cross-section of pavement structure (Karshenas et al., 2014 and Cho, 2015).
Table 3.1 Layer thicknesses and materials properties (Karshenas et al., 2014 and Cho 2015)
Pavement Layer
Mixture Type
Layer Thickness cm
(in.) Poisson’s Ratio
Layer Modulus
MPa (ksi)
Asphalt Concrete
S9.5B 3.81
(1.5) 0.35 Based on Mastercurve Data (Table 3.2)
I19B 12.70
(5) 0.35 Based on Mastercurve Data (Table 3.2)
Base ABC 20.32
(8 in) 0.40
270.63
(39.251)
Subgrade A6 Infinite 0.45 68.5
Table 3.2 Asphalt concrete material properties (Karshenas et al., 2014 and Cho, 2015)
Mixture Type S9.5B I19B
Temperatur e (°C )
Frequency (Hz)
|E*| (MPa)
Phase Angle (deg)
|E*| (MPa)
Phase Angle (deg)
-10
25 22801 6.0 23712 5.6
10 22008 6.1 23085 5.3
5 21309 6.4 22372 5.4
1 19152 7.2 20149 6.1
0.5 18352 7.7 19343 6.3
0.1 16190 9.2 17266 6.9
5
25 15709 10.1 16974 7.9
10 14189 11.2 15550 9.8
5 13230 11.3 14529 10.1
1 10871 12.6 12131 11.3
0.5 9980 13.4 11191 12
0.1 7864 16.2 9041 14.5
20
25 7926 17.1 9118 16.7
10 6735 18.9 7859 17.8
5 5839 20.4 6899 19.3
1 4013 24.1 4862 22.9
0.5 3420 25.6 4160 24.4
0.1 2192 30.3 2719 29.2
40
25 1938 33.7 2576 32.2
10 1377 36.0 1863 35.8
5 1064 36.5 1472 36.7
1 693 40.1 849 39.1
0.5 483 37.4 659 38.0
0.1 308 35.3 405 36.8
54
25 658 39.6 863 38.8
10 473 38.9 601 38.4
5 378 37.3 465 36.8
1 234 32.6 272 32.8
0.5 209 29.5 229 30.6
In order to compare the applied stress to the bond strength of the interface, it was necessary to determine the shear strain rate due to applied load at the interface. Figure 3.2 shows a typical shear strain history as a function of time for a longitudinal axis of the tire at the interface. The shear strain at each point of interest was computed using Equation (1).
2 2
max x y
(1)
where
= shear strain in the transverse direction under the tire, and
= shear strain in the longitudinal direction under the tire.
The shear strain levels for the parallel longitudinal axes in the transverse sections were determined from the LVECD program for the 8 km/hour (5 mph) speed under consideration. The shear strain history as a function of time was then used to compute the shear strain rates at each of the transverse sections using the bisectional method presented in Figure 3.2.
The normal and shear stress distributions were calculated for the analysis using LVECD at each point under the wheel and at the interface between the pavement layers. The normal and shear stress distributions at the layer interface determined from LVECD analysis are shown in Figure 3.3 and Figure 3.4.
Figure 3.3 Single tire normal stress distribution at the layer interface; half of the tire imprint is shown due to symmetry (Karshenas et al., 2014).
Figure 3.4 Single tire shear stress distribution at the layer interface; half of the tire imprint is shown due to symmetry (Karshenas et al., 2014).
The tire-pavement contact area in the LVECD program is a rectangular with an aspect ratio of 11/7 (length/width), as shown in Figure 3.5. From Figure 3.4, the maximum shear stress at the layer interface was observed to occur on the central longitudinal axis at a distance of 12.3 cm (4.84 in.) from the center of the tire. The maximum normal stress at the layer interface was observed to be in the longitudinal direction at a distance of 5.3 cm (2.1 in.) from the center of the tire. It was noted that the shift in the location of the maximum normal stress off the center in the direction of traffic was attributed to the braking force. Figure 6 shows the locations of the maximum shear and normal stress.
Figure 3.5 Single tire footprint used in LVECD program and location of maximum shear stress, normal stress, and critical shear ratio (Karshenas et al., 2014).
3.1.1 Shear strength prediction of asphalt layers interface
Based on the shear test results by Canestrari et al. (2013), Equation (2) was proposed to calculate the shear strength at different temperatures:
10
x
x T
aT b
, (2)= shear strength at temperature in (MPa), and
= temperature (C).
The coefficients a and b in Equation (2) are shown in Table 3.3 for the three different pavement interface structures.
Table 3.3 Coefficients a and b for three different asphalt layers interface conditions for shear test without normal stress (Canestrari et al. 2013)
D mm
(in.)
v mm/min
(in./min)
Pavement 1
(No Tack)
Pavement 2
(Polymer-Modified Tack)
Pavement 3
(Cationic Tack)
a b R2 a b R2 a b R2
100 (3.936)
2.5
(0.098) -0.021 -0.013 1.00 -0.026 0.308 0.99 -0.023 0.334 0.99
100 (3.936)
50
(1.968) -0.016 0.211 0.92 -0.025 0.612 1.00 -0.02 0.611 0.97
150 (5.9)
50
(1.968) -0.026 0.369 0.94 -0.026 0.586 1.00 -0.026 0.638 0.99
To consider the effect of loading rate and normal stress on shear strength, Canestrari et al. (2013) proposed the following Equations (3) and (4).
0.22 1
1
( x )
vx v
v v
, (3)
where
= shear strength at displacement rate 1 (MPa)
= test displacement rate 1(mm/min),
= shear strength at displacement rate x (MPa) and
= test displacement rate x. (mm/min)
0
(1 0.38 ) (0.74 )
n n n
(4)
= shear stress with normal stress (MPa),
= shear stress without normal stress (MPa), and
= normal stress (MPa)
Using Equations (2), (3), and (4), the shear strength levels of the bonded layers for different normal stress magnitudes and temperatures were computed and are presented in Figure 3.6. Consistent with Equation (4), the Figure 3.6 shows the shear strength as the linear function of the normal stress at 5°C, 30°C, and 60°C, (41°F, 86°F and 140°F) with a
displacement rate of 2.5 mm/min (0.098 in./min) for the cationic emulsion.
Figure 3.6 Shear strength versus normal stress for 100 mm (3.936 in.) sample, 2.5 mm/min (0.098 in./min) rate of loading, cationic emulsion, based on equations by Canestrari et al.
(2013) (Karshenas et al., 2014).
3.1.2 Critical shear ratio and interface shear failure criterion
In order to determine the integrity of the interface bond under a tire loading, for the purpose of analysis in this study it was assumed that the asphalt concrete layers in the pavement structure shown in Figure 3.1 were tacked using the same material (cationic tack) as used in the study by Canestrari et al. (2013).
0 0.5 1 1.5 2 2.5 3 3.5
0 0.2 0.4 0.6 0.8 1 1.2 1.4
S
h
e
a
r
S
tr
e
n
g
th
(
M
P
a
)
Normal Stress (MPa) T=60°C
T=30°C
Using Equations (2), (3)and (4) the shear bond strength was computed for the 60°C condition using the normal stress and the shear strain rate determined from the LVECD analysis. In order to use Equation (3), it was necessary to transform the rate of the load application in Equation (3) to a strain rate. This transformation was achieved by dividing the rate of loading for the bond strength test shown in Table 3.3 by the gap width between the two caps of the shear box used in the laboratory shear tests by Canestrari et al. (2013) to obtain the shear strain rate for the test.
The shear bond strength (s for each point under consideration at the layer interface
was computed using the strain rate and the corresponding normal stress (normal
confinement). In the literature, researchers typically directly compare the induced shear stress at the interface layer due to wheel loading (in most cases at the edge of the tire) to the shear bond strength obtained from laboratory or field testing. If at any location on the interface the induced shear stress were greater than the shear bond strength, then this occurrence simply would imply imminent shear failure in the asphalt concrete layers. However, it is important to note the contribution of normal stress in the failure criterion.
In this study, the ratio of the computed shear stress (max) to the shear bond strength
(s) is used as the shear failure criterion. The profile of the shear stress ratio (max/s) under
the tire at the asphalt concrete layer interface was developed to determine the maximum shear stress ratio, which is termed the critical shear ratio (CSR). The shear ratio is given by Equation (5).
maxs
Shear ratio SR
, (5)
where
2 2
max x y
,
= shear stress in the transverse direction at the interface calculated by the LVECD
= shear stress in the longitudinal direction at the interface calculated by the
LVECD program, and
= shear bond strength (function of normal stress) obtained from Equation (4)
Figure 3.7 shows the distribution of the shear ratios at the layer interface under the assumption of the cationic tack coat interface properties that are the same as the test section used by Canestrari et al. (2013). The CSR in this extreme case of 60°C (140°F) turns out to be 1.01. That is, the induced shear stress at the location of the CSR (not to be confused with the maximum shear stress under the tire footprint) is roughly equal to the shear bond strength (accounting for the contribution of normal stress at the same location and the calculated shear strain rates). The location of the CSR, which is termed the critical shear failure location, is at a distance of 17.6 cm (6.9 in.) from the center of the tire imprint along the central
longitudinal axis, which happens to be just in front of the tire, as opposed to the locations of the maximum normal stress and shear stress that occur within the tire imprint shown in Figure 3.5. The magnitude of the normal stress that corresponds to the CSR is 0.13 MPa (18.85 psi), as shown in Figure 3.8.
(b)
Figure 3.7 (a) Shear ratio profile, (b) shear ratio contour under the tire at layer interface; half of the tire imprint is shown due to symmetry (Karshenas et al., 2014).
Figure 3.8 Shear ratio, shear and normal stresses in longitudinal direction under central axis of the tire at layer interface (Karshenas et al., 2014).
28.1 21.1 14.1 7.0 0.0 -7.0 -14.1 -21.1 -28.1
0.0 3.8 7.6 10.7 14.5 18.3
D is ta n c e f ro m C e n te r o f T ir e i n L o n g it u d in a l D ir e c ti o n ( c m )
Distance from Center of Tire inTransverse Direction
1-1.1 0.9-1 0.8-0.9 0.7-0.8 0.6-0.7 0.5-0.6 0.4-0.5 0.3-0.4 0.2-0.3 Ƭmax/Ƭs for Cationic Tack Coat
Half of the Tire imprint Location D ir e c ti o n o f T ra ff ic (cm) Tire Central Longitudinal Axis Critical Shear Ratio 0 0.2 0.4 0.6 0.8 1 1.2 -0.1 0 0.1 0.2 0.3 0.4 0.5 0.6 0.7 0.8 0.9
-30 -24 -18 -12 -6 0 6 12 18 24 30 Ƭma
x /Ƭs for Cationic T a c k Coat Stres s (M Pa )
Distance from Center of Tire in Longitudinal Direction (cm)
Normal Stress
Shear Stress
The spectrum of normal stress (normal confinement) that is used to evaluate shear bond strength using direct shear test devices encompasses zero to full passive confinement. The magnitude of the normal confinement used to determine the bond strength would have a profound effect on the tack coat product quality control/quality acceptance (QC/QA)
specifications and the performance of the asphalt pavement and its surface layer thickness design.
In the example analysis presented in this study, the CSR (max/s)max is observed to be
around 1.01, accounting for the contribution of normal stress (normal confinement) while determining the shear bond strength. That is, at the critical failure location, defined in this study as the location of the maximum shear ratio, the maximum shear stress is roughly equal to the shear bond strength, accounting for the contribution of the normal stress at that
location. If the shear bond strength is evaluated without normal confinement, the maximum shear stress ratio turns out to be almost 5.0; that is, the applied shear stress is five times the strength of the bond (bond strength evaluated in the unconfined condition) at the maximum shear location. Clearly, this design would be unacceptable. The only way to correct this deficiency is to substitute the tack coat material with one that has higher bond strength, which may be cost-prohibitive alternative.
The other common alternative for shear testing is to use passive confinement, i.e., fixed boundaries in the normal direction to the interface. Tayebali et al. (2004) reported that the normal stress levels developed for asphalt concrete specimens subjected to the constant height shear test (i.e., passive confinement) using the Superpave shear tester were 0.968 MPa (143 psi), 0.641 MPa (93 psi), and 0.345 MPa (50 psi) at 20C, 40C, and 60C, (68F,104F and 140F) respectively. The normal stress that corresponds to the CSR is 0.13 MPa (18.85 psi) at 60C (140F), which is much lower than 0.345 MPa (50 psi) measured in the passive confinement condition.
3.2
Mechanistic approach for predicting tensile crack
To predict the tensile crack in surface layer of a multilayer pavement structure, the material responses (tensile strength) of the asphalt layer and the structural response or state of stress in the structure (tensile stress) should be defined. The material response should be predicted by proper tests methods to measure the tensile strength of the pavement layers material.Besides, the structural responses should be computed by suitable analysis software, which should accommodate the required materials models.
3.2.1 Tensile stress analysis in the surface layer of a pavement section
In this study, the stress distributions on the surface of the pavement structure and along the interface between asphalt layers were calculated by using Layered Visco-Elastic pavement analysis for Critical Distresses (LVECD) computer program. The LVECD
software is capable of applying realistic vehicle loads including the braking effects. Besides, it can model the complex asphalt materials viscoelastic behavior.
The pavement structure shown in Figure 3.1 with the pavement layers material properties presented in Table 3.1 and Table 3.2 was used for analysis purpose in this study and as the input data for the LVECD computer program.
The stress distribution in the pavement layers were predicted due to a wheel in the braking state with the standard axle load of 80 kN (18 kips) and a tire pressure of 827.4 kPa (120 psi) which is moving at the speed of 8 km/hour (5 mph) and with the pavement
Figure 3.9 Stresses at the surface of pavement due to a braking wheel, v=8 km/h (5 mph), 0.55 friction coefficient and 60C (140F), (Tensile stress is negative).
The maximum horizontal tensile stress at the back of the wheel on the surface of the pavement with the assumed analysis condition (T=60C, v=8 km/h, =0.55) was predicted to be 647 kPa (93.8 psi). The tensile strength of the asphalt layer should be estimated and compared to the tensile stress at the surface of the pavement to forecast the tensile failure (vertical crack) at the back of the tire. Based on the stress distribution shown in Figure 3.9 , the schematic failure modes at the interface and in the surface layer of the pavement structure are illustrated in Figure 3.10. According to the Karshenas et al (2014), the location of the critical shear ratio is in front of the wheel that is shown in Figure 3.10.
-800 -600
-400 -200 0 200 400 600
800 1000 1200 1400
-30 -24 -18 -12 -6 0 6 12 18 24 30
S
tr
e
s
s
(
K
P
a
)
Distance From Center of Tire in longitudinal direction (cm)
Figure 3.10 Schematic failure modes at the interface and in the surface layer.
3.2.2 Predicting the tensile strength of asphalt surface layer
Due to the viscoelastic material characteristic of the Hot Mix Asphalt (HMA), the tensile strength of the asphalt concrete is a function of the tensile strain rate and temperature. In a study by Li et al. (2012), a model was proposed for predicting the tensile strength of the asphalt concrete mixture.
The model is based on the Uniaxial Tensile Strength (UTS) tests of the asphalt concrete mixture and the Dynamic Shear Rheometer (DSR) test results of the extracted binder, (Li et al., 2012).Li et al. (2012) proposed Equation (6) for predicting the tensile strength of hot mix asphalt. The model gave a realistic value for the tensile strength of the asphalt mixture verification tests results. In Figure 3.11, the verification tensile test results and the prediction of the tensile strength by the model at different temperatures are presented.
4 33 0 19
18 4 20
122 20
0 0583
6 05 5 636 73 7 1
10
. .
t . (T )
(T )
.
f . . exp .
, (6)
Where
f t= tensile strength (MPa),
= tensile strain rate ( ) andT = Temperature (C)
Tensile mode
s
Shear mode
s
Compression mode
Figure 3.11 Results of the tensile strength verification tests and the model tensile strength prediction (Li et al., 2012).
The small value of the Mean Percentage Relative Error (MPRE) shown in Table 3.4 for the verification test results suggests that the model can predict the tensile strength of the asphalt mixture for a wide range of temperatures and strain rates with good accuracy.
Chehab (2002) constructed the master curve of the peak tensile stress with respect to reduced strain rate as Shown in Figure 3.12.
Table 3.4 Results of the verification test (Li et al., 2012)
Sample
code T C (F) Strain rate [%/s] ft ,MPa (psi) Predicted ft ,MPa (psi) Error [%] C-7-6 2 (35.6) 0.753 5.98 (867.3) 6.05 (877.47) 1.19 C-8-6 12.9 (55.22) 0.584 5.77 (836.8) 5.96 (864.42) 3.28 C-8-9 12.9 (55.22) 1.05 6.02 (873.1) 6.02 (873.1) 0.02 C-7-2 38 (100.4) 4.43 1.14 (165.3) 1.24 (179.8) 8.70
Figure 3.12 Tensile strength mastercurve as a function of the reduced strain rate (crosshead and LVDT) at 25C (77F) (Chehab, 2002).
Comparing the predicted tensile strength at 25C (77F) by Li et al (2012) model, which is presented in Figure 3.13, with the strength master curve by Chehab (2002) in Figure 3.12, exhibits a very good correlation between the measured tensile strength by Chehab (2002) to the predicted tensile strength by Equation (6).
Figure 3.13 Tensile strength of asphalt concrete mixture at 25C (77F) versus strain rate, based on Li et al (2012) calculated by Equation (6).
Tens
il
e
S
trengt
h (M
P
a
)
The Tensile strain rates, for using in the tensile strength prediction model, Equation (6), was calculated by the bilinear method. Figure 3.14 shows a typical tensile strain response calculated by LVECD program at the surface of the pavement in the central longitudinal axis of the tire imprint. The procedure of the bilinear method calculation of the tensile strain rate is shown in the Figure 3.14.
Figure 3.14 Typical tensile strain history at the surface of the pavement in the central longitudinal axis of the tire imprint and bilinear calculation of the strain rate.
3.2.3 Tensile failure prediction due to a braking wheel
The tensile stress in the surface layer of the asphalt pavement due to a braking wheel should be compared to the predicted tensile strength of the asphalt layer to forecast the tensile failure at the back of the tire.
The ratio of the computed tensile stress (σmax) to the tensile strength (ft) is used as the
tensile failure criterion. The maximum tensile stress ratio is termed the critical tensile ratio
(CTR). The Tensile stress ratio is given by Equation (7).
-2.50E-03 -2.00E-03 -1.50E-03 -1.00E-03 -5.00E-04 0.00E+00 5.00E-04 1.00E-03 1.50E-03 2.00E-03 2.50E-03 3.00E-03
0.4 0.6 0.8 1 1.2
S
tr
a
in
(
1
/s
)
Time (s) Peak strain
Ɛyy, Z=0, T=60C, v=5 mph, μ=0.55
max tTensile Ratio TR f
(7)
where
2 max
2
1 1
)
2 )
( (
2 xx yy xx yy xy
= Horizontal tensile stress calculated in the pavement in the transverse direction
by the LVECD program,
= Horizontal tensile stress calculated in the pavement in the longitudinal
direction by the LVECD program, and
=Shear stress in the X-Y plane calculated in the pavement by the LVECD
program,
= Tensile strength obtained from Equation (6)
Pavement temperature, vehicle speed and friction coefficient between the tire and the asphalt surface affect the structural responses and tensile strength of the pavement structure. Effects of each of these factors will be studied in the following sections.
3.2.4 Effect of vehicle speed on the tensile failure
(a)
(b)
Figure 3.15 Horizontal stress (σyy) on the surface of the pavement due to braking wheel.
The tensile strengths of the asphalt pavement at 60°C (140F) and 20°C (68F) were calculated as the function of strain rates and temperatures using Equation (6). At 60C (140F) (high temperature), The tensile strength increases slightly at the higher speeds due to
-1000 -500 0 500 1000 1500
-30 -24 -18 -12 -6 0 6 12 18 24 30
S tr e s s ( K P a )
Distance From Center of Tire in longitudinal direction (cm)
σyy, Z=0, T=60 C, v=8 km/h , μ=0.55 σyy, Z=0, T= 60 C, v=40.2 km/h , μ=0.55 σyy, Z=0, T= 60 C, v=88.5 km/h, μ=0.55
-500 0 500 1000 1500 2000 2500
-30 -24 -18 -12 -6 0 6 12 18 24 30
S tr e s s ( K P a )
Distance From Center of Tire in longitudinal direction (cm)
the higher strain rate as is shown in Figure 3.16. However, at 20C (68F) (intermediate temperature) the tensile strength increases significantly due to the increasing vehicle speed (higher strain rate). The maximum tensile stress decreases slightly at higher speeds for both temperatures; 20C (68F) and 60C (140F) as illustrated in Figure 3.16.
(a)
(b)
Figure 3.16 Tensile strength and maximum tensile stress with respect to speed at (a) 60C (140F)and (b) 20C (68F).
0 100 200 300 400 500 600 700
0 20 40 60 80 100
S tr e s s ( k P a ) Speed(km/h)
Maximum Tensile Stress T=60 C μ=0.55
Tensile Strength T=60 C μ=0.55
0 500 1000 1500 2000 2500 3000 3500 4000 4500 5000
0 20 40 60 80 100
S tr e s s ( k P a ) Speed(km/h)
Maximum Tensile Stress T=20 C, μ=0.55
Figure 3.17 displays the location of the maximum horizontal tensile stresses on the surface of the pavement. The Maximum horizontal tensile stress occurs at 15.7 cm (6.18 in.) from centre of tire in the opposite direction to the applied braking shear force (back of the tire) and maximum compression stress occurs at 10.57 cm (4.16 in.) from center of tire in direction of traffic.
In Table 3.5, the maximum tensile stresses and the corresponding tensile strengths are presented. Table 3.5 demonstrates that the pavement tensile strength at 60C (140F) is less than the corresponding maximum tensile stress and therefore, the section will fail in tension under the analyzed condition at 60C (140F). At 20C (68F), the tensile strength is higher than corresponding maximum tensile stress, and therefore, no failure is anticipated.
Table 3.5 Comparison of peak tensile stress and tensile strength for 60C (140F) and 20C (68F) with the coefficient of friction of 0.55
Analysis case Tensile stress
kPa (psi)
Tensile Strength
kPa (psi)
Critical Tensile Ratio
CTR
Fail or pass
Z=0, T=60C (140F), v=8 km/h (5 mph),
μ=0.55 647 (94) 431 (63) 1.50 Fail
Z=0, T=60C(140F) , v=40.2 km/h (25
mph), μ=0.55 608 (88) 458 (66) 1.33 Fail
Z=0, T=60C (140F), v=88.5 km/h (55
mph), μ=0.55 586 (85) 473 (69) 1.23 Fail
Z=0, T=20C(68F) , v=8 km/h (5 mph),
μ=0.55 263 (38) 1200 (174) 0.22 Pass
Z=0, T=20C (68F), v=40.2 km/h (25
mph), μ=0.55 181 (26) 3000 (435) 0.06 Pass
Z=0, T=20C (68F), v=88.5 km/h (55
mph), μ=0.55 193 (28) 4320 (627) 0.04 Pass
3.2.5 Effect of Temperature on tensile failure
Asphalt concrete is a viscoelastic material. Therefore, the tensile stress and strength of asphalt concrete are expected to be highly temperature dependent. Figure 3.18 shows the variation of the tensile stresses at various temperatures at the constant speed of 8 km/h (5 mph) with the friction coefficient of 0.55 between a braking wheel and asphalt surface. As it is shown in Figure 3.18, the tensile stress increases with increasing temperature. Conversely, as is shown in Figure 3.19, the tensile strength of the asphalt concrete decreases with the increasing temperature. The tensile strength of the asphalt concrete at low temperature, 5C (41F), is significantly higher than the tensile strength at higher temperature, 60C (140F).
Figure 3.18 Horizontal stress (σyy) on surface of the pavement due to a braking wheel.
Figure 3.19 Tensile strength and tensile stress versus temperature.
-1000 -500 0 500 1000 1500 2000 2500
-30 -20 -10 0 10 20 30
S tr e s s ( K P a )
Distance From Center of Tire in longitudinal direction (cm)
σyy, Z=0, T=60 C, v=8 km/h, μ=0.55 σyy, Z=0, T=40 C, v=8 km/h, μ=0.55 σyy, Z=0, T=30 C, v=8 km/h, μ=0.55 σyy, Z=0, T=20 C, v=8 km/h, μ=0.55 σyy, Z=0, T=5 C, v=8 km/h, μ=0.55
0 1000 2000 3000 4000 5000 6000 7000
0 5 10 15 20 25 30 35 40 45 50 55 60 65
S tr e s s ( k P a )
Temperature ( C)
Table 3.6 Comparison of the peak tensile stress and tensile strength for 8 km/h (5 mph) and coefficient of friction of 0.55 at different temperatures
Analysis case Tensile stress
kPa (psi)
Tensile Strength
kPa (psi) CTR Fail or pass
Z=0, T=60C (140F), v=8 km/h (5 mph),
μ=0.55 647 (94) 431 (63) 1.5 Fail
Z=0, T=40C(104F) , v=8 km/h (5 mph),
μ=0.55 514 (74) 828 (120) 0.62 Pass
Z=0, T=30C (86F), v=8 km/h (5 mph),
μ=0.55 406 (59) 783 (114) 0.51 Pass
Z=0, T=20C (68F), v=8 km/h (5 mph),
μ=0.55 263 (38) 1200 (174) 0.22 Pass
Z=0, T=5C (41F), v=8 km/h (5 mph),
μ=0.55 195 (28) 6034 (875) 0.03 Pass
3.2.6 Effect of friction coefficient on the tensile failure
Friction is the force that resists the relative motion of bodies. The coefficients of friction can be derived from the stopping distance and the speed of the vehicle. Three friction coefficients of 0.35, 0.45 and 0.55 were investigated in this study. As is shown in Figure 3.20, the tensile stress on the surface of the pavement due to a braking wheel decreases with the decreasing friction coefficients.
In Figure 3.21, the tensile strength and stress for different friction coefficients are compared. As shown, the pavement surface layer will fail due to a braking wheel with
Figure 3.20 Horizontal stress (σyy) in the surface of a pavement due to the shear force of a
braking wheel.
Figure 3.21 Tensile strength and tensile stress with respect to the friction coefficient.
To consider both effects of the speed of the vehicle and friction coefficient on tensile strength and tensile stress, three different combinations of speeds and friction coefficients at
-1000 -500 0 500 1000 1500
-30 -24 -18 -12 -6 0 6 12 18 24 30
S
tr
e
s
s
(
K
P
a
)
Distance From Center of Tire in longitudinal direction (cm)
σyy, Z=0, T=60 C, v=8 km/h, μ=0.55
σyy, Z=0, T=60 C, v=8 km/h, μ=0.45
σyy, Z=0, T=60 C, v=8 km/h, μ=0.35
0 100 200 300 400 500 600 700
0.3 0.35 0.4 0.45 0.5 0.55 0.6
S
tr
e
s
s
(
k
P
a
)
Friction Coefficient
Maximum Tensile Stress Z=0, T=60 C,v=5 mph